
AT40 = 48.9% of stocks are trading above their respective 40-day moving averages (DMAs)
AT200 = 47.5% of stocks are trading above their respective 200DMAs
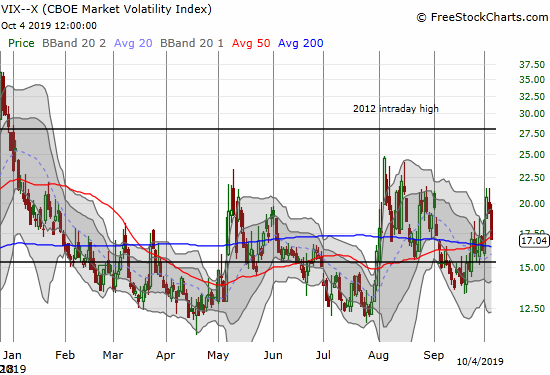
VIX = 17.0
Short-term Trading Call: cautiously bearish
Stock Market Commentary
A Broad-Based Re-Entry
The bull market remains very much alive.
When AT40 (T2108), the percentage of stocks trading above their respective 40-day moving averages (DMAs), drops into the 30s in strong bull markets, buyers tend to show up to put a floor in the stock market. AT40 fell as low as 30.6% in the wake of a poor ISM number on Thursday, and the buyers took over from there.
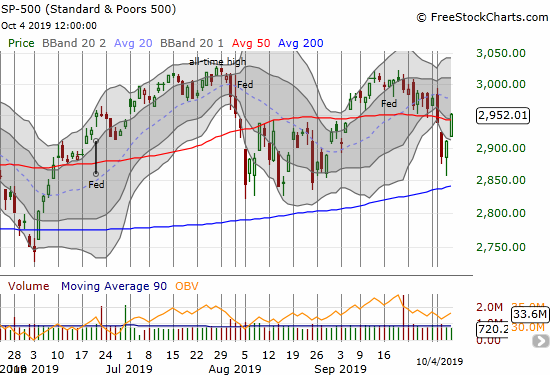
I happened to be in a buying mood because the S&P 500 achieved its average maximum drawdown for October in just the first two days of the month. moreover, the index was trading well below its lower Bollinger Band (BB) which is an over-extended (short-term) position. I started the day unloading several bearish positions before going to the shopping list. The action moved so quickly that later in the day I decided to take profits on positions like call options on S&P 500 (SPY). I figured overhead resistance from the 50DMA would hold so I find myself poorly positioned with the index finishing the week with a marginal 50DMA breakout. Just as quickly as the S&P 500 confirmed my switch to a cautiously bearish stance, the buyers shut the window of opportunity for staying bearish.
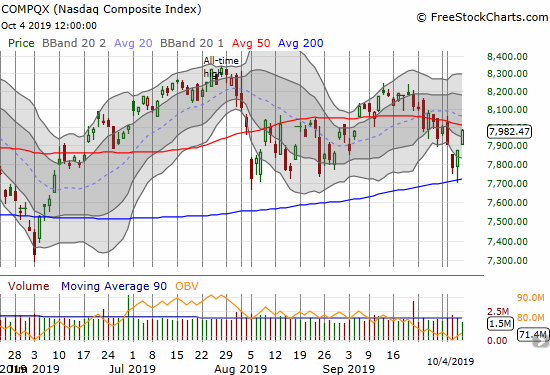
The NASDAQ (COMPQX) added to the bullish swing in sentiment with a successful test of 200DMA support. The tech-laden index closed at its intraday high on Friday.
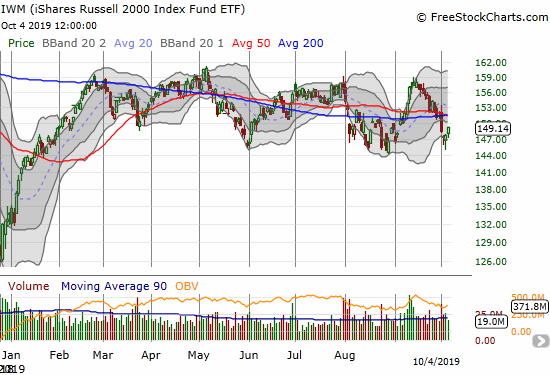
The iShares Russell 2000 Index Fund ETF (IWM) is still a laggard, but its bounce looks like it confirmed support near the lows of the on-going trading range.
Volatility
The volatility index (VIX) failed to make additional progress after finally returning to “elevated” levels on Wednesday. Friday’s sharp drop added to the bullish swing in sentiment.
And Again the Wait
I thought the S&P 500 was banished back to its obvious trading range. The buyers who moved into the breach created by bad economic news created a quick reshift in sentiment. While the fresh upward momentum suggests I should upgrade the short-term trading call from cautiously bearish, I am staying put until I see BOTH the S&P 500 and the NASDAQ confirm 50DMA breakouts. Similarly, I see no reason to jump into fresh bearish positions without some freshly bearish breakdown in the major indices.
Given the market’s presiding optimism about the outcome of the U.S. versus China Trade War, the upcoming news about the latest round of negotiations is sure to deliver more sharp shifts for the market. Earnings season gets underway next week with financial stocks. The Federal Reserve rounds out the drama with its next pronouncement on monetary policy at the end of the month. Through all the drama, I will try to stay focused on the fact that the S&P 500 already achieved its average maximum drawdown for the month.
Stock Chart Reviews – Below the 50DMA
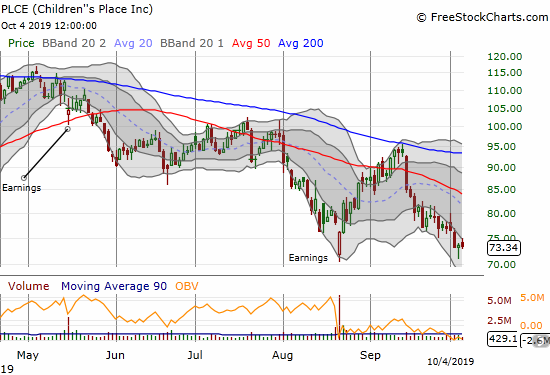
Children’s Place (PLCE)
Children’s Place (PLCE) continues to capture my attention. The stock distinctly failed at 200DMA resistance last month yet I waited for a potential buying point rather than look to go short. I bought call options when PLCE reversed most of its post-earnings recovery, but the selling continues. The stock looks quite bearish now. A close above the lower Bollinger Band (BB) channel would be the start of a positive change.
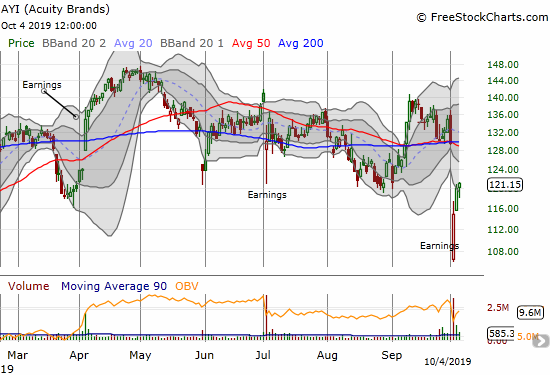
Acuity Brands (AYI)
Acuity Brands (AYI) had the misfortune of delivering bad earnings news in the middle of a bearish spell for the stock market. Yet, buyers stepped right into the breach and perhaps signaled the bottom-fishing to come for the rest of the week. I am long the stock but did not think to add to my holdings in the wake of the post-earnings selling.
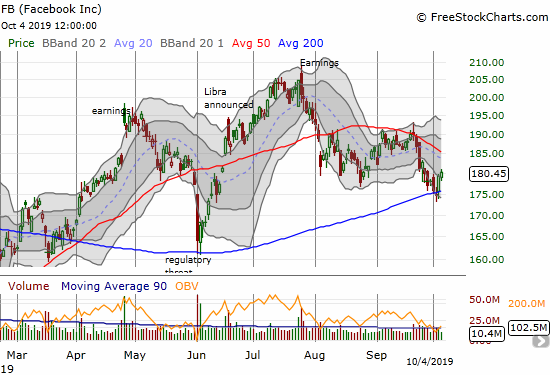
Facebook (FB)
Facebook (FB) to-date has proven extremely resilient to a lot of bad news. Last week, the stock made another statement by confirming 200DMA support. Still, the stock is on the edge of a bearish head and shoulders pattern. I like the setup here for a sustained bullish or bearish move: bullish on a 50DMA breakout and VERY bearish on a 200DMA breakdown. I currently hold a hedged position of calls and puts.
Stock Chart Reviews – Above the 50DMA
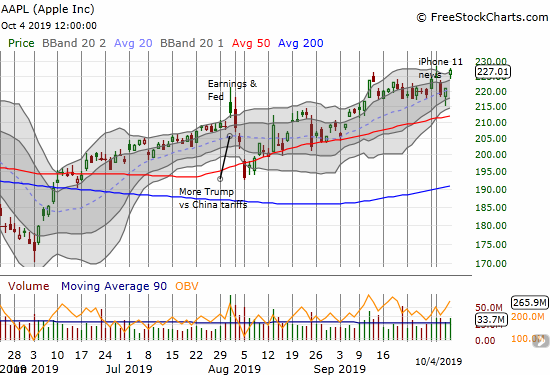
Apple (AAPL)
Apple (AAPL) ended the week on a very strong note. Usually the iPhone rumors are negative. This time, the iPhone news was positive with rumors of increased iPhone 11 production pushing the stock close to a 52-week high. The strength caught me off-guard, but my weekly call buying in AAPL had me prepared to benefit. I took profits well ahead of schedule on my latest tranche. I am looking to get more aggressive on the next dip.
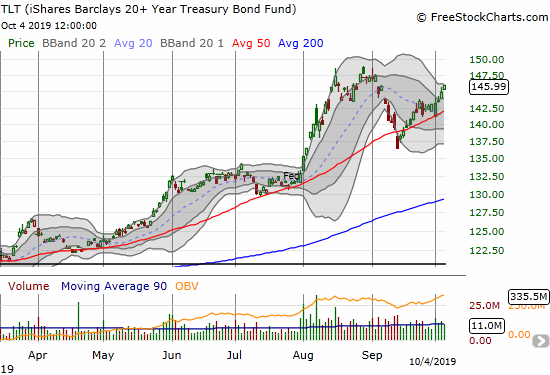
iShares Barclays 20+ Year Treasury Bond Fund (TLT)
The bond market is appropriately concerned with the on-going deterioration in economic data. Accordingly, the iShares Barclays 20+ Year Treasury Bond Fund (TLT) is on the move again. The TLT gained another 0.7% in a defiance of what seemed to be the stock market’s bullish interpretation of the jobs report.
Assuming the U.S. is trending toward the rest of the world on bond yields (more and more getting negative), TLT should have a lot of upside ahead. I took profits too early on my TLT call options. I plan to stay focused on buying the dips rather than looking for points to fade.
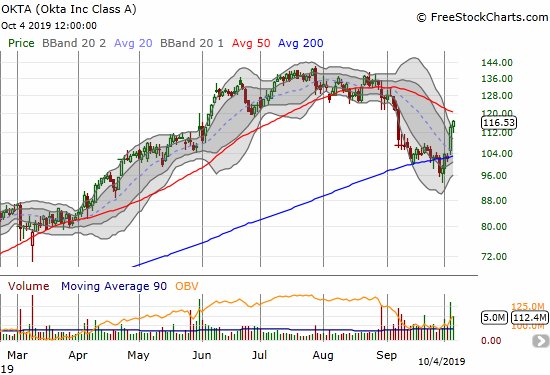
Okta (OKTA)
I bought Okta (OKTA) when it tested 200DMA support in mid-September. Last week’s surge confirmed the choice, but a declining 50DMA looms as stiff resistance. I plan to hold through the test. My stop is below the September low.
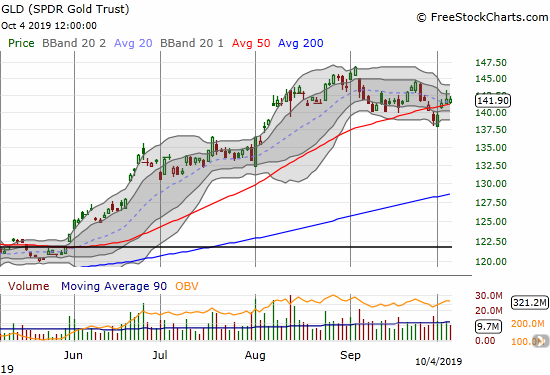
SPDR Gold Trust (GLD)
My decision to stay focused on the upside potential for SPDR Gold Trust (GLD) paid off with Wednesday’s gap up and the subsequent follow-through. I took profits on the call options I accumulated into the previous selling. I still have languishing call options in iShares Silver Trust ETF (SLV), so I have short-term upside exposure if precious metals regain upward momentum. I will get back into GLD call options on the next dip. I of course still hold my core position in GLD shares.
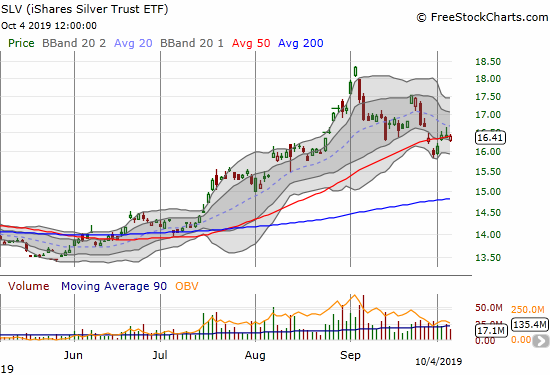
iShares Silver Trust ETF (SLV)
The iShares Silver Trust ETF (SLV) recovered from its 50DMA breakdown. It has yet to show additional signs of upward momentum.
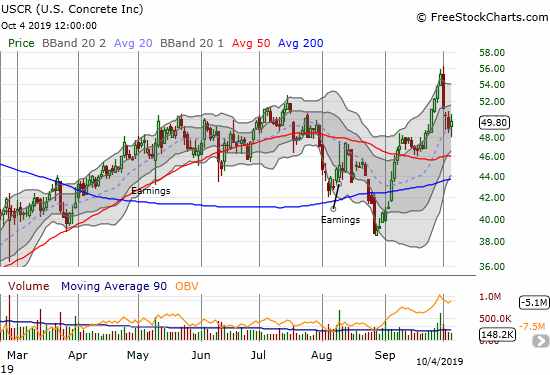
U.S. Concrete (USCR)
U.S. Concrete (USCR) made an incredible comeback in September from August’s 200DMA breakdown. I decided to take profits after the 50DMA breakout. The near parabolic move into the end of the month completely caught me off-guard; I found no news to explain the surge. This month’s pullback looks like a natural cool-down. I bought call October monthly options as a first move back into the stock.
— – —
FOLLOW Dr. Duru’s commentary on financial markets via email, StockTwits, Twitter, and even Instagram!
“Above the 40” uses the percentage of stocks trading above their respective 40-day moving averages (DMAs) to assess the technical health of the stock market and to identify extremes in market sentiment that are likely to reverse. Abbreviated as AT40, Above the 40 is an alternative label for “T2108” which was created by Worden. Learn more about T2108 on my T2108 Resource Page. AT200, or T2107, measures the percentage of stocks trading above their respective 200DMAs.
Active AT40 (T2108) periods: Day #183 over 20%, Day #22 over 30%, Day #2 over 40% (overperiod), Day #3 under 50% (underperiod), Day #4 under 60%, Day #10 under 70%
Daily AT40 (T2108)
")
Black line: AT40 (T2108) (% measured on the right)
Red line: Overbought threshold (70%); Blue line: Oversold threshold (20%)
Weekly AT40 (T2108)

*All charts created using FreeStockCharts unless otherwise stated
The T2108 charts above are my LATEST updates independent of the date of this given AT40 post. For my latest AT40 post click here.
Be careful out there!
Full disclosure: long GLD, long SLV shares and calls, long PLCE call spread, long AYI, long OKTA, long FB puts and calls, long USCR calls
*Charting notes: FreeStockCharts stock prices are not adjusted for dividends. TradingView.com charts for currencies use Tokyo time as the start of the forex trading day. FreeStockCharts currency charts are based on Eastern U.S. time to define the trading day.