
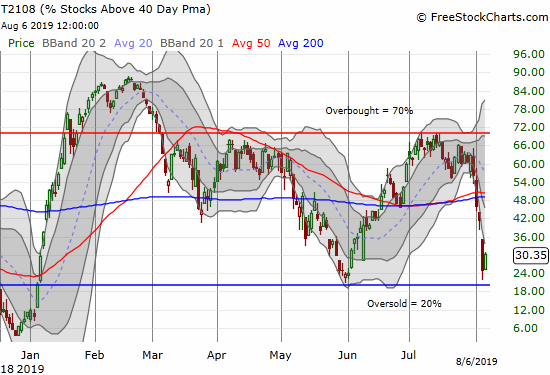
AT40 = 30.4% of stocks are trading above their respective 40-day moving averages (DMAs)
AT200 = 44.9% of stocks are trading above their respective 200DMAs
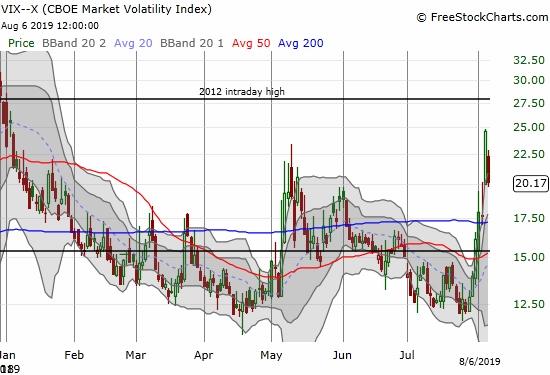
VIX = 20.2 (the day before it closed at 24.6 and a 7-month high)
Short-term Trading Call: neutral (caveats below!)
Stock Market Commentary
Almost Oversold
I underestimated the market’s readiness to panic.
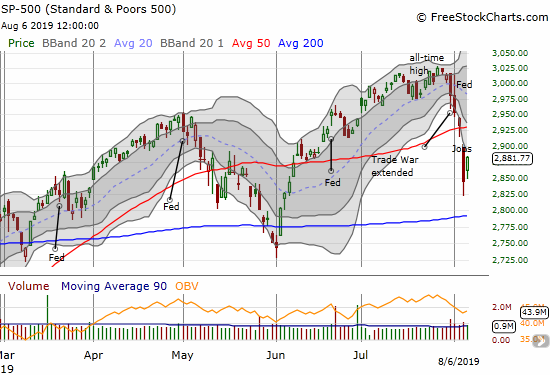
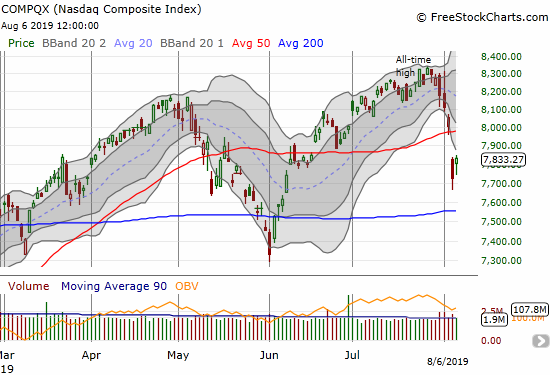
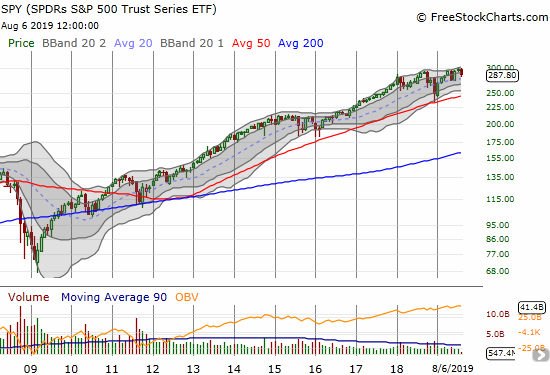
The week started with a major bout of selling in the wake of China allowing its currency to drop as part of an expanding trade war with the U.S. The S&P 500 (SPY) gapped open below its 50-day moving average (DMA) right into bearish territory. The NASDAQ (COMPQX) did the same. The selling was sharp and heavy enough to drive AT40 (T2108), the percentage of stocks trading above their respective 40DMAs, close to the oversold threshold of 20%.
Monday’s conditions were ripe for a rebound off what I would call “quasi” oversold conditions. The next day delivered a sharp rebound.
Volatility Surge and Plunge
The violent bout of selling and buying sent the volatility index (VIX) on a wild ride. On Monday, the VIX soared 39.6% to close at 24.7. A VIX over 20 conventionally represents elevated levels of fear. The next day the VIX plunged back to 20.2 in a major bout of relief.
Signals in the Currency Market
The U.S. Treasury Department slapped China with the label of a currency manipulator shortly after the market closed for trading on Monday. It touched off another bout of sharp selling during a relatively illiquid time of trading. I am guessing the Treasury did not expect such a violent market reaction given the timing of the announcement.
The selling was startling. I believe, for example, the S&P 500 (SPY) sank another 2% or so. I saw Apple (AAPL) trading at least as low as $189. I avidly watched the currency market for signs of a bottom. It came much more quickly than I expected.
The trading action validated once again the importance of watching the Australian dollar (FXA) versus the Japanese yen (FXY) (AUD/JPY) as an approximate measure of the market’s risk appetite, especially at extremes. AUD/JPY continued to rally into the U.S. open and continued to confirm the flip in sentiment to the bullish side of the ledger.
During these times of selling, I look for big gaps lower to flush out sellers and set up a sustained rally, even if it is just a relief rally. A gap down into oversold conditions would have been ideal and would have flipped me bullish. (In Monday’s selling, I did little except sell remaining put options, nibble on AAPL and SPY, and hedge my UVXY call spread…which I wished was just a group of outright calls!). Instead, the gap up on Tuesday set up conditions for late sellers to come and fade the market. At the time of writing, AUD/JPY is waning and suggesting Wednesday will feature a return of sellers who want to use Tuesday’s higher prices as a chance to head for the exits.
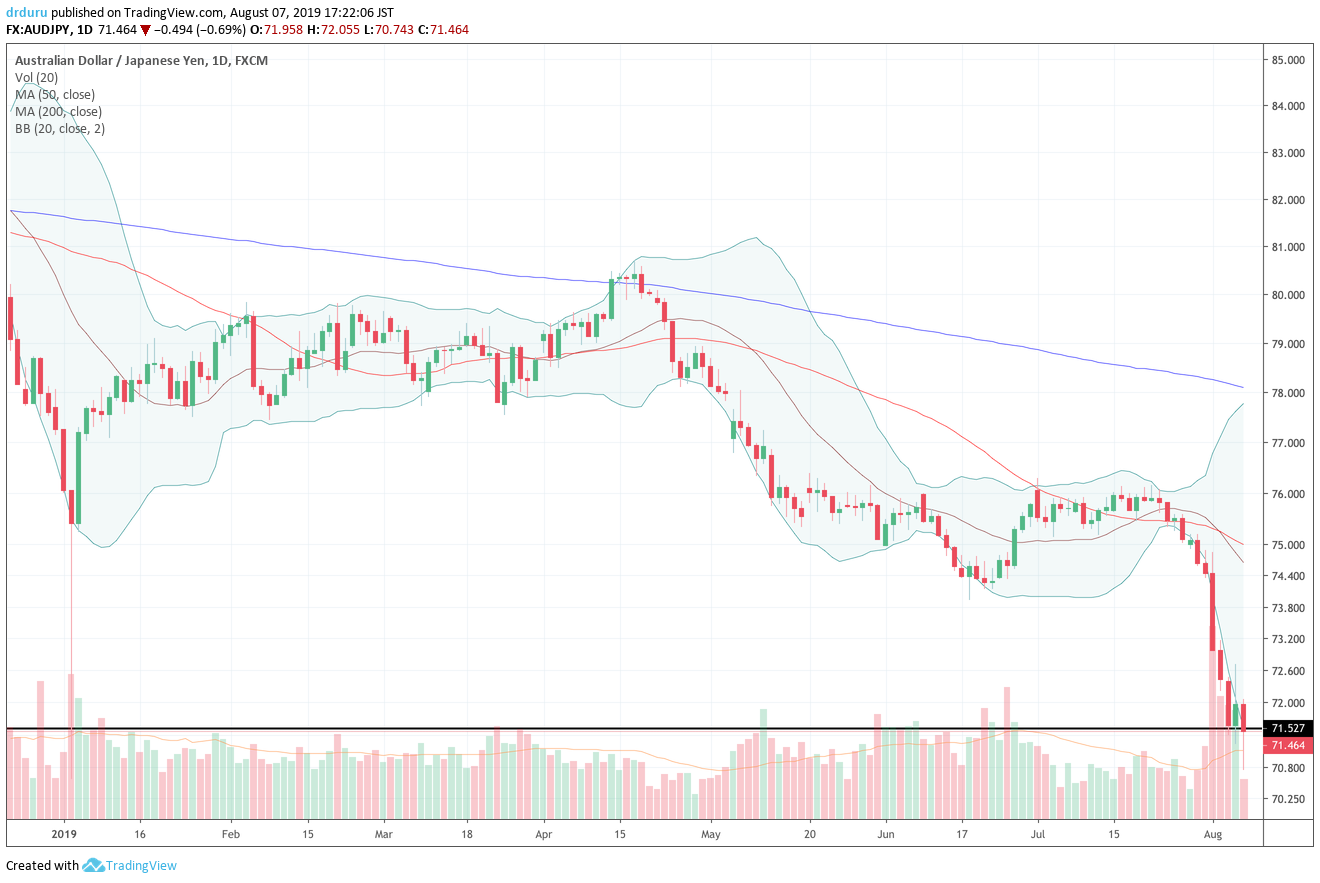
Source: TradingView
AUD/JPY is now struggling with its flash crash low, so it is amazing the S&P 500 is still as high as it is. Recall that the Japanese yen surged briefly in the wake of a massive earnings warning from Apple. It was an ugly start to the year.
Again, August is the most dangerous month of the year, so this ominous start to the month is seasonally consistent. My threshold for flipping the short-term trading call to bullish will be stringent: a spike in volatility into or during oversold conditions (AT40 below 20%).
A Looming Warning?
While the short-term drama unfolds, the longer-term danger looms. The monthly chart below of SPY shows the market’s mighty and volatile struggle going nearly nowhere for the last 18 months.
Stock Chart Reviews – Bearish
Apple (AAPL)
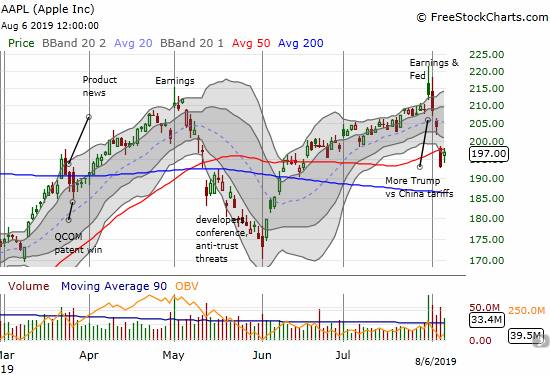
I underestimated the danger to Apple (AAPL) and now wish my hedge 200/190 put spread did not carry last week’s expiration date! AAPL gapped below 50DMA support on Monday and rallied back to that trend line on Tuesday. The chart is technically bearish, but I am sticking to a rose-colored tint in the lens I use to view the stock. Because I am in a more aggressive mode to buy options in AAPL, I used Monday’s selling to reset bullish call positions. Still, I bought a put option expiring next week for good measure.
Caterpillar (CAT)
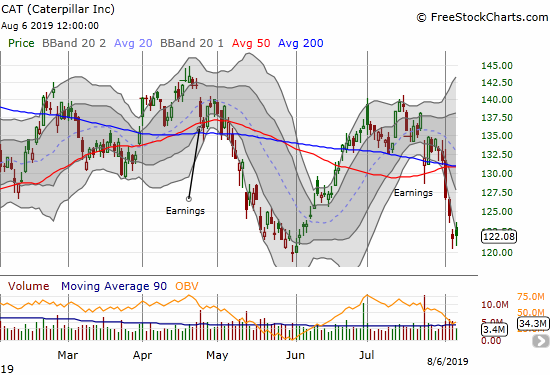
Caterpillar (CAT) gapped down on Monday but ended the day with a kind of hammer bottoming pattern. In a sign of weakness, CAT under-performed the market on Tuesday by fading off its intraday high and closing with a mere 0.4% gain. I should have held a fresh batch of CAT puts going into this week. I will be a little more aggressive in buying CAT puts as a hedge. Given the extreme in volatility, I will target put spreads rather than buying puts outright.
Stock Chart Reviews – Bullish
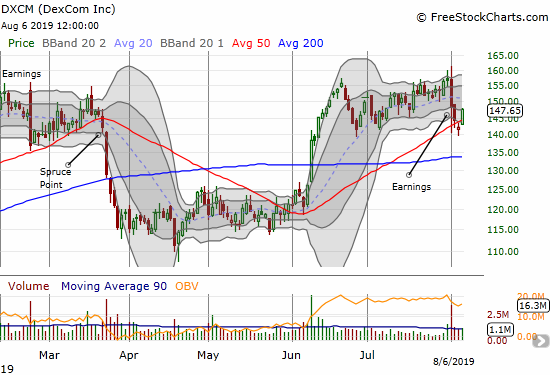
DexCom (DXCM)
DexCom (DXCM) caught my attention after an extended rally in June. The stock had the marker of a brewing major event. My trade in calls were a bust as the stock’s upward momentum ended and transformed into a lot of chop into earnings. The stock pulled back into and through 50DMA support in the wake of earnings. With Tuesday’s rebound, I am looking to try a fresh bullish position.
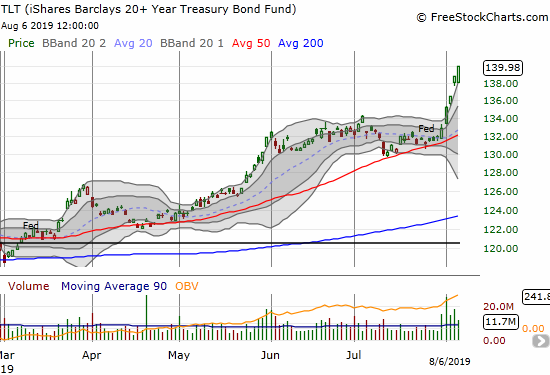
iShares Barclays 20+ Year Treasury Bond Fund (TLT)
The iShares Barclays 20+ Year Treasury Bond Fund (TLT) continues to soar. Enough said!
— – —
FOLLOW Dr. Duru’s commentary on financial markets via email, StockTwits, Twitter, and even Instagram!
“Above the 40” uses the percentage of stocks trading above their respective 40-day moving averages (DMAs) to assess the technical health of the stock market and to identify extremes in market sentiment that are likely to reverse. Abbreviated as AT40, Above the 40 is an alternative label for “T2108” which was created by Worden. Learn more about T2108 on my T2108 Resource Page. AT200, or T2107, measures the percentage of stocks trading above their respective 200DMAs.
Active AT40 (T2108) periods: Day #146 over 20%, Day #1 over 30% (overperiod, ending 1 day under 30%), Day #2 under 40% (underperiod), Day #4 under 50%, Day #13 under 60%, Day #103 under 70%
Daily AT40 (T2108)
")
Black line: AT40 (T2108) (% measured on the right)
Red line: Overbought threshold (70%); Blue line: Oversold threshold (20%)
Weekly AT40 (T2108)

*All charts created using FreeStockCharts unless otherwise stated
The T2108 charts above are my LATEST updates independent of the date of this given AT40 post. For my latest AT40 post click here.
Be careful out there!
Full disclosure: long long TLT puts, long , long UVXY put, long UVXY call spread, long SPY call, long AAPL calls and puts
*Charting notes: FreeStockCharts stock prices are not adjusted for dividends. TradingView.com charts for currencies use Tokyo time as the start of the forex trading day. FreeStockCharts currency charts are based on Eastern U.S. time to define the trading day.
One writer-consortium that I follow had an interesting perspective on China’s yuan devaluation: he believes they had felt the need to do it for years, and Trump’s latest salvo gave them cover to do it.
I believe it. They are in a tough place. It’s expensive to prop up your currency. It’s expensive to let it fall. They are likely going to try a controlled devaluation.