
AT40 = 88.1% of stocks are trading above their respective 40-day moving averages (DMAs) (17th overbought day)
AT200 = 45.9% of stocks are trading above their respective 200DMAs (4-month high that effectively reverses the October, 2018 breakdown)
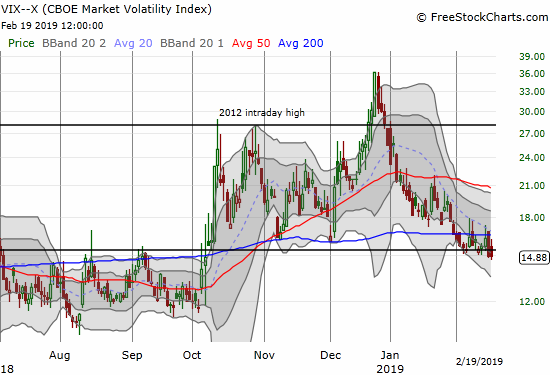
VIX = 14.9
Short-term Trading Call: neutral
Stock Market Commentary
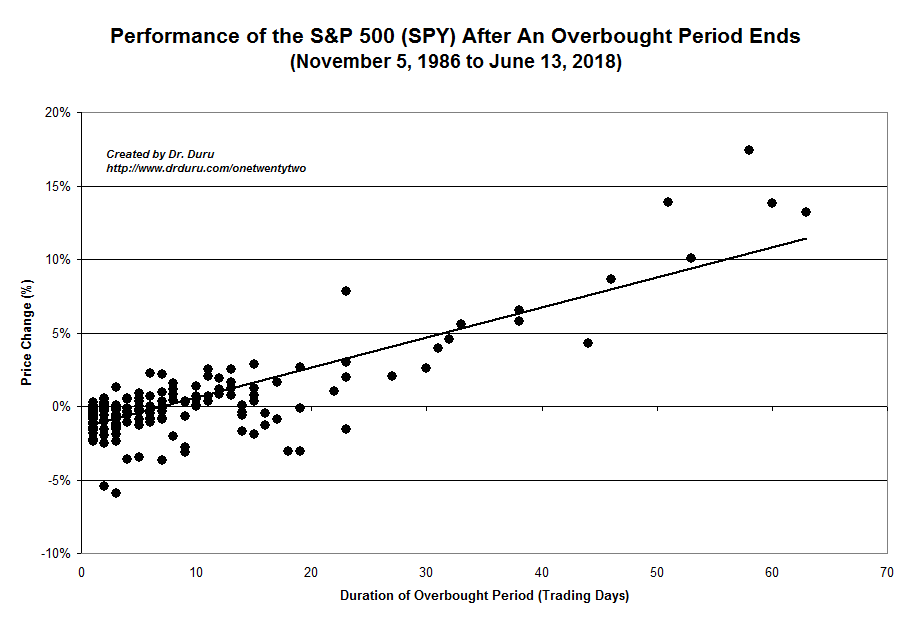
AT40 (T2108), the percentage of stocks trading above their respective 40DMAs, is on day #17 of an extended overbought period. AT40 is even holding its own well above 80% for 6 straight days. The average 80% overperiod is only 5 days long with a median around 3 days. The average 70% overperiod, an overbought period, lasts around 8 days with a median around 4 days. The S&P 500 has gained 4.3% so far during this oversold period. If the overbought period ended today, the S&P 500 would be well ahead of historical performance. However, AT40 is also just 3-5 trading days away from a key “lift-off” point where the S&P 500 gets a “second wind” of performance.
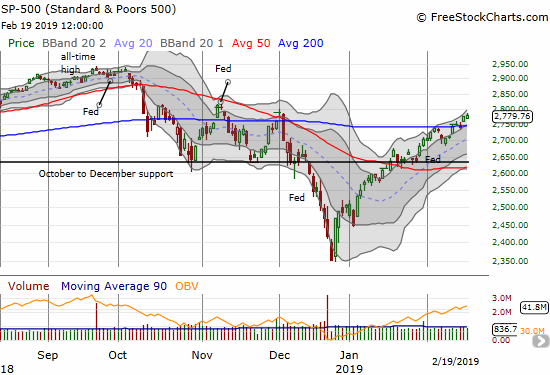
The 200-day moving average (DMA) still features prominently in this overbought period. AT200 (T2107), the percentage of stocks trading above their respective 200DMAs, is at a new 4-month high and is within a few days of fully reversing its loss from the October sell-off. Meanwhile, the major indices are lingering around their respective 200DMAs as a “convenient resistance” to the trading action gives way in what feels and looks like slow motion. The sluggish, slow motion melt-up understates the significance of the 200DMA breakouts. The S&P 500 confirmed its 200DMA breakout last Friday or today depending on your perspective..
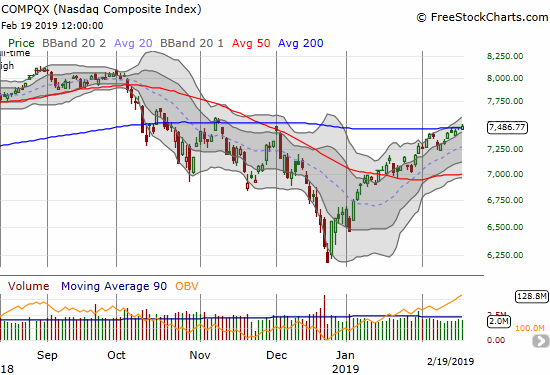
The NASDAQ went from the slightest of taps on 200DMA resistance to the most tentative 200DMA breakout. A move higher from here faces little resistance until around 8000 which represents a complete reversal of the sell-off that started in early October.
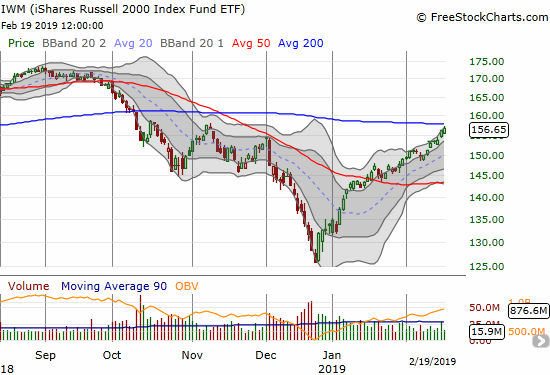
The iShares Russell 2000 ETF (IWM) is making its own bid for a 200DMA breakout. IWM has traded along its upper-Bollinger Band four out of the last five trading days.
The VIX is still idling away awaiting a decisive move. The 15.35 pivot is working its magic although the VIX now looks ready to fall back to the extreme lows that dominated ahead of the October sell-off.
My short-term trading call remains stuck in neutral even as there are few compelling shorts in the market. The tone of the market is very bullish, but caution is warranted given the extreme overbought nature of the market in the face of financial risks from slowing U.S. corporate profit growth and a slowing global economy.
Stock Chart Reviews
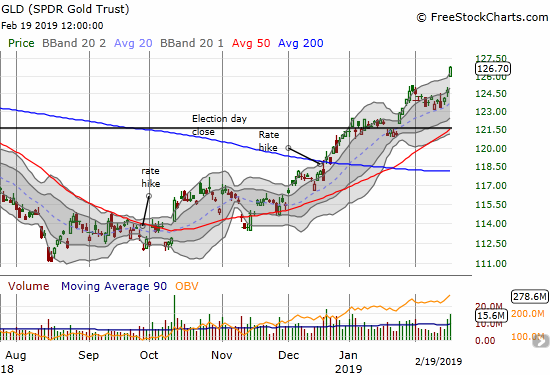
SPDR Gold Trust (GLD)
It took almost three weeks for GLD to break out to this 10-month high. My call options expire in mid-March, so I am holding to see whether follow-through buying happens. I will stop out and take profits if GLD drops below today’s intraday low (and open) of $126.
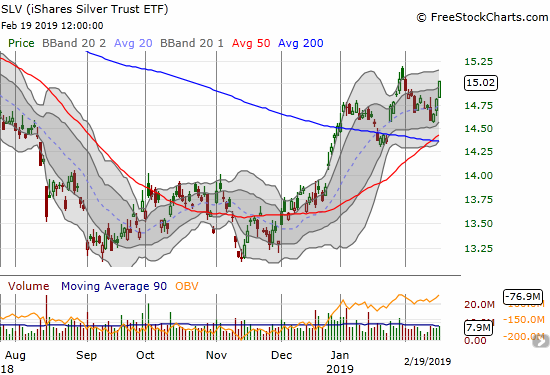
iShares Silver Trust (SLV)
SLV is trailing behind GLD, but its latest wake-up call started last week. I will be holding mt calls awaiting a breakout and continued run-up. Commodities are picking up steam as global central banks are in near full retreat.
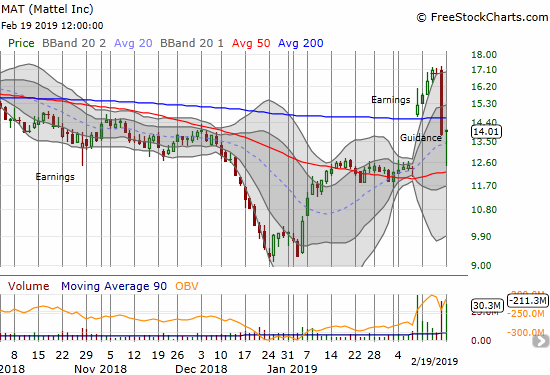
Mattel (MAT)
MAT just delivered one of the stranger performances a company and a stock can give. Optimism was riding high on the heels of a strong earnings report. MAT broke out above its 200DMA, followed through, and I pegged it for a buy on the dips. A dip came, but it was not buyable. Mattel issued guidance that marked a sharp reversal of the good news delivered just one week prior. The stock promptly lost 18.3%. The trading today added to the strangeness. The stock lost as much as 9.9% before rebounding for 1.4% gain on the day. MAT is now a tough stock to trade; I might consider taking a swing on a close above the 200DMA since such a move would mark another confirmation of 50DMA support. The $17 level should provide stiff resistance as I imagine there a lot of buyers who got caught flat-footed in the face of Mattel’s about face.
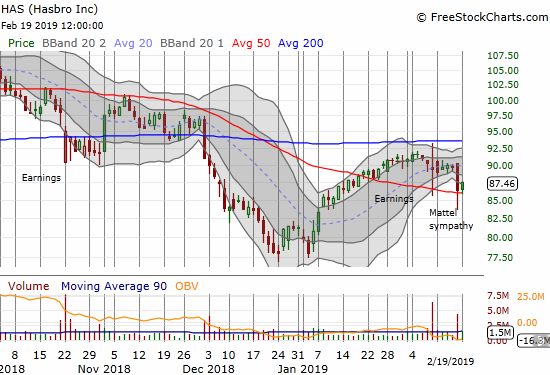
Hasbro (HAS)
HAS dropped in sympathy with MAT. The stock is precariously clinging to 50DMA support. Under the circumstances, this toy company is definitely not a buy until a confirmed 200DMA breakout.
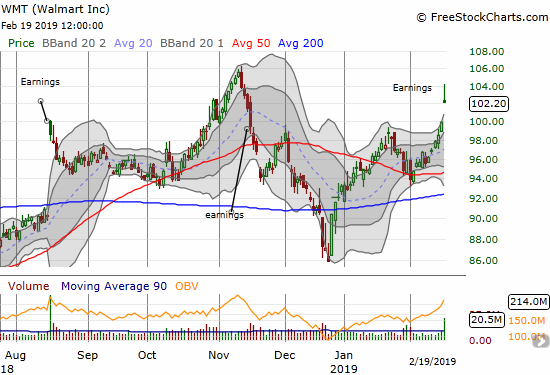
Walmart (WMT)
WMT ominously stopped short of challenging its high from November, 2018 which represented the stock stopping short of challenging the all-time high set in January of 2018. The post-earnings move delivered an impressive gap up, but the stock may have hit a blow-off top kind of move with the sharp fade from intraday highs well above its upper-Bollinger Band (BB).
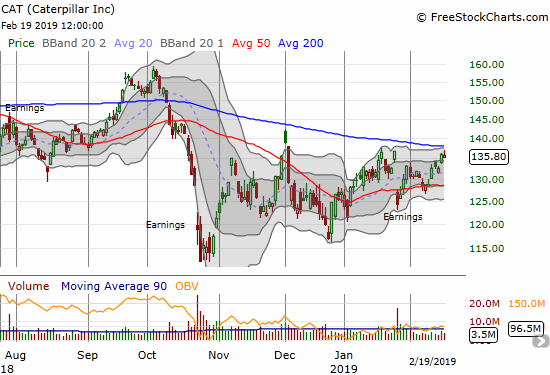
Caterpillar (CAT)
My last tranche of put options on CAT expired last week harmless. Undeterred, I reloaded on another tranche with a mid-March expiration. CAT is an obvious hedge against the rising optimism over a China-U.S. trade deal. If the market gets disappointed with the outcome in under two weeks, CAT could easily trade right back to its post-earnings low with a quickness. It is even possible CAT reverses anyway on a sell-the-news reaction. Moreover, 200DMA resistance looms directly ahead…granted if CAT confirms a 200DMA breakout, the stock has a LOT of upside from there.
— – —
FOLLOW Dr. Duru’s commentary on financial markets via email, StockTwits, Twitter, and even Instagram!
“Above the 40” uses the percentage of stocks trading above their respective 40-day moving averages (DMAs) to assess the technical health of the stock market and to identify extremes in market sentiment that are likely to reverse. Abbreviated as AT40, Above the 40 is an alternative label for “T2108” which was created by Worden. Learn more about T2108 on my T2108 Resource Page. AT200, or T2107, measures the percentage of stocks trading above their respective 200DMAs.
Active AT40 (T2108) periods: Day #31 over 20%, Day #29 over 30%, Day #28 over 40%, Day #27 over 50%, Day #23 over 60%, Day #17 over 70%, Day #6 over 80%
Daily AT40 (T2108)
")
Black line: AT40 (T2108) (% measured on the right)
Red line: Overbought threshold (70%); Blue line: Oversold threshold (20%)
Weekly AT40 (T2108)

*All charts created using freestockcharts.com unless otherwise stated
The T2108 charts above are my LATEST updates independent of the date of this given AT40 post. For my latest AT40 post click here.
Related links:
The AT40 (T2108) Resource Page
You can follow real-time T2108 commentary on twitter using the #T2108 or #AT40 hashtags. T2108-related trades and other trades are occasionally posted on twitter using the #120trade hashtag.
Be careful out there!
Full disclosure: long UVXY calls, long GLD shares and calls, long SLV shares and calls, long CAT puts
*Charting notes: FreeStockCharts.com stock prices are not adjusted for dividends. TradingView.com charts for currencies use Tokyo time as the start of the forex trading day. FreeStockCharts.com currency charts are based on Eastern U.S. time to define the trading day.