
Housing Market Intro/Summary
The housing data were late and incomplete at the time of original publishing due to the previous U.S. government shutdown. The last update came with the new home sales data published on March 5, 2019. I look forward to everything getting back in sync!
The lagging data have not discouraged investors from buying back into housing-related stocks. The iShares US Home Construction ETF (ITB) is up 23.4% from its December low and closed the week essentially even with its 4 1/2 month high. A full reversal of the September breakdown is even in sight if ITB can manage a 200DMA breakout.
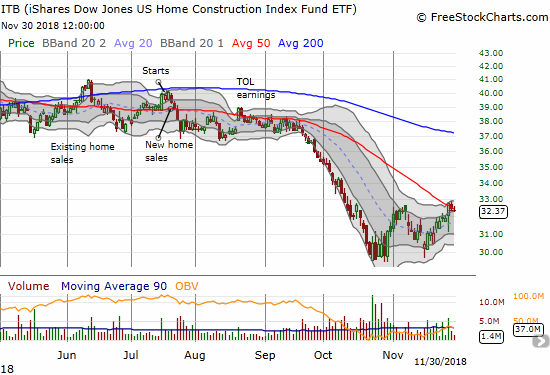
In the September Housing Market Review, ITB was precariously holding onto its trading range. October ushered in a complete collapse that was very plunge-worthy. ITB gained 3.8% in November in a small sign of stabilization that looked like a successful test of the October low. The declining 50-day moving average (DMA) held as resistance and led to a resumption of the sell-off in December. ITB at one point hit a new 23-month low on Christmas Eve.
The sentiment shift is notable given the data and earnings reports from home builders have yet to turn the corner. Redfin (RDFN) provided a view of a market that bottomed but is still softer year-over-year. Investors are clearly relying on a top in mortgage rates, and a Federal Reserve that stood down from its program of tightening monetary policy. The Fed will find itself in a bind again soon if housing prices reaccelerate. Given prices were marching higher even with slowing sales activity, prices can certainly reignite once demand becomes more robust.
Stock Charts
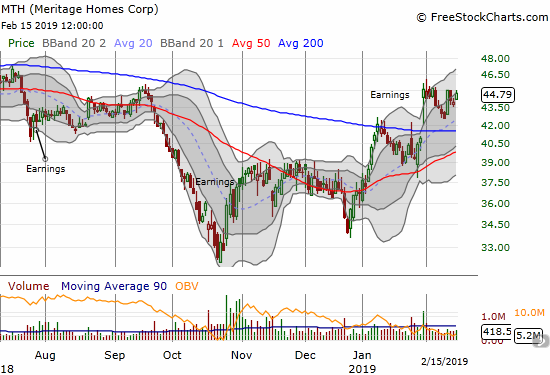
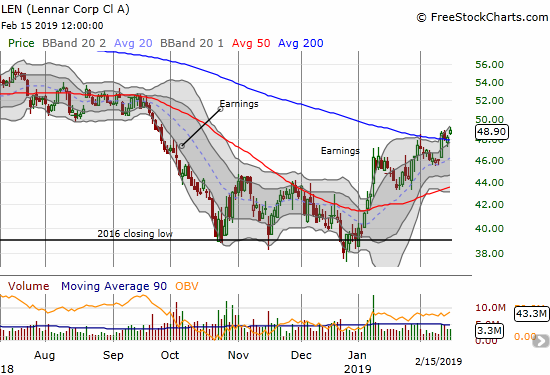
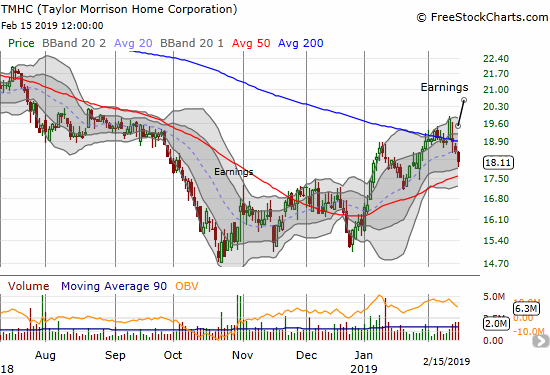
I reduced my trade on the seasonal strength of home builders to call options on ITB. However, with the technicals improving on the group, individual stocks look interesting again. Here are a series of charts of top interest to me with Century Communities (CCS) remaining as a long-term holding, Lennar (LEN) up for consideration as a buy, and Taylor Morrison Home Corporation (TMHC) up for earnings review.


Source for charts: FreeStockCharts.com
Federal Reserve
The deteriorating conditions in the housing market caught the notice of the Federal Reserve per the minutes from the November meeting. However, surprisingly, the Fed had nothing to say about housing in its December statement on monetary policy. During the press conference, only ONE person asked about housing. In the January decision on monetary policy and the accompanying press conference, references to the housing market were conspicuously, completely absent. U.S. housing was perhaps under the surface of Federal Reserve Chair Jerome Powell’s explanation of what changed in the six weeks between the December meeting when Powell insisted that rates would have to go higher and the January meeting when Powell and the Fed decided to capitulate on the idea. From the transcript (emphasis mine):
BINYAMIN APPELBAUM… I am struggling a little bit to understand what has changed since we sat here with you six weeks ago…Can you speak specifically to why you’ve moved from a posture of saying we expect to keep raising rates this year to a posture of standing still?
CHAIRMAN POWELL. I’d point to a couple of things. First, the narrative of slowing global growth continues, if you will. The incoming data have shown more of that. We’ve seen that both in China and in Western Europe, and so that’s an important — that has important implications for us and that story has — let’s just say it continues.
And in addition — I mean, I think important — possibly less important now, probably less important now but has been the shutdown, which will leave some sort of imprint on first quarter GDP. We don’t know the ultimate resolution of it. If that’s all there is and the shutdown is gone and there isn’t another shutdown, then we’ll get most of that back in the second period — second quarter.
…Financial conditions began to tighten in the fourth quarter and they now have persisted and remain tighter — significantly tighter, let’s say — than they were and that’s something that we have to take into account as well…
Once again the minutes from the Fed meetings were more informative on housing than the discussion of the subsequent monetary policy decision. The minutes from the December meeting reveal awareness of the troubles in the housing market and fingering high mortgage rates as the source (emphasis mine).
Real residential investment appeared to be declining further in the fourth quarter, likely reflecting in part the effects of the rise in mortgage interest rates over the past year on the affordability of housing. Starts of new single-family homes decreased in October and November, although starts of multifamily units rose sharply in November. Building permit issuance for new single-family homes, which tends to be a good indicator of the underlying trend in construction of such homes, moved down modestly over recent months. Sales of new homes declined markedly in October, although existing home sales increased modestly…
Although household spending overall was seen as strong, several participants noted continued weakness in residential investment. This weakness was attributed to a variety of factors, including increased mortgage rates and rising home prices.
It seems the Fed is still being careful not to spook the markets about the health of the housing market, but the minutes demonstrate they are paying attention. Minutes from the January meeting are due for release tomorrow (February 19, 2019).
New Residential Construction (Single-Family Housing Starts) – December, 2018
{The update for December was published February 26, 2019}
While housing starts surged in May and left no doubt that home builders were confident as ever, the subsequent plunge in housing starts in June appeared to temper that enthusiastic interpretation. From July to October, housing starts seemed to stabilize. However, the plunges in November and December confirmed that housing starts have topped out for the foreseeable future.
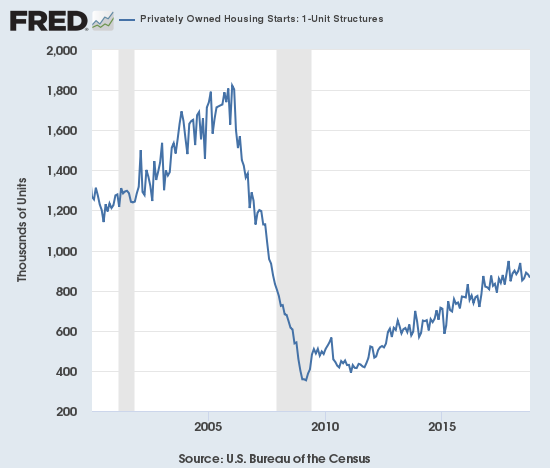
Single-family housing starts for November were revised downward from 824,000 to 812,000. December starts decreased month-over-month by 6.7% to 758,000. On an annual basis, single-family housing starts plunged by 10.5%. This decrease is the fifth in the last seven months. The depth of this decline confirmed the rapid drop in home builder sentiment during the time and is the worst since starts were regularly dropping double-digit percentages in 2011. This sharp decline is also a natural conclusion to the deceleration in housing starts I noted through much of 2018.
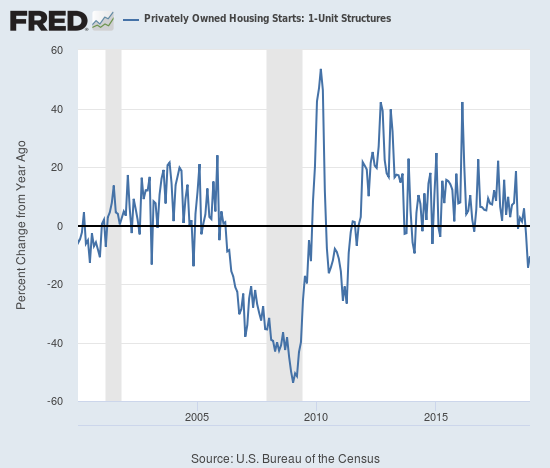
Source: US. Bureau of the Census, Privately Owned Housing Starts: 1-Unit Structures [HOUST1F], retrieved from FRED, Federal Reserve Bank of St. Louis, February 28, 2019.
June’s year-over-year decline was the first for housing starts since August, 2016, and June’s level sat as the lowest of the year until November’s plunge. In the November Housing Market Review I ascertained that the recent annual declines were relatively significant. I concluded that a fundamental change had arrived. I am no longer correct about a slow motion breakdown; the breakdown is now break neck in speed.
Source: US. Bureau of the Census, Privately Owned Housing Starts: 1-Unit Structures [HOUST1F], retrieved from FRED, Federal Reserve Bank of St. Louis, February 28, 2019.
Over the 8 months prior to May, regional year-over-year changes in starts exhibited wide dispersion. For May, housing starts were very strong across the board. The dispersion returned in July. In November, three of the four regions experienced sharp declines led by the West. For December, the West and Midwest were the two declining regions both with exceptionally large changes. The Northeast, Midwest, South, and West each changed 4.1%, -21.8%, 2.9%, and -33.3% respectively.
The bump up in July housing starts was less impressive than it appeared given it was mainly driven by the Midwest. For August, only a second month of gains for the West prevented housing starts from looking worse. In September, the regions delivered solid performances outside of the Northeast. The West out-performed for two months with double-digit year-over-year gains and helped prevent the overall starts numbers from looking worse. The West has effectively come to a screeching halt.
From the November Housing Market Review: “Assuming a housing slowdown is in full swing, the West could suffer significant drops in home builder sentiment in coming months as these strong starts turn into over-supply and/or lower prices.” It looks like builders got the message and sharply pulled back on their plans.
Existing Home Sales – December, 2018
Existing home sales ended a 5-month losing streak with a small month-over-month increase for October sales. However, sales continued the losing streak for year-over-year changes with an eighth annual decline in a row. That streak reached ten in December. For August sales, the National Association of Realtors (NAR) chose to celebrate headlines about a stabilization of sales and the end of the decline, but I countered with my skepticism. For September sales, the NAR seemed to finally acknowledge a sinking reality. The NAR perked back up in reporting the October sales numbers with mixed messaging that failed to highlight the fundamental realities of a slowing market. Similarly, for November sales, the NAR strained to find positive messaging even as increasing inventory continued to fail to stem the (year-over-year) declines in sales. For December sales, the NAR flat out threw up the white flag in noting that sensitivity to higher interest rates and poor affordability have slowed the market for existing homes.
The seasonally adjusted annualized sales in December of 4.99M were down 6.9% month-over-month from the slightly upwardly revised 5.33M in sales for November. Year-over-year sales decreased 10.3%, surpassing the 7.0% year-over-year decline in November which was then the largest annual decline since 2011 (the NAR did not provide an updated yardstick and no longer provides historical data).

Source for chart: National Association of Realtors, Existing Home Sales© [EXHOSLUSM495S], retrieved from FRED, Federal Reserve Bank of St. Louis, February 9, 2019.
The NAR’s routine explanation for changes in existing sales has usually blamed sales declines on a shortage of inventory and celebrated sales increases in spite of inventory shortages. In the November report the NAR strained to paint a story of increasing demand. The NAR used the monthly gain in sales to celebrate: “After six consecutive months of decline, buyers are finally stepping back into the housing market…” As I countered in the last Housing Market Review, the substantial year-over-year declines mean that the more meaningful trend remains downward.
The NAR continues to point to rising inventories as a positive sign. In the November report, the NAR noted that “increasing housing inventory has brought more buyers to the market.” For December, the NAR declared: “Several consecutive months of rising inventory is a positive development for consumers and could lead to slower home price appreciation…But there is still a lack of adequate inventory on the lower-priced points and too many in upper-priced points.” The price dynamics do not confirm this reported dichotomy.
Absolute inventory levels increased from 1.46M a year prior to 1.55M in December. For the third month in a row inventory fell month-over-month. On a basis of months of supply, inventory followed the trend in the absolute numbers: “Unsold inventory is at a 3.7-month supply at the current sales pace, down from 3.9 last month and up from 3.2 months a year ago.”
In November, the NAR observed that “as more inventory enters the market and we head into the winter season, home price growth has begun to slow more meaningfully…This allows for much more manageable, less frenzied buying conditions.” This description was a good positive spin on slowing price growth although prices are not slowing as much as I would expect in . slowing market. While the median price of an existing home returned to monthly declines with a 1.6% drop, annual prices continued their ascent with a 2.9% year-over-year increase – the 82nd straight annual increase.
The share of sales going to first-time buyers continues to just bounce around. For December, the share sat at 32%, a decrease from 33% in November, but an increase from 31% in October. The share was flat with December, 2017. This share was 32% in September, 31% in August, 32% in July, 31% in May and June, 33% in April, 30% in March, and 29% in February. September, 2017 was the first time in the previous two years where the share dropped below 30% and has not dropped below since. The average share for first-time homebuyers for 2016 was 35%. The NAR’s 2017 Profile of Home Buyers and Sellers reported an average of 34% for 2017 and 33% for 2018. These yearly drops by one percentage point are not remarkable.
Investors purchased 13% of homes in December, the same as November and down from October’s 15% and 16% a year ago December. Investor sales averaged a share of 15% in 2017 and 14% in 2016.
For the third month in a row, existing home sales decreased across all four regions year-over-year. In particular, the West suffered a sixth consecutive substantial drop. Here are the regional numbers with November, October and September’s year-over-year changes in parentheses respectively listed for comparison: Northeast -6.8% (-2.6%, -6.8%, -5.6%), Midwest -10.5% (-4.3%, -3.1, -1.5%), South -8.7% (-5.6%, -2.3%, -0.5%), West -15.0% (-15.4%, -11.2%, -12.2%). As usual, regional sale fluctuations had little to no relationship to the on-going price run-ups. The year-over-year price changes for December were surprisingly high given the steep sales declines even with two regions stalling out (November, October, September in parentheses): Northeast 8.2% (6.5%, 3.0%, 4.1%), Midwest 0.0% (2.6%, 2.4%, 1.9%), South 2.5% (3.2%, 3.8%, 3.0%), West 0.2% (1.8%, 1.9%, 4.1%).
Single-family sales dropped 5.5% from November and decreased on a yearly basis by 10.1%. The median price of $255,200 was up 2.9% year-over-year.
California Existing Home Sales – December, 2018
Starting with this Housing Market Review, I have added this section given the size of California’s market and the highly visible declines the state is suffering. I will expand this section over time. For now, I provide a few key quotes:
California home sales declined for the eighth straight month in December, and a stagnating market for much of the year pushed sales lower in 2018 for the first time in four years…
Statewide active listings rose for the ninth straight month, increasing 30.6 percent from the previous year.
The statewide Unsold Inventory Index was 3.5 months in December, down from 3.7 months in November.
For the year as a whole, sales were down 5.2 percent from 2017.
I am quite surprised to see inventory drop even as sales activity declines and active listings soar!
New Residential Sales (Single-Family) – December, 2018
{The update for December was published March 5, 2019}
In a surprisingly stark contrast to existing home sales, new home sales from May to August increased in each month on a year-over-year basis. September finally unleashed a “pent-up” decline in new home sales that may be easing. November, 2017 still looks like a substantial and sustained peak in new home sales, but the latest data offer the prospect of some stabilization.
The Census Bureau revised November sales of new single-family homes downward from 657,000 to 599,000. New home sales for December increased 3.7% month-over-month and declined 2.4% year-over-year to 621,000. These small changes come on the heels of much larger changes in November. Year-over-year gains regularly hit double digits starting in 2012; November 2017’s 26.6% jump was the highest since February, 2015 when new home sales soared 29.8% year-over-year. The year 2018 never delivered a single month of double-digit year-over-year gains.
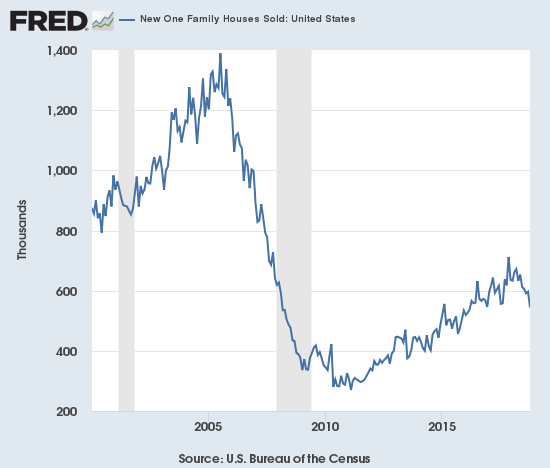
Source: US. Bureau of the Census, New One Family Houses Sold: United States [HSN1F], retrieved from FRED, Federal Reserve Bank of St. Louis, March 7, 2019.
In June, the inventory of new homes for sale jumped to 6.0 months of sales, a perfect balance. Inventory has continued to increase from there. September’s inventory surged to 7.2. October’s inventory increased further to 8.1. November inventory plunged back to 6.0 given the surge in sales. December inventory bounced back to 6.6. In September’s Housing Market Review I wondered whether new homes might move too far to an over-supply condition; sure enough that over-supply has lasted for 3 of the last 4 months. The balance at 6.0 may become a new pivot. An over-supply of new homes detracts from the frequent optimism expressed by the NAR over higher supplies of existing homes. The swell in inventory is likely contributing to the decline in housing starts.
May’s median price of $316,700 was a year-over-year decline. June delivered a second straight decline. July’s prices bounced back: the median price increased 1.6%. August’s median price of $321,400 was also a year-over-year increase of 2.3%. With sales plunging in September, prices remained essentially flat with a 0.4% decline. For October, the median increased by 1.8%. For November, the median sales price hit its lowest level of the year at $302,400, a 11.9% year-over-year plunge. Prices were last that low February, 2017. December’s median price rebounded to $318,600, still a 7.2% year-over-year drop. The sequential bounce looks like a function of a reversal of the recent shift from the high-end to the middle and low-end of the overall market. The regional data further suggest that the year-over-year drop in the median price was driven by yet another plunge in sales in the expensive West.
The Northeast jumped double-digits for a second straight month. Sales in the region increased 16.7% year-over-year. The Midwest dropped 3.2%. The South gained 7.4%. The West plunged an eye-popping 23.9% which follows a 25.9% drubbing in November.
Home Builder Confidence: The Housing Market Index – January, 2019
The Housing Market Index (HMI) ended 2018 at an average 66.4, just slightly below 2017’s average of 67.8. The HMI fell off a cliff in the last two months of 2018 after finally giving in to the weight of declining components. The components first peaked in November, 2017 with the traffic of prospective buyers. For January, the HMI perked back up two points to 58. Each of the components increased as well. In a rare display of divergence, the consumer confidence index plunged in January (it recovered slightly for February).
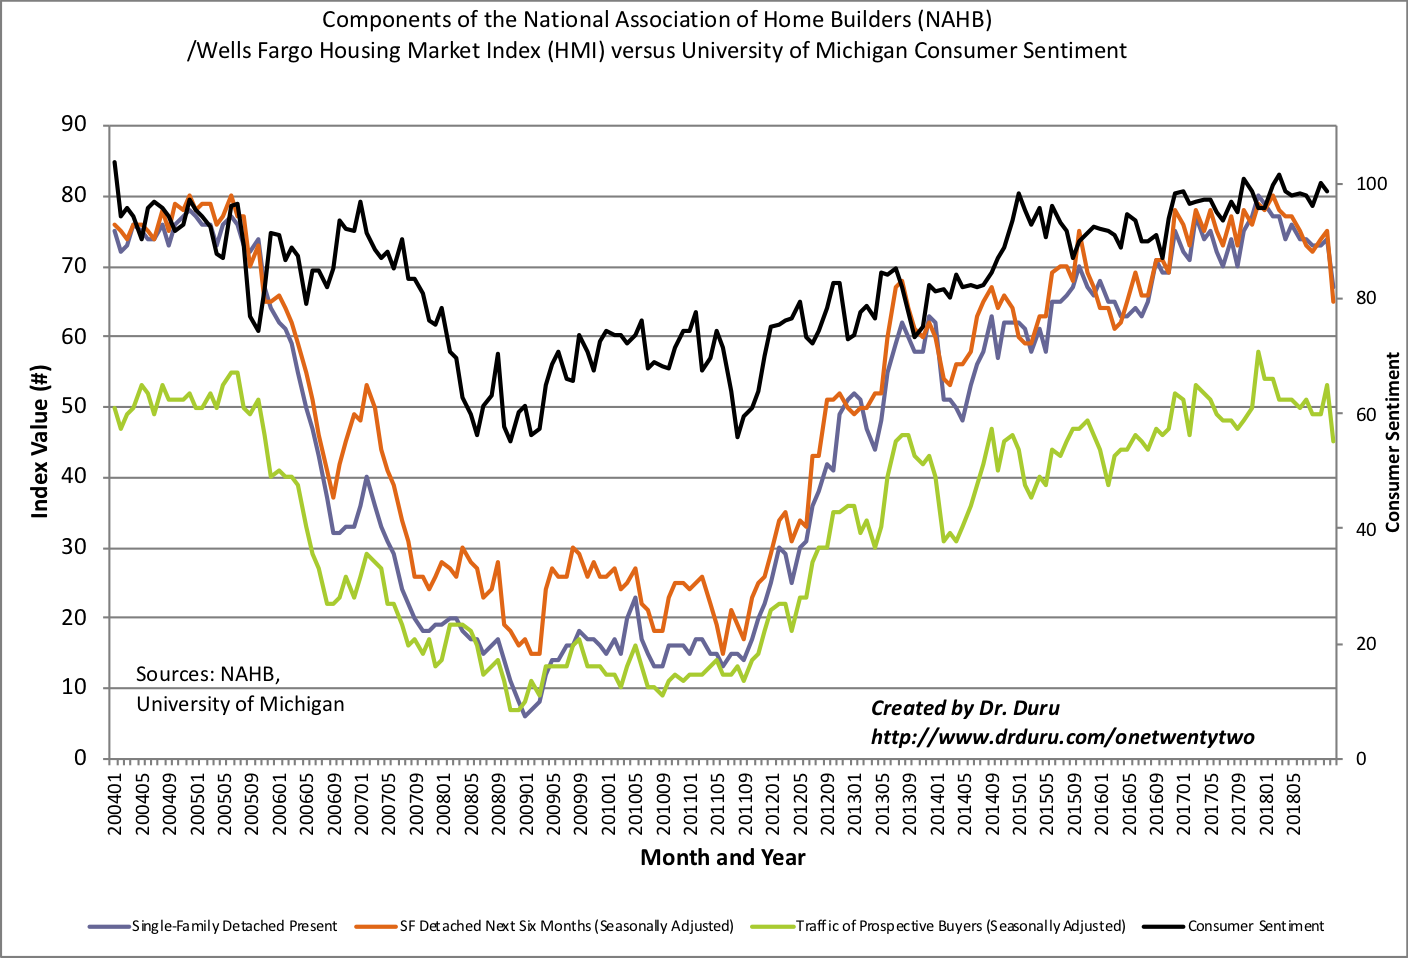
Source: NAHB
The NAHB took encouragement from declining mortgage rates and attributed improved builder confidence to this decline. This claim was yet one more proof point that rate increases DO indeed matter even from current low levels.
Although the HMI increased the regional story was mixed. After all four regions ended 2018 at multi-year lows, just two regions gained in January. This mix means that it is too early to extrapolate the HMI increase to an imminent improvement in housing data. The Northeast jumped from a revised 36, which was its lowest level since May, 2016, to 48. The Midwest dropped from a 3 1/2 year low to a 4 1/2 year low. At 49, the Midwest joined the Northeast in negative territory (below 50). The “polar vortex” no doubt had an impact, so hopefully the Midwest rebounds in February. The South stayed flat. The West jumped from its worst reading since September, 2015 to 70, which is still the second worst reading since September, 2015.
In the September Housing Market Review, I concluded that HMI had to begin a recovery in October for me to look forward more optimistically to the seasonally strong period for home builder stocks (November through March/April). Unfortunately, I concluded that “…home builder sentiment still looks like a breakdown in slow motion.” The brakes failed in November. Even with the overall uptick in January, the breakdown remains in full effect. Accordingly, I think the HMI is at great risk of resuming its fall in coming months.
Parting thoughts
Zestimate Obsession
With housing adding to the forces steadily boxing in the Fed, I am surprised the Fed is not speaking more directly about it. Home builder stocks and decelerating housing data gave us the early signals this year that “something” was wrong. The Fed will be remiss in continuing to underplay these warning signals in its outward-facing statements. A story from Marketplace provided another window on just how important the housing market can be for owners; this story focused on people obsessed with checking the value of their homes on Zillow (Z) using “Zestimates.”
Aging in place is an important market force
Over the past several years I have directed a lot of skepticism towards the notion of an imminent “Senior Sell-Off” where aging Baby Boomers desperately abandon homes they can no longer maintain or accommodate. My last piece in this series was in August, 2017 titled “The Future of Housing: The Senior Sell-Off Still Gives Way to Aging In Place.” Earlier this month, Freddie Mac released a report titled “While Seniors Age in Place Millennials Wait Longer and May Pay More for their First Homes” that further reinforced the notion that the exact opposite of a Senior Sell-Off is coming. Instead, “Aging in Place” is all the rage. Seniors sticking by their homes are helping to reduce inventory and drive prices higher for Millennials looking to buy.
Much attention has focused on the fact that millennials are buying fewer homes than young people did in previous eras. This Insight examines the flip side of this trend: Who is living in those homes that millennials might otherwise have bought? We find that seniors born after 1931 are staying in their homes longer, and aging in place. The result is higher homeownership rates for this group relative to previous cohorts. We estimate that this trend accounts for about 1.6 million houses held back from the market through 2018, representing about one year’s typical supply of new construction, or more than half of the current shortfall of 2.5 million housing units estimated in December’s Insight. This additional demand for homeownership from seniors will increase the relative price of owning versus renting, making renting more attractive to younger generations.
Nightly Business Report (NBR) summarized the Freddie Mac study. The video below, starting at the 18:20 mark, also provides a brief summary.
Be careful out there!
Full disclosure: long ITB calls, long Z, long RDFN, long CCS,