
AT40 = 47.0% of stocks are trading above their respective 40-day moving averages (DMAs)
AT200 = 53.0% of stocks are trading above their respective 200DMAs
VIX = 14.6
Short-term Trading Call: neutral
Commentary
I typically consider the market stretched to the downside when AT40 (T2108), the percentage of stocks trading above their respective 40-day moving averages (DMAs), drops below 20%. However, the current market is characterized by stubborn buyers stepping in at picture-perfect support levels no matter the headlines and sellers generally lacking staying power or enthusiasm. So with AT40 closing at a new (marginal) 3-month low and dropping down as far as the June intraday lows that marked rebounds, I decided to make a bullish interpretation of the trading action.
The volatility index, the VIX, soared on the day. It gained as much as 26.7% before fading hard to close with a 10.0% gain. The volatility faders were as effective as ever as the VIX failed to stay above the 15.35 pivot.
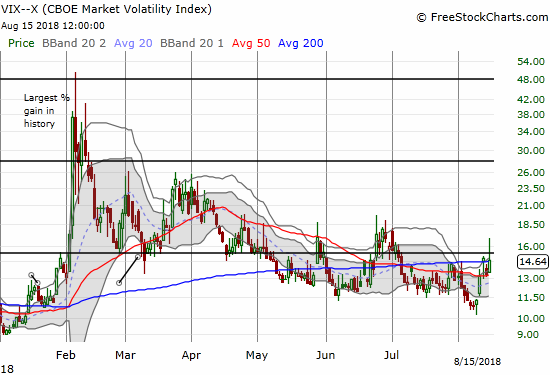
While I was able to profit from last week’s small volatility spike, I failed to profit from this much larger one. After taking quick profits on my last tranche of call options on the ProShares Ultra VIX Short-Term Futures (UVXY), I stuck to my strategy of setting limit buy orders for the next tranche of calls, but they never triggered…including today’s attempt. My disappointment transitioned into realization given I never chase a surge in the VIX: I flipped the script of the last many weeks and, for the first time in a long time, bought put options on UVXY. So far, so good on this play for the near inevitable return to market complacency.
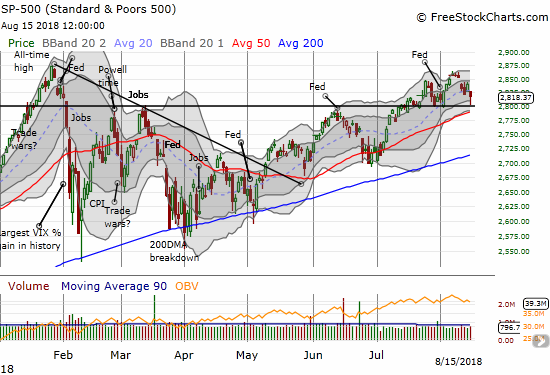
Part of my realization came from noticing the S&P 500 (SPY) lingering just above the 2800 level. In my last Above the 40 post, I claimed that the index’s 2800 support was in play given the latest bearish taint to the market. I reacted by first taking profits on my SPY put option. After sellers pushed the S&P 500 even closer to support, I decided to buy the UVXY put options. The S&P 500 closed the day with a 0.8% loss.
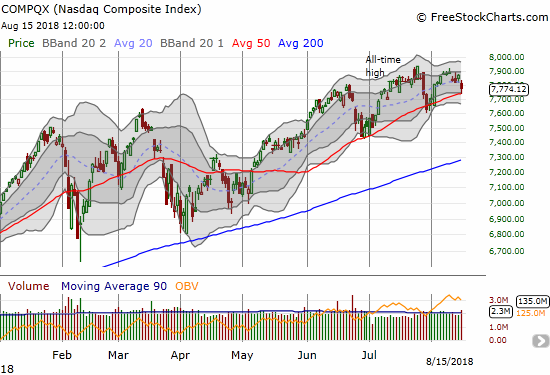
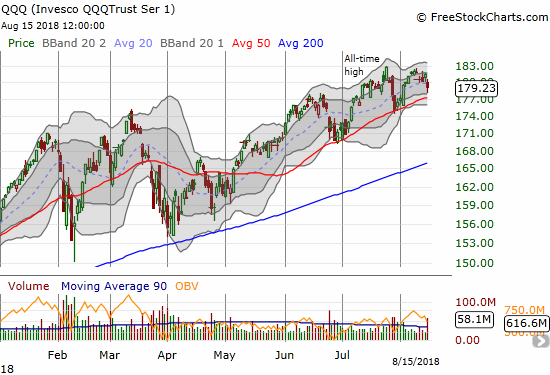
The NASDAQ also completed a picture-perfect bounce from support that I last week claimed was in play. The tech-laden index’s 50DMA held as buyers arrived on schedule. Buoyed by AAPL, the Invesco QQQ Trust (QQQ) never made it to 50DMA support. The ETF bounced just above 50DMA support; buyers decided to arrive at the top of the lower-Bollinger Band (BB) channel.
While macro-economic and political headlines roil markets enough to push the VIX skyward, the U.S. stock indices are barely showing signs of stress. AT40 is anticipating the underlying market weakness, but the resulting action is hardly noteworthy. Outside the U.S. is almost a different world. Currency markets are convulsing with the obvious marks of “risk-off” moves. The strength in the U.S. dollar is helping to pummel everything from emerging markets to commodities to precious metals.
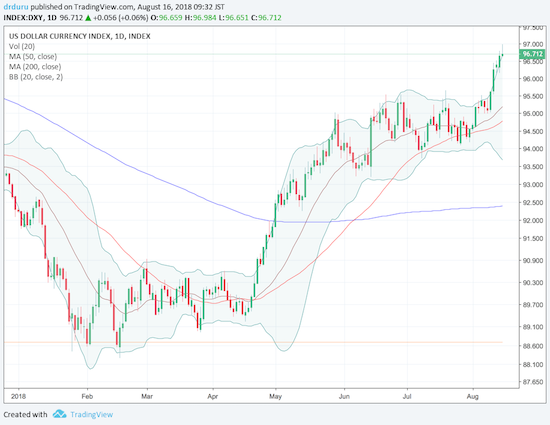
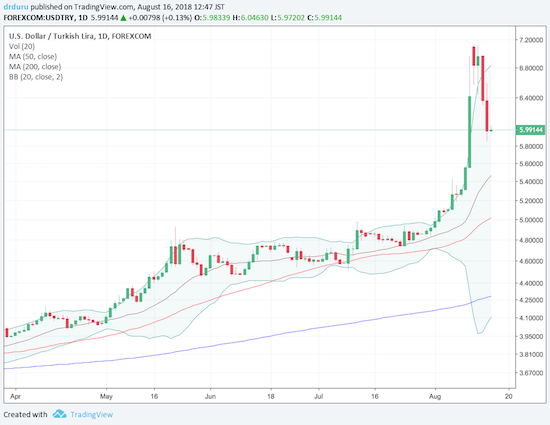
Source: TradingView.com
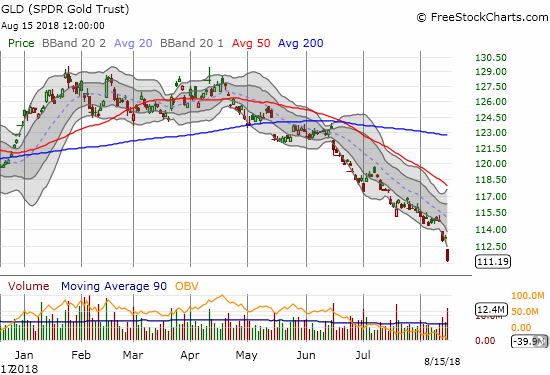
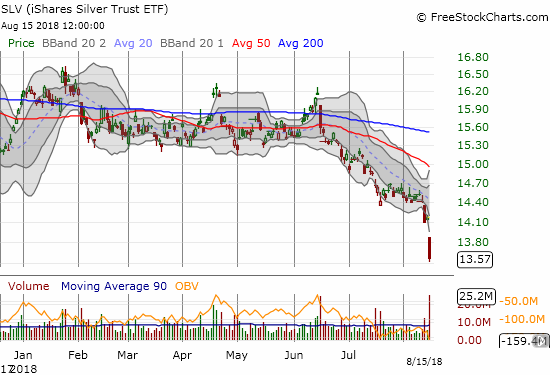
GLD and SLV are firmly on my daily radar. GLD’s breakdown to new 2018 lows almost two weeks ago triggered a purchase of put options. I almost took profits on Monday’s steep breakdown but decided to wait for follow-through selling. With little happening on Tuesday, I decided to take profits. Wednesday delivered the big follow-through selling that I expected. With the selling getting so far over-extended, I took the opportunity to speculate on more SLV call options. Whenever the selling in precious metals finally ends, the bounceback should be swift and sharp. For some intriguing and quantified theories on what in the world is going on with precious metals see “The Mystery of Gold and the Chinese Yuan (Part II)” by Richard Baker doing guest commentary at KITCO.
Who knows when, or even if, the troubles outside the U.S. will produce broad damage in the U.S. stock market. Until key support levels breakdown, I am giving the on-going resilience of buyers the benefit of the doubt. If recent patterns hold, the U.S. stock market is due to bounce right back.
CHART REVIEWS
Boeing (BA)
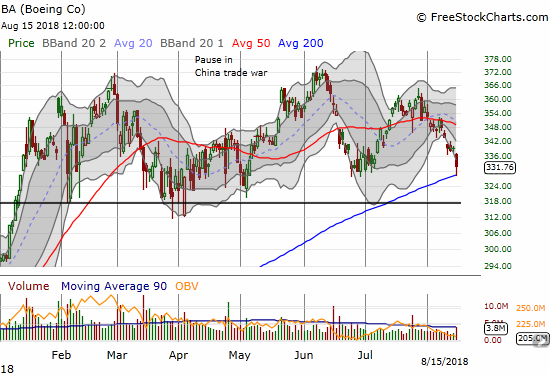
I should have had put options in BA going into this week. Instead, I watched BA gap down today and retest 200DMA support. Keeping with my theme of bullish interpretations, I jumped on a call option to play a potentially successful test of support. BA last closed below its 200DMA almost TWO years ago.
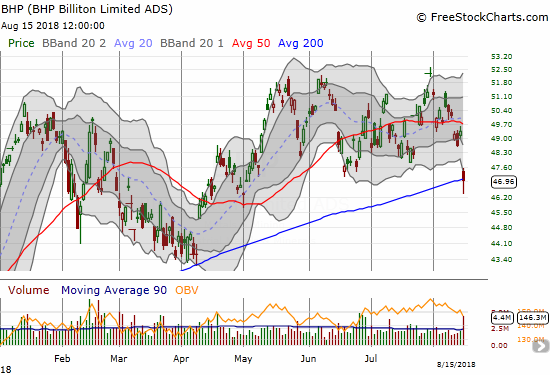
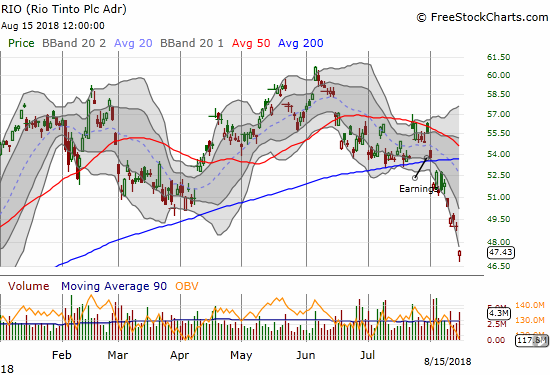
BHP Billiton (BHP) and Rio Tinto (RIO)
My favorite commodities duo had a very rough day. BHP finally gapped down again, and I took profits on my unintentionally under-sized put options. I added to my RIO call options. As I noted earlier, RIO has under-performed BHP so much that it is too bad I did not flip the order of my pairs trade weeks ago. Now, RIO trades at an 8-month low and looks over-stretched below its lower-BB with a bottoming hammer pattern for good measure. Needless to say, I am poised to fade the next bounce in BHP, but I will patiently wait for a test of key resistance. Note that RIO’s woes deepened even as iron ore on balance rallied sharply over the last three weeks. The current pullback is very mild.
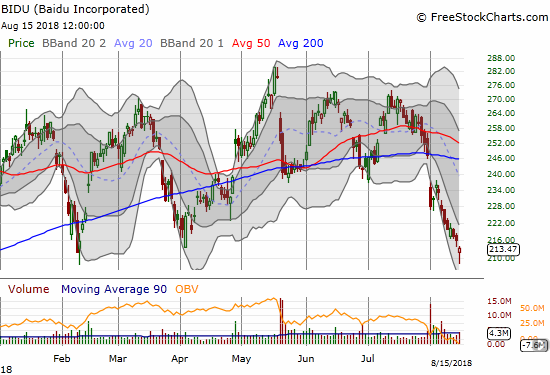
Baidu (BIDU)
My last attempt to play a bounce in BIDU worked for all of two days, and I was too slow to lock down those small profits. I am now up for round two. Sellers have dumped BIDU nearly non-stop for a month. Today, the stock barely closed above its 2018 low. The rush of buyers that saved the day also created a bullish bottoming hammer. I will look to get in with calls and shares on follow-through buying (stop-loss at a new 2018 closing low).
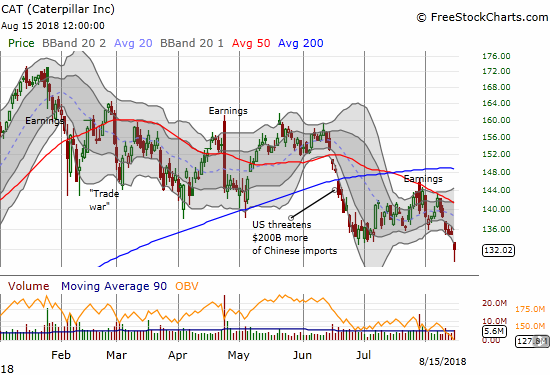
Caterpillar (CAT)
The breakdown in CAT continues. CAT cannot help but reveal the growing stress in the global economy – no more global synchronized growth for now. Unlike previous sell-offs, I was not positioned bearishly enough in CAT going into this breakdown.
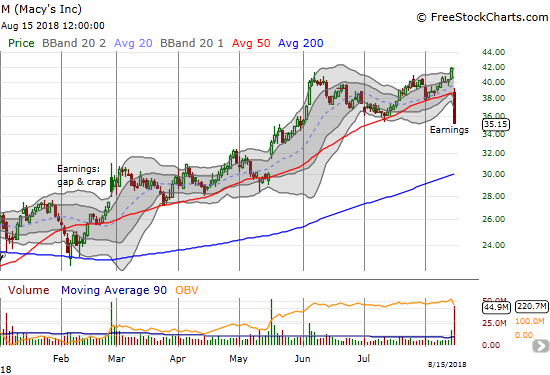
Macy’s (M)
Just when retailers seemed to provide a refuge and reassurance of the strength in the U.S. domestic economy, Macy’s reports earnings and investors greet a hike in 2018 earnings guidance with a 16.0% drubbing. Only the closing bell stopped the sellers from dumping as much Macy’s as possible. The selling looks well overdone, but I am not going to rush in. When I make a trade, I will only be playing for a rebound to 50DMA resistance.
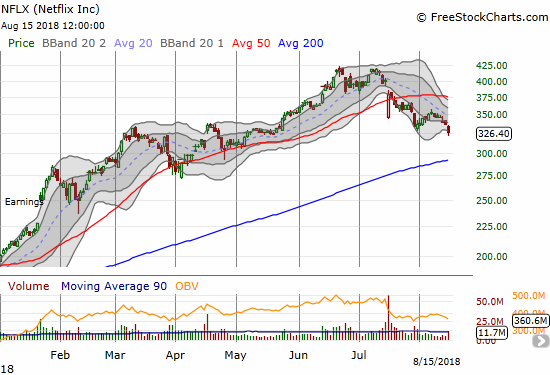
Netflix (NFLX)
The topping pattern continues to build for NFLX. Today’s 3.3% drop further confirmed the top. I now think a 200DMA test is well within the likely range of near-term possibilities.
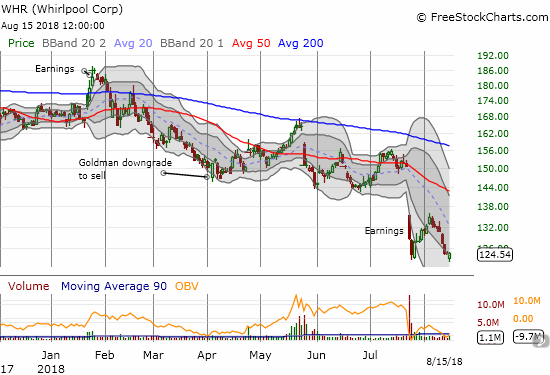
Whirlpool (WHR)
WHR is another short I missed by inches. The last pullback was a picture-perfect test of the post-earnings intraday high. Like CAT, WHR reveals the stresses of the global economy. WHR is even more burdened than CAT with the growing woes in the U.S housing market. I think the market mistakenly ignores and whistles right by this and related weakness…
— – —
FOLLOW Dr. Duru’s commentary on financial markets via email, StockTwits, Twitter, and even Instagram!
“Above the 40” uses the percentage of stocks trading above their respective 40-day moving averages (DMAs) to assess the technical health of the stock market and to identify extremes in market sentiment that are likely to reverse. Abbreviated as AT40, Above the 40 is an alternative label for “T2108” which was created by Worden. Learn more about T2108 on my T2108 Resource Page. AT200, or T2107, measures the percentage of stocks trading above their respective 200DMAs.
Active AT40 (T2108) periods: Day #123 over 20%, Day #92 over 30%, Day #87 over 40%, Day #1 under 50% (1st day of the underperiod ending 6 days over 50%), Day #26 under 60%, Day #43 under 70%
Daily AT40 (T2108)
")
Black line: AT40 (T2108) (% measured on the right)
Red line: Overbought threshold (70%); Blue line: Oversold threshold (20%)
Weekly AT40 (T2108)

*All charts created using freestockcharts.com unless otherwise stated
The charts above are my LATEST updates independent of the date of this given AT40 post. For my latest AT40 post click here.
Related links:
The AT40 (T2108) Resource Page
You can follow real-time T2108 commentary on twitter using the #T2108 or #AT40 hashtags. T2108-related trades and other trades are occasionally posted on twitter using the #120trade hashtag.
Be careful out there!
Full disclosure: long GLD, long SLV shares and calls, long BA call, long CAT shares and puts in various configurations, long RIO calls, long UVXY puts
*Charting notes: FreeStockCharts.com stock prices are not adjusted for dividends. TradingView.com charts for currencies use Tokyo time as the start of the forex trading day. FreeStockCharts.com currency charts are based on Eastern U.S. time to define the trading day.