
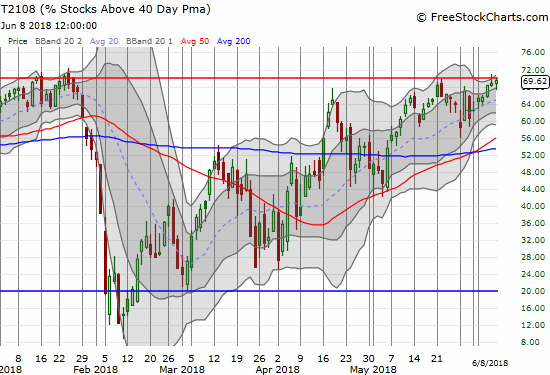
AT40 = 69.6% of stocks are trading above their respective 40-day moving averages (DMAs)
AT200 = 57.1% of stocks are trading above their respective 200DMAs (a 4-month high)
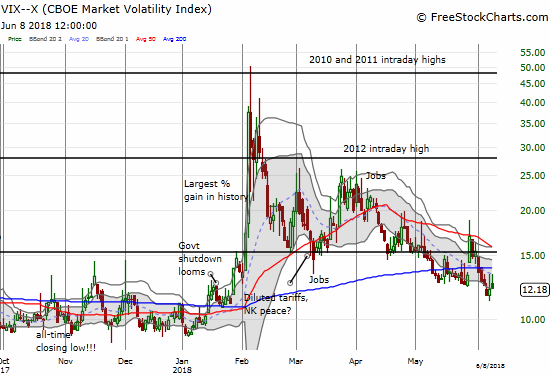
VIX = 12.2
Short-term Trading Call: neutral (“almost bullish”)
Commentary
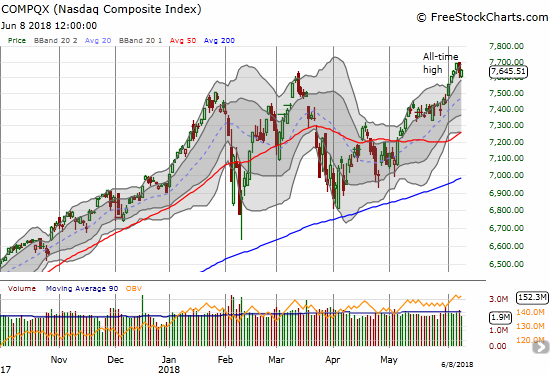
Friday started out in bearish fashion. Apple (AAPL) took a broadside from yet another one of those alarming supplier reports (this time Nikkei). The gap down and quick 1.5% loss seemed to dampen the mood across big cap techs. (I of course seized upon the pullback as a golden entry for my weekly Apple call-buying trade). Following the previous day’s slam against semiconductor stocks from a broad downgrade from Cowen, tech looked down for the count to close the week.
On Thursday, the volatility index, the VIX, managed its first gain after four straight down days. The follow-through on Friday seemed to confirm that buyers were finally exhausted. AT40 (T2108), the percentage of stocks trading above their respective 40DMAs, piled into the alarm bandwagon. On Thursday AT40 traded above the overbought 70% threshold only to close below it. On Friday, it seemed to follow-through on this bearish rejection of overbought conditions.
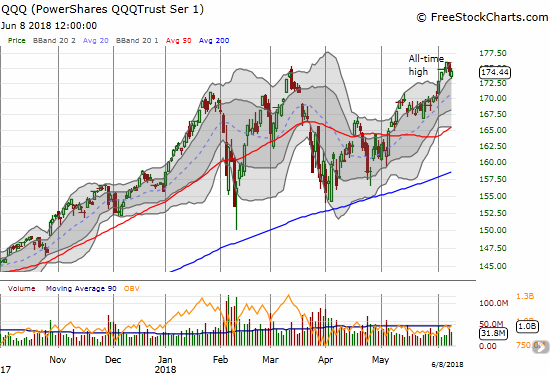
After about 90 minutes of trading on Friday, buyers gained their resolution. After the dust settled, the VIX managed to hold onto a gain, but the NASDAQ and the PowerShares QQQ ETF (QQQ) rallied to close even on the day. The S&P 500 (SPY) did even better by rallying to a 0.3% gain and a fresh 3-month high.
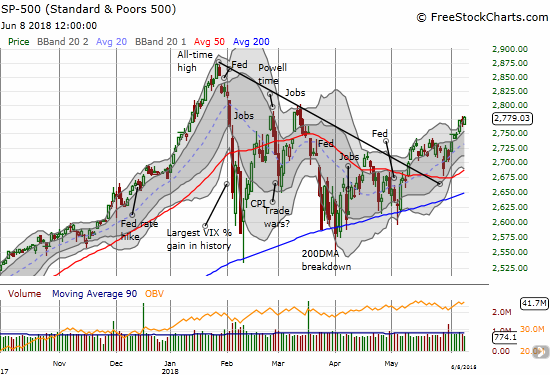
The trading action took me right to the edge of flipping bearish and loading up on SPY put options. The tension could not be better placed given a G7 meeting that ended with President Trump demanding that the economic forum reinstate Russia’s membership and rankling the U.S.’s traditional allies. As I type, Trump is landing in Singapore for his summit with North Korea’s leader. Moreover, the Federal Reserve will almost certainly raise interest rates in its next policy statement due on Wednesday, June 13th. So far in 2018, the S&P 500 has consistently performed poorly in the aftermath of Fed statements (see chart above).
The currency markets are also on edge. While the U.S. dollar index (DXY) is in pullback mode, the Australian dollar (FXA) faded hard against the Japanese yen (FXY) in what looks like the fourth failure around the 84.4 level for AUD/JPY.
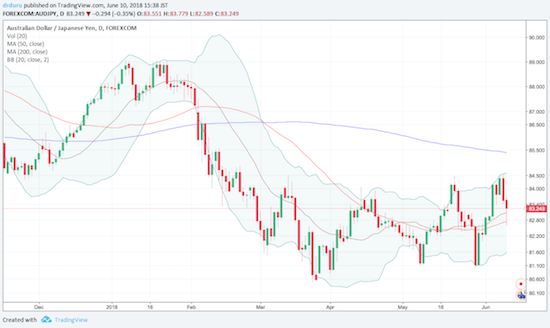
Source: TradingView.com
With alarm bells faintly ringing in my head, I decided to take a step back and look at a weekly chart of the S&P 500 (SPY). This view from the clouds provides a great reminder of the longer-term bullish price trend that remains underway.
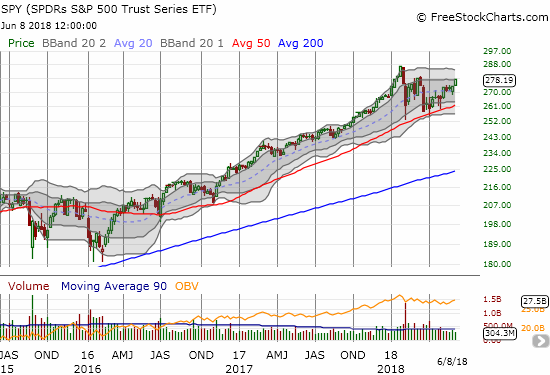
CHART REVIEWS
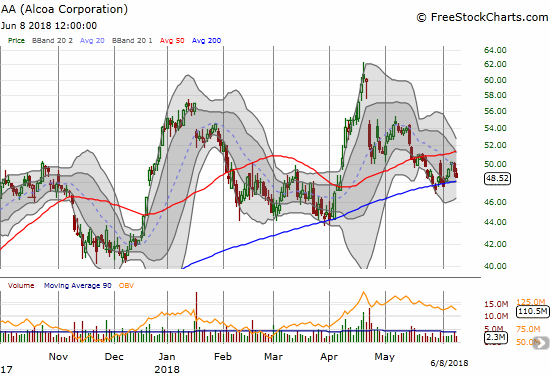
Alcoa (AA)
I thought I missed an opportunity to buy back into AA at 200DMA support. The stock pulled off a gap and crap after another steel and aluminum tariff announcement, and I averaged into a position. Now AA is stuck in near neutral as it continues to cling to 200DMA support.
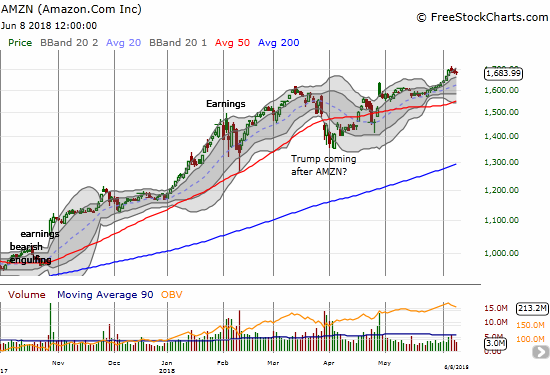
Amazon.com (AMZN)
I locked in profits on my calendar call spread ahead of AMZN’s near parabolic move that ended right around $1700. The three days of rest after the latest all-time high looks just like the pause needed to refresh…
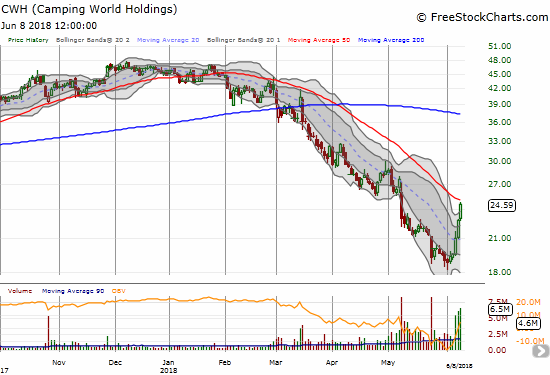
Camping World Holdings (CWH)
My hunt for beaten up stocks to play in the case of an extended overbought rally brought my gaze upon the RV stocks. CWH came first to my attention thanks to Jim Cramer. I was sloppy in failing to establish a starter position. Now the stock is already up 25%+ in three trading days and has to contend with downward trending 50DMA resistance.
People misunderstood latest acquisition: CWH CEO Marcus Lemonis from CNBC.
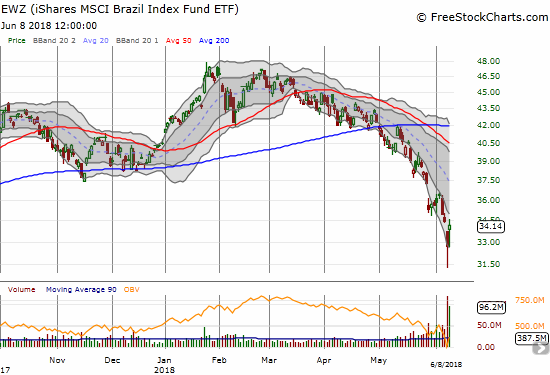
iShares MSCI Brazil Capped ETF (EWZ)
For one day, I thought I managed to buy a fresh bottom in EWZ. Fresh selling started two days after that. On Thursday, the Brazilian Real hit a 2-year low against the U.S. dollar and EWZ dropped steeply. I bought another tranche of EWZ given what looked like panic selling to me. EWZ jumped 4.4% to end the week. At one point, it closed the gap from Thursday. Needless to say, if EWZ makes another low, the ETF could slide a lot further. Still, history has taught me to buy into turbulence in Brazil, and I do not think this time is any different.
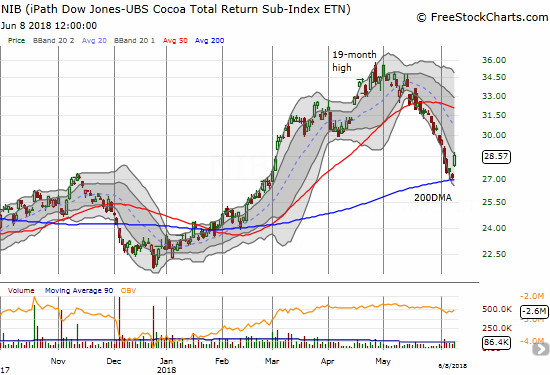
iPath Bloomberg Cocoa SubTR ETN (NIB)
I nibbled on NIB just in time. NIB made just about the best bounce off 200DMA support I could imagine. If NIB gets follow-through buying next week, I think it could easily challenge the now downward trending 50DMA. I will sell my holdings somewhere along that trajectory.
Speaking of cocoa, I am making great progress on “Cocoa” by Dr. Kristy Leissle. It is a must-read book for anyone who wants to learn all about the entire history and supply chain of cocoa and along the way get a deep appreciation for the struggles and challenges of the farmers who profit the least from this prized food. Later this year, I hope to write a review.
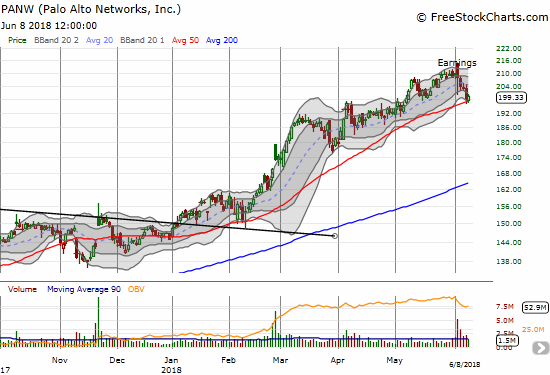
Palo Alto Networks (PANW)
I am eyeing PANW like a hawk. I thought the stock topped out with a post-earnings gap and crap. Now the stock is valiantly holding on to critical 50DMA support. The lower-BB channel is turning downward, so this juncture is very important for PANW. I am a buyer on follow-through buying. I am a seller (long puts) on a close below last week’s intraday lows.
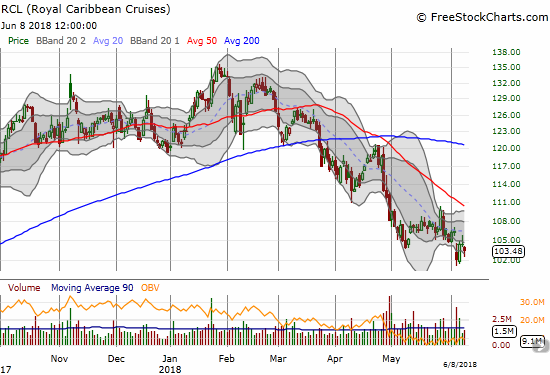
Royal Caribbean Cruises Ltd. (RCL)
Cruise lines have suffered mightily this year. Investors put on brave faces in the wake of last season’s serious hurricanes but all for naught. Stocks like RCL are trading at or near 52-week lows. Buying interest in RCL has been fleeting at best as the stock suffers through a persistent downtrend in 2018. Still, if the stock market enters an extended overbought rally, RCL is exactly the kind of beaten up stock I expect to bounce sharply as “bargain hunters” look for perceived upside potential.
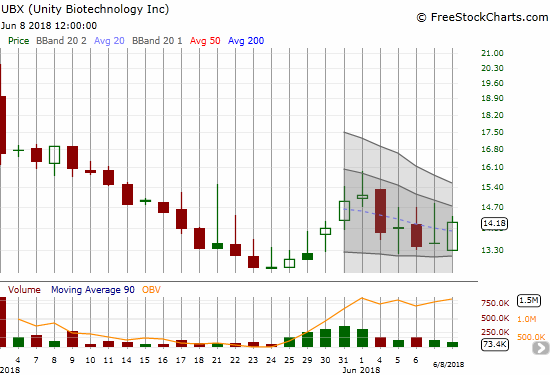
Unity Biotechnology, Inc. (UBX)
The dip I suspected was waiting around the corner for UBX arrived. I bought. Now I am looking for this recent IPO bio-tech stock to hold its all-time low as support.
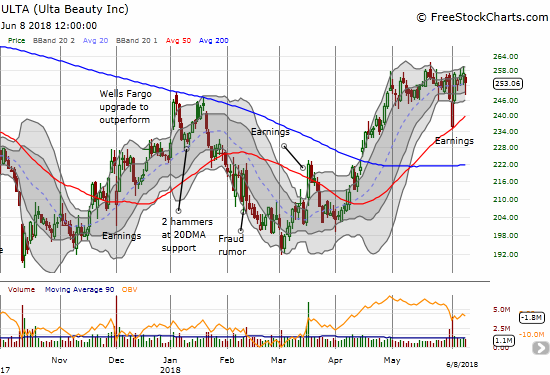
Ulta Beauty (ULTA)
Looks like I was too quick to call a post-earnings top in ULTA. Buyers kept going and took ULTA back to the top of its trading range. I will have to flip back to an ULTA bull if the stock manages to break above this trading range.
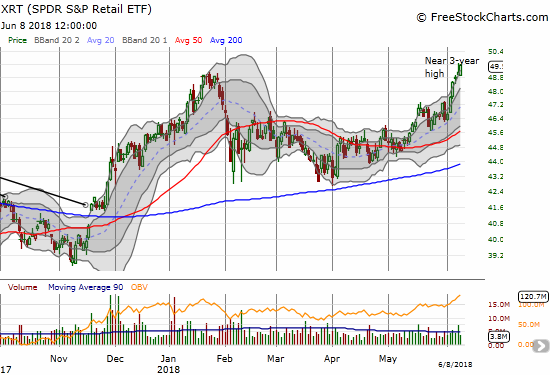
SPDR S&P Retail ETF (XRT)
All of the sudden, my retail comeback trade for 2018 is right back on the table. The move almost snuck right by me: XRT made a new 2018 high in the past week! This puts the index on the table for buys on the dip. If AT40 gives me the bullish go-ahead, I will not bother picking on any more individual retailers and will instead just ride call options on XRT.
In other trades: took profits on TWTR calendar call spread and entered a new one at the $42.50 strike.
NOT coming up short…
#DubNation, your 2018 Champs 🏆 will arrive back home this afternoon and we want you there when the squad arrives! #StrengthInNumbers
Team's expected arrival time is 3:30pm and fans can begin lining up outside of Landmark Aviation (8433 Earhart Rd, Oakland) as early as 2pm. pic.twitter.com/9N0TxAYpcH
— Golden State Warriors (@warriors) June 9, 2018
Soak it in #DubNation. 🏆BACK-TO-BACK CHAMPS🏆 #StrengthInNumbers pic.twitter.com/7tpcUPjGIe
— Golden State Warriors (@warriors) June 9, 2018
— – —
FOLLOW Dr. Duru’s commentary on financial markets via email, StockTwits, Twitter, and even Instagram!
“Above the 40” uses the percentage of stocks trading above their respective 40-day moving averages (DMAs) to assess the technical health of the stock market and to identify extremes in market sentiment that are likely to reverse. Abbreviated as AT40, Above the 40 is an alternative label for “T2108” which was created by Worden. Learn more about T2108 on my T2108 Resource Page. AT200, or T2107, measures the percentage of stocks trading above their respective 200DMAs.
Active AT40 (T2108) periods: Day #78 over 20%, Day #47 over 30%, Day #42 over 40%, Day #24 over 50%, Day #7 over 60% (overperiod), Day #92 under 70%
Daily AT40 (T2108)
")
Black line: AT40 (T2108) (% measured on the right)
Red line: Overbought threshold (70%); Blue line: Oversold threshold (20%)
Weekly AT40 (T2108)

*All charts created using freestockcharts.com unless otherwise stated
The charts above are my LATEST updates independent of the date of this given AT40 post. For my latest AT40 post click here.
Related links:
The AT40 (T2108) Resource Page
You can follow real-time T2108 commentary on twitter using the #T2108 or #AT40 hashtags. T2108-related trades and other trades are occasionally posted on twitter using the #120trade hashtag.
Be careful out there!
Full disclosure: long UVXY calls, long AAPL calls, long EWZ shares, long NIB shares, long UBX shares, long ULTA put options, long AA shares, long and short various positions against the U.S. dollar
*Charting notes: FreeStockCharts.com stock prices are not adjusted for dividends. TradingView.com charts for currencies use Tokyo time as the start of the forex trading day. FreeStockCharts.com currency charts are based on Eastern U.S. time to define the trading day.