

The Market Breadth Summary
- Market relief emerged after extreme volatility, but divergent performance across sectors leaves overall sentiment without clarity.
- Market breadth indicators reflect relief rather than confirmation, as risk-off pressures ease without resolving all underlying bearish signals.
- The equal-weight S&P 500 represents the bullish side of the market’s current narrative.
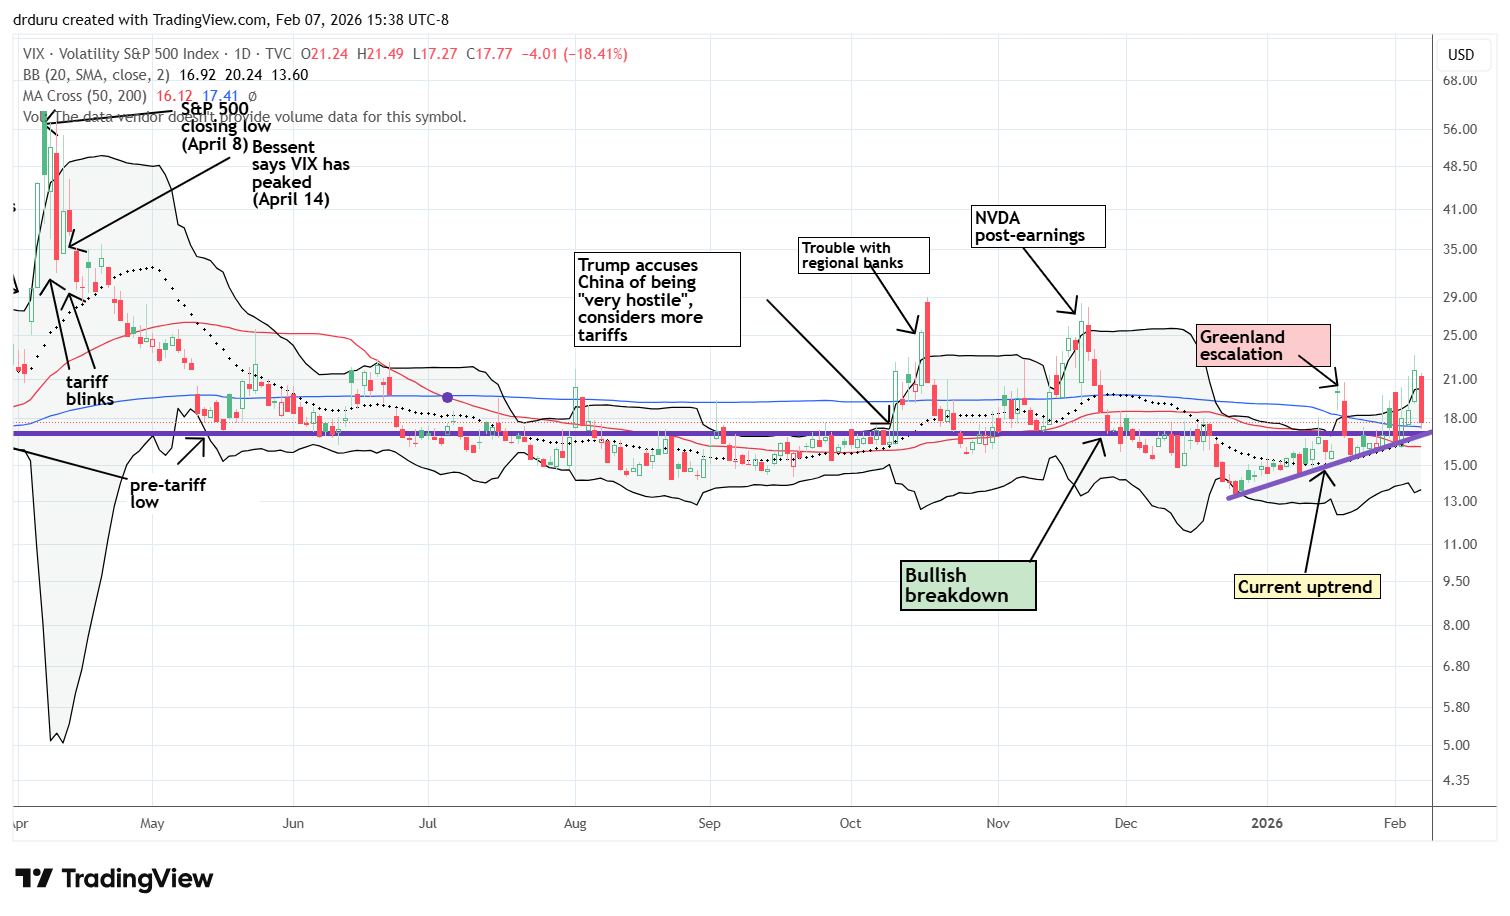
- Relief from the pressure in the VIX is tempered by an on-going uptrend from recent lows.
- Crypto-related weakness reinforces bearish feedback loops, contributing to mixed cross-asset signals.
Stock Market Commentary
I switched to “risk off” and cautiously bearish in late January. The subsequent bearish trading action unfolded mainly “under the hood” of the major indices from late January through the beginning of last week, before accelerated selling emerged. A major market rotation away from tech stocks started before the bearish signals and continued to hold up the S&P 500 in particular until the index finally broke down under the weight of overwhelmingly negative market sentiment. It was a week where extreme volatility broke out without specific news catalysts. I interpret the trading action as the final culmination of the bearish forces I have been warning about for weeks.
Last Friday’s sharp rebound reflects relief rather than a confirmed shift in trend. Given tech stocks in general remain in bearish territory, there is no clarity on overall market sentiment. I would not be surprised if the market’s rotational forces resume and cause wider divergences in performance.
There are divergent narratives unfolding concurrently. Semiconductors, industrials, manufacturing, and small caps sit firmly on the bullish side of the ledger. Tech, driven by software and some wavering AI-related trades, are teetering on the bearish side of the ledger. Cryptocurrencies, especially Bitcoin, add to a bearish market sentiment that seems to be providing a bearish feedback loop for market sentiment. Thus, while Friday’s relief cancelled out my risk off stance, I am far from risk on.
The Stock Market Indices
S&P 500 (SPY)
The S&P 500 set an all-time closing high the day before the Fed’s January statement on monetary policy. The index gapped to an all-time intraday high right before the release of the statement. The sellers took over from there. They even managed to steamroll buyers until a breakdown below support at the 50-day moving average (DMA) (red line) motivated the strongest buyers to jump in. This pattern has been uncannily consistent and reliant. After the third encounter with 50DMA support within months, I could not imagine the pattern holding up a fourth time. A 50DMA breakdown in particular is supposed to be bearish. Last week, the pattern held for a fifth time in 4 months. The S&P 500 lost 1.2% on its 4th 50DMA breakdown in less than 3 months and rebounded the very next day for a 50DMA breakout and 2.0% gain.
Whenever this pattern finally fails, I expect a true correction to unfold, a minimum 10% pullback.
")
NASDAQ (COMPQ)
The most intense pain in the stock market came from tech stocks. The NASDAQ remains in bearish position despite a 2.2% surge on Friday. The tech-laden index remains below its 50DMA and a double top looms over all of the NASDAQ’s trading action. Last week’s 50DMA breakdown confirmed the double top.
For short-term traders, the NASDAQ hit an overextended move to the downside on Thursday with a close well below its lower Bollinger Band (BB) (the blacklines defining 80% of expected price volatility). In a highly volatile trading environment the rebound from such an oversold condition can be abrupt and swift. The NASDAQ’s reversal left behind a “bear trap” where over-eager shorts and sellers found themselves suddenly chasing prices higher and thus contributing to the upward surge, a self-reinforcing loop for the day. I do not have supporting data, but this is the narrative and image I like to picture to explain the action and to remind me about the bullish possibilities of the reversal even as the NASDAQ remains in bearish territory.
")
iShares Russell 2000 ETF (IWM)
Small caps, like the components of IWM, contributed to the drag on market breadth. After hitting an all-time high in late January, sellers took over. My prior week’s calendar call spread squeaked out profits right before last week’s drop to 50DMA support. While I did not pull the trigger on the S&P 500 50DMA pattern, I did buy IWM call options on IWM’s test of 50DMA support. That trade worked out well on the way to an IWM gain of 3.6%. I took profits on my call options after IWM hit 2% right under 20DMA (the dashed line) resistance.
IWM remains in bullish position and is contributing to a stark contrast between the bullish and bearish parts of the market that mean there is no overall clarity on market sentiment.
")
The Short-Term Trading Call With Relief
- AT50 (MMFI) = 59.7% of stocks are trading above their respective 50-day moving averages
- AT200 (MMTH) = 62.3% of stocks are trading above their respective 200-day moving averages
- Short-term Trading Call: neutral
AT50 (MMFI), the percentage of stocks trading above their respective 50DMAs, closed the week at 59.7% after dropping to 53.9% the prior day. The sharp reversal ended my prior risk off warning from late January. As a result, I upgraded my short-term trading call from cautiously bearish to neutral. Over this time, the S&P 500 was flat from low to low. Thus, while my bearish trading call was quite timely for a large part of the market, there were enough components in the S&P 500 doing well to keep the index from going lower. My lesson from this experience is to zero in on the most relevant parts of the market with the trading call. Now, there is no clarity so a neutral stance seems appropriate.
AT200 (MMTH), the percentage of stocks trading above their respective 200DMAs, closed the week at 62.3%. AT200 stayed in relatively bullish territory and remained above the breakout from the last downtrend, which kept the longer-term picture looking good.
The volatility index (VIX) also shows the contrast between the bearish and bullish messages in the market. Last Friday’s 18.4% plunge represents the market’s major relief from a brief spike in concern. However, right underneath the relief remains a steady uptrend. That uptrend has now converged with the VIX’s level pre tariff trauma, drama, and noise. That convergence represents a source of firm support. Only if it breaks will the current relief receive confirmation. Also note how the pre-tariff level has become a major pivot since last summer.
In case you missed it…
Last week I took note of the bullish breakout $XLI on a positive turn for manufacturing. Palantir ($PLTR) was in focus after earnings. My first time looking closer at PLTR’s results taught me this is exactly the kind stock I should have bought soon after the IPO!
The Equities: Relief
Invesco S&P 500 Equal Weight ETF (RSP)
Description: RSP is an ETF that holds the stocks in the S&P 500 with each holding weighted equally.
Technical status: RSP gently tapped the 20DMA and then resolved volatility to the upside. RSP reached a new all-time high with a 1.9% gain.
Trade commentary: RSP provided a core reason for me to flip neutral. Three weeks of churn resolved to a breakout to an all-time high and confirmed support at the 20DMA. Thus the average S&P 500 stock is in good position. I cannot remain bearish seeing RSP perform and handle volatility so well. I could have stayed bearish if instead RSP broke down below its 20DMA.
")
SPDR Gold Shares (GLD)
Description: GLD is an ETF designed to track the price of gold.
Technical status: SPDR Gold Trust (GLD) crashed down from all-time highs but is now trying to reestablish its 20DMA as support.
Trade commentary: My “selective” bullishness on gold has paid off. While I wish I had a core GLD position, the ETF has delivered sufficiently profitable trading moments. My latest trade is working so far after I patiently waited for a pullback that I anticipated in my summary of the last Fed conference call (an easy call to make at the extremes of a parabolic move). I took profits on the February $400 put option after it lost more than 60% of its value. I had to endure one day of GLD dropping below its 20DMA. The February/April $500 call calendar spread is my remaining trade. I am willing to sell another put short if GLD drops to its 50DMA or lower. At that point, I would target a strike around the 200DMA (the blue line).
In two days, GLD lost 13.7% after it fell from its parabolic high of $495.50. The uptrend defined by the 20DMA remains intact for now. The trading volume is telling. GLD volume surged parabolically right to the all-time high. Volume peaked on the first day of the pullback and has quickly contracted since then. Thus, I expect some amount of stability in the coming days or weeks.
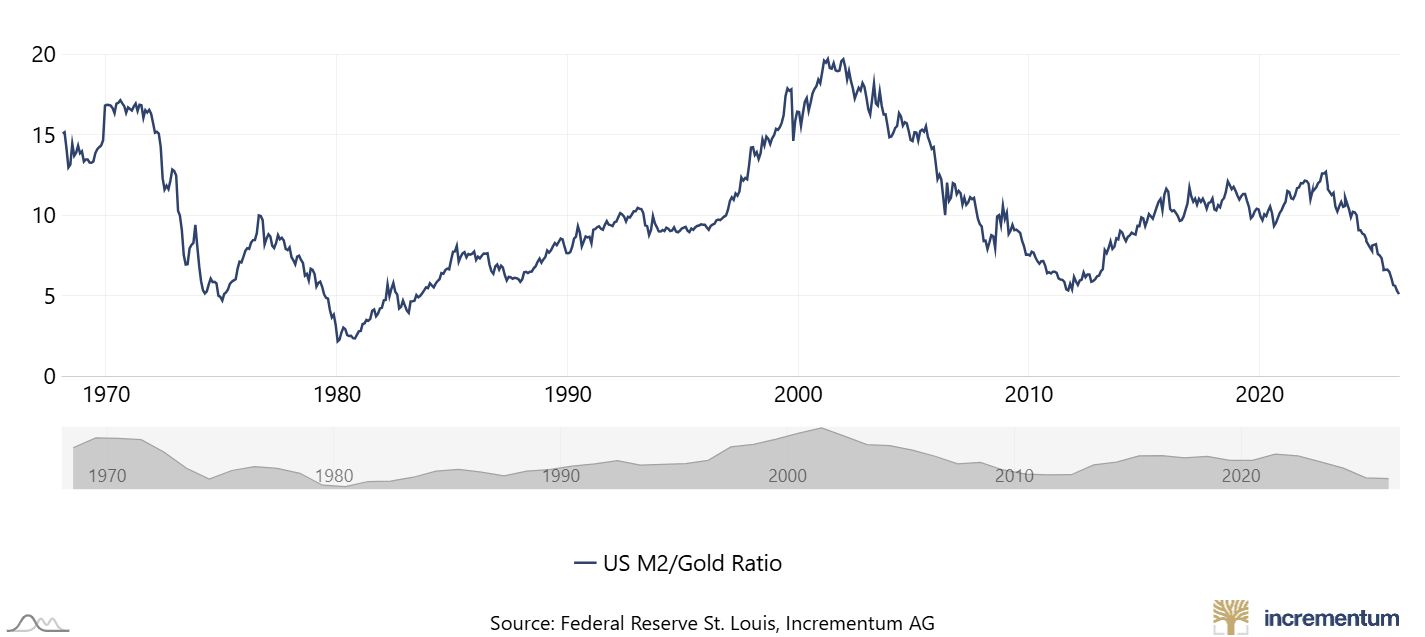
Cathie Wood recently used a ratio of the gold price to M2 money supply to suggest that gold is trading at an unsustainable extreme. I disagree. The market seems to be anticipating more gold-positive catalysts to come. For example, I am very skeptical of the conventional financial media’s notion that the President nominated Kevin Warsh to Chair the Fed to do anything but coax monetary policy into lower rates. Lower rates plus fiscal stimulus and investment meant to run the economy hot should be quite conducive to even higher gold prices.
")
iShares Silver Trust (SLV)
Description: SLV is an ETF designed to track the price of silver.
Technical status: SLV plunged 28.5% in an exhaustion move, bounced off the 50DMA, and then failed at the 20DMA as resistance. SLV plunged again and fell below the 50DMA, pushing SLV back toward bearish territory short term.
Trade commentary: Silver rallied a lot higher and faster than gold, so its correction was even steeper and more violent. In two days, SLV fell 31.4% and yet still managed to bounce off its 50DMA support. Unlike GLD, SLV resumed its breakdown last week. A 15.8% gap down created a bearish 50DMA breakdown. Even with LV clawing its way back above its 50DMA, I consider the ETF too hot to touch. I am content to wait to see some stabilization before even considering it for a buy.
SLV broke out from around 24 and went up by about 5x since March of 2024. That relentless buying accelerated through 2026 until the massive drop. The 28.5% plunge was major exhaustion and damage that would take a long time to repair. The failed relief rally is early evidence of the lingering damage to buyer sentiment.
")
Industrial Select Sector SPDR Fund (XLI)
Description: XLI is an ETF that holds industrial sector companies in the S&P 500.
Technical status: XLI broke out to a new all-time high and then confirmed the breakout with continued buying. XLI jumped 2.9% to another new all-time high.
Trade commentary: XLI was an early nick in my bearish thesis. Like RSP, XLI churned in place before resolving to the upside on a test of its 20DMA support. Positive economic news from the manufacturing sector pushed the first breakout (see my YouTube short above) ahead of the breakout for RSP.
In retrospect, I should have bought XLI after a breakout on January 6th as a part of the market’s rotation away from tech stocks, software and AI plays in particular. I have now added XLI (and select components like Caterpillar (CAT)) as a part of my 2026 shopping list.
")
iShares Expanded Tech-Software Sector ETF (IGV)
Description: IGV is an ETF focused on U.S. software companies.
Technical status: The iShares Expanded Tech-Software Sector ETF (IGV) has been on a strong decline since the start of the year. IGV finally found some support above the April low.
Trade commentary: IGV looks almost like the exact opposite of XLI. The ETF of software stocks has sharply diverged from the market’s rotation favorites like XLI. The panic selling reached full throttle with accelerated, indiscriminate selling last week. Relief finally came on Friday with a 3.5% gain after IGV closed right below last April’s closing low. That is, IGV hit an 18-month closing low.
I had IGV on my shopping list at 81, but I decided not to buy because I have accumulated a sufficient amount of individual software stocks. Still, in retrospect, I recognize that I should have bought IGV anyway for a trade, especially given the close well below the lower Bollinger Band representing an extreme oversold condition. If IGV does not gap higher on Monday, I will put on a swing trade with a stop below $78. As a reminder, software stocks are on my shopping list this year, and I am focused on writing periodic articles explaining the opportunities versus the risks.
")
VanEck Semiconductor ETF (SMH)
Description: SMH is an ETF focused on semiconductor companies.
Technical status: VanEck Semiconductor ETF (SMH) confirmed 50DMA support and ended the week with a 5.4% rebound.
Trade commentary: With so much going on, I lost track of the trading opportunity in semiconductor stocks. Semiconductors are at the center of the AI trade, so I should always have it front and center. SMH pulled off a perfect test of 50DMA support and rebounded sharply on Friday with a 5.4% gain. The close above 20DMA resistance positions SMH for further gains this week. Accordingly, SMH, and most of its components, remain as bullish as ever.
")
NVIDIA Corporation (NVDA)
Description: NVIDIA Corporation (NVDA) is a semiconductor company that designs GPUs and related computing platforms.
Technical status: NVIDIA Corporation (NVDA) rebounded way from 200DMA support, leaving behind a bear trap while closing right at its 20 and 50DMA pivots.
Trade commentary: While I forgot to keep an eye on SMH, I did notice NVDA’s rebound on Friday. The stock’s 7.9% jump created a “bear trap”. A bear trap occurs when sellers or shorts over-extend their stay and a gap higher the next day puts all new positions instantly into the red. Short covering and a scramble to buy back stock can add fuel to upward momentum. Some traders call this move a “180 Bullish Setup“, and I will use SwingTradeBot this weekend to look for other tradeable stocks with this setup.
Note that NVDA has gone absolutely nowhere since last July, so the stock’s price day-to-day has been mostly noise. A double-top from October continues to loom over the trading action.
")
Bitcoin (BTC/USD)
Description: Bitcoin is a decentralized cryptocurrency used as a digital asset and payment network.
Technical status: Bitcoin (BTC/USD) plunged well below the lower Bollinger Band, hit a 16-month low, and then rebounded sharply.
Trade commentary: The crypto overhang that started with a double top across August and October accelerated last week. Bitcoin, for example, demonstrated classic panic selling with a steep drop well below its lower Bollinger Band. Last Thursday Bitcoin dropped 14% to a 16-month low, a move that wiped out all of Bitcoin’s gains since the pro crypto President was elected. That kind of single day over-extension of selling is bound to setup a sharp bounce whenever sellers exhaust themselves and buyers dare to step into the vacuum. The subsequent rebound buying was indeed aggressive with a 12% rebound. At the time of writing, Bitcoin has still not recovered Thursday’s losses so buyers have not “won” yet. A bottom looks more durable after Bitcoin trades above 73,000.
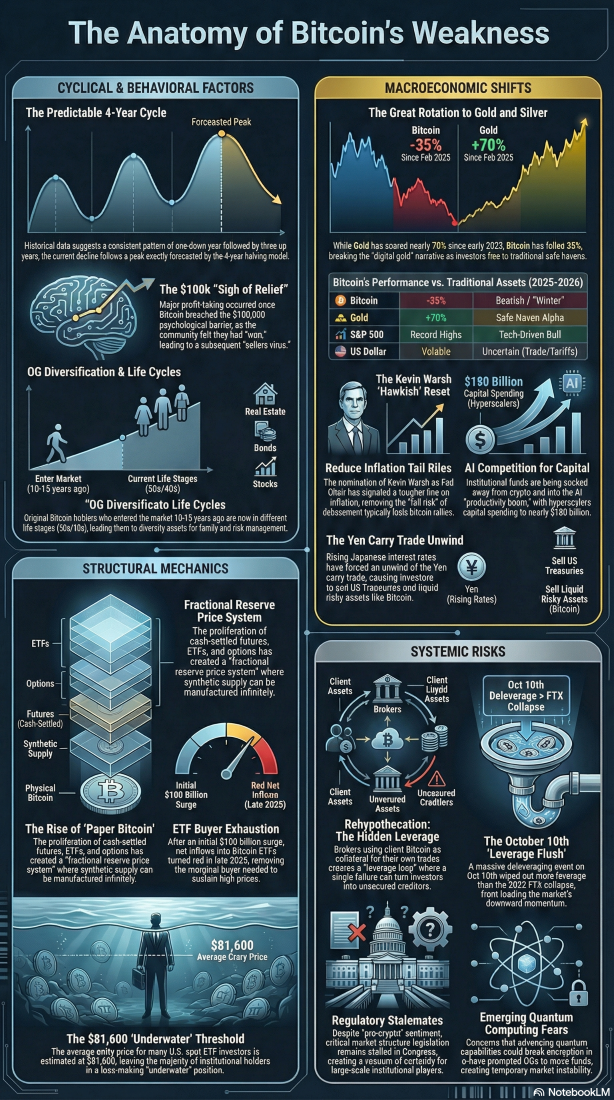
The fundamentals that were supposed to support Bitcoin have broken down in this sell-off. My trading strategy has broken down as well. I stopped nibbling after Bitcoin dropped below 80,000. As a part of risk management, I am bracing for a worst case 80% drawdown from the all-time high, a gut-wrenching fall to 25,000.
In the meantime, I am using Google’s NotebookLM to collect various claims, guesses, and analyses trying to explain the sell-off. You can check out my collection directly or review the NotebookLM-generated infographic below that summarizes my sources (note there are some typos but the information is faithful to the data sources I fed into the Notebook – this infographic is NOT the result of AI analysis or inference; it is synthesis).
")
ARK Fintech Innovation ETF (ARKF)
Description: ARKF is an ETF focused on companies tied to fintech innovation.
Technical status: ARKF plunged well below the lower Bollinger Band to levels last seen around late April, then rebounded 4.5%. ARKF remained highly volatile and driven by crypto-linked sentiment.
Trade commentary: I was short ARKF as a hedge against other positions but only recently realized it is actually a hedge against Bitcoin. I dared to hold the short position even as selling accelerated into deeper and deeper oversold conditions. ARKF closed below its lower Bollinger Band for five straight trading days. I finally covered on the fourth day. Relief came to ARKF on Friday with a 4.5% bounce. However, ARKF looks very broken. Like Bitcoin, I am not ready to believe in a durable bottom until the ETF successfully reverses all of Thursday’s 5.7% plunge.
")
Robinhood Markets (HOOD)
Description: Robinhood Markets (HOOD) is a financial services company that offers a trading platform for stocks, options, and cryptocurrencies.
Technical status: Robinhood Markets Inc (HOOD) broke down below its 200DMA and next accelerated a decline below its lower Bollinger Band. Relief came in the form of a sharp 14% rebound.
Trade commentary: HOOD is the second largest position in ARKF with a 7.4% allocation. I remain bullish on the company and the stock, so I have been eyeing this sell-off for a buying opportunity. However, the stock’s confirmed 200DMA breakdown plunged HOOD into a bearish position. Thus, I cannot be confident in an entry until the stock recovers its support from the major moving averages.
In the meantime, I bought shares in the middle of Friday’s 14% relief rally given it fully reversed Thursday’s plunge into deep oversold conditions well below the lower Bollinger Band. I will likely exit the shares ahead of this week’s earnings and reevaluate my strategy after I see how to the market reacts to the results.
")
")
")
Be careful out there!
Footnotes
Subscribe for free to get email notifications of future posts!
“Above the 50” (AT50) uses the percentage of stocks trading above their respective 50-day moving averages (DMAs) to measure breadth in the stock market. Breadth defines the distribution of participation in a rally or sell-off. As a result, AT50 identifies extremes in market sentiment that are likely to reverse. Above the 50 is my alternative name for “MMFI” which is a symbol TradingView.com and other chart vendors use for this breadth indicator. Learn more about AT50 on my Market Breadth Resource Page. AT200, or MMTH, measures the percentage of stocks trading above their respective 200DMAs.
Active AT50 (MMFI) periods: Day #151 over 20%, Day #40 over 30%, Day #38 over 40%, Day #33 over 50%, Day #9 under 60% (overperiod), Day #124 under 70%
Source for charts unless otherwise noted: TradingView.com
Full disclosure: long IWM shares, long SPY calls, long AMD, long ADM
FOLLOW Dr. Duru’s commentary on financial markets via StockTwits, BlueSky, and even Instagram!
*Charting notes: Stock prices are not adjusted for dividends. Candlestick charts use hollow bodies: open candles indicate a close higher than the open, filled candles indicate an open higher than the close.
* Blog notes: this blog was written based on the heavily edited transcript of the following video that includes a live review of the stock charts featured in this post. I used ChatGPT to process the transcript.