
Stock Market Analysis Summary
|
Stock Market Commentary
Last week could have delivered significant stock market disappointment.
- The Japanese central bank raised its interest rate to the highest level since 1999, a move which further threatens to unravel carry trades that may be propping up the value of risk assets.
- A tide of belated economic data reminded us of a weakening job market and wobbly economy.
- A poor response to earnings from home builders put the seasonal trade at risk.
- A tired AI trade weakened further on rumors that Oracle Corporation might cancel some AI-related spending plans.
Yet, the latest jump in AI-related fears seemed to exhaust short-term sellers as the stock market snapped back in the wake of Oracle’s denials. With buyers running strong for the rest of the week, the market looks ready to end the year positively. I am avoiding the term “Santa Claus rally” because negative technicals still loom overhead, including the potential for a true correction in early 2026.
The Stock Market Indices
S&P 500 (SPY)
The S&P 500 ended the week on a positive note, gaining 0.9% on Friday. This recovery followed a sharp drop on Wednesday when the index suffered a 50DMA breakdown on a 1.2% loss. At that point, the index appeared poised to challenge last month’s low. Instead, buyers stepped in immediately the next day and began the reversal.
The broader context remains mixed. The index continues to reflect pressure from a tired AI trade, and the market still has a double top in place following the Federal Reserve’s last two rate cuts. The Bollinger Bands (BB) have been compressing, signaling that a larger move, either a breakout or a breakdown, could be approaching in coming days. For now, I expect a positive resolution of this “BB squeeze”.
")
NASDAQ (COMPQX)
The NASDAQ looked worse than the S&P 500 during Wednesday’s selloff, but the tech-laden index also managed to close the week on a positive note with a 1.3% gain. The NASDAQ bounced cleanly off its 50DMA, which remains an important technical level.
Unlike the S&P 500, the NASDAQ did not come close to challenging its all-time high during its last rally. This shortfall raises the possibility that the index is forming lower highs, which could mark the early stages of a downtrend. However, since the NASDAQ recovered quickly from the 50DMA breakdown, I am assuming the runway remains open for the NASDAQ to still end the year on a positive note.
")
iShares Russell 2000 ETF (IWM)
Small caps appear to be in an even better position to end the year positively. Despite a 1.1% decline on Wednesday, IWM held perfectly at rising 20DMA support and finished the week with a 0.8% gain on Friday. Like the S&P 500, Bollinger Bands are tightening, suggesting a significant move could be ahead.
At a minimum, the technical setup looks strong enough for IWM to challenge its prior all-time high. Based on this setup, I positioned myself bullishly with call options on IWM (again, a trade around my core IWM position).
")
The Short-Term Trading Call While Getting Ready for the 2026
- AT50 (MMFI) = 55.9% of stocks are trading above their respective 50-day moving averages
- AT200 (MMTH) = 59.5% of stocks are trading above their respective 200-day moving averages
- Short-term Trading Call: neutral
AT50 (MMFI), the percentage of stocks trading above their respective 50DMAs, closed the week at 55.9%. My favorite technical indicator remains under the ceiling of a downtrend. A breakout attempt the previous week only lasted one day, an ominous failure which keeps me somewhat on edge and my short-term trading call sitting at neutral.
The longer-term breadth indicator, AT200, the percentage of stocks trading above their respective 200DMAs, continues to hold above its prior downtrend. Thus, AT200 remains a key source of optimism and supports the idea that the market can still end the year on a positive note even though short-term breadth remains subpar.
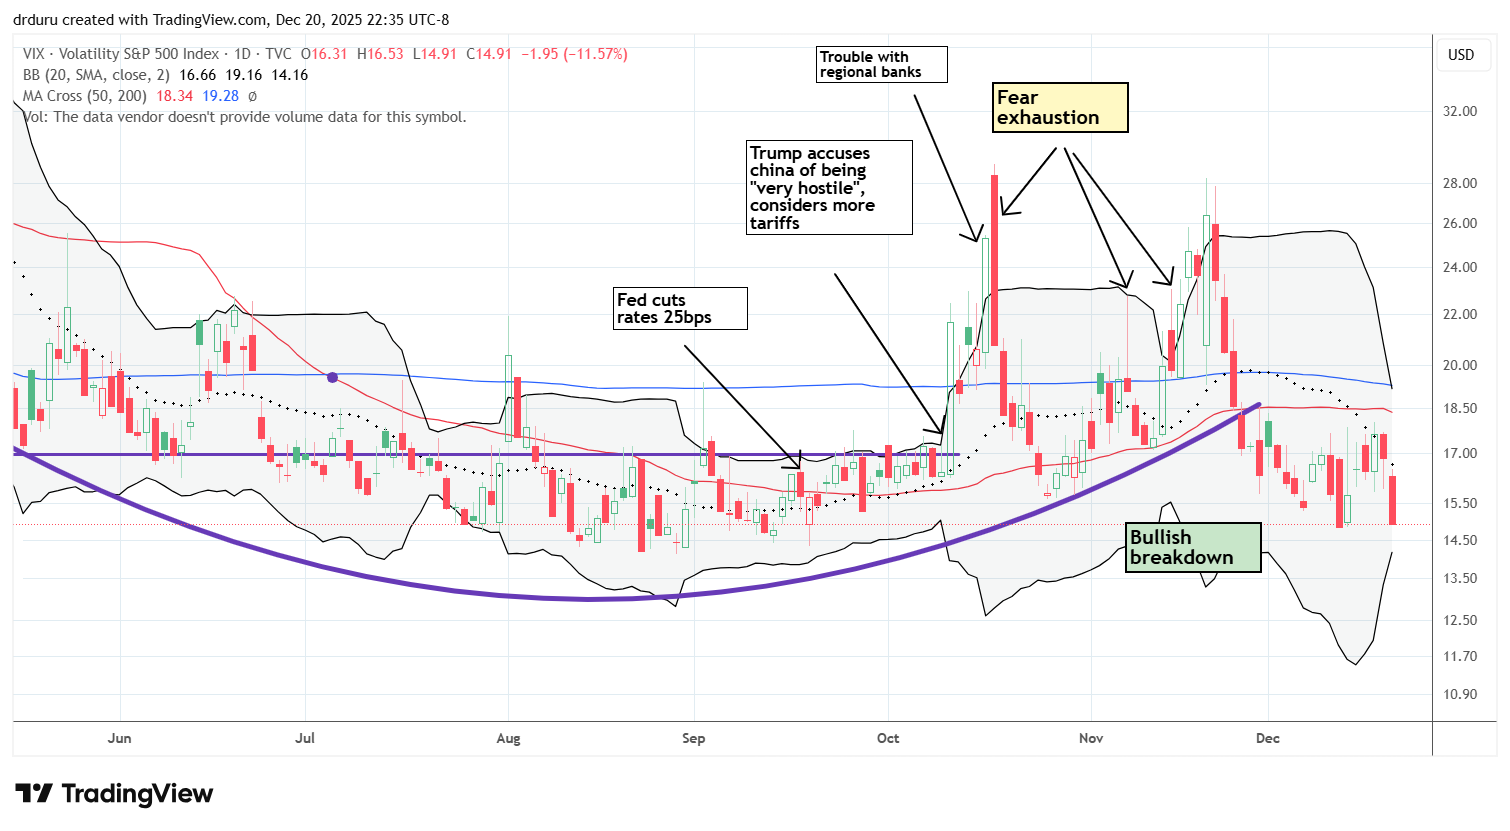
The volatility index (VIX) plunged on Friday and looks set to test its lows for the year. This close below the 15.35 pivot affirms the market’s overall complacency and sets the stage for the market to end the year positively.
The Equities: End the Year Positively
Caterpillar (CAT)
Description: Caterpillar manufactures construction and mining equipment, diesel and natural gas engines, and industrial gas turbines.
Technical status: Caterpillar maintained a strong uptrend with its 50DMA holding as support after a sharp pullback.
Trade commentary: CAT rebounded strongly from the tariff drama, trauma, and noise in March and April and maintained its uptrend since then along 50DMA support. A sharp pullback tested the uptrend for the first time since September. The selling stopped cold after Wednesday’s sharp 4.6% pullback. CAT turned higher precisely at trend support, a move which prompted me to buy a January 600/615 call spread. CAT remains an important signal that overall sentiment can still support a positive year-end outcome.
")
DoorDash, Inc (DASH)
Description: DoorDash operates an online platform that provides on-demand food and retail delivery services.
Technical status: DoorDash broke out above converging 50DMA and 200DMA resistance after fully reversing its post-earnings decline.
Trade commentary: DASH completely erased its post-earnings loss and broke out decisively above both its 50DMA and 200DMA resistance levels. The stock gained 1.4% on Friday, and the move represents another bullish signal, particularly given the consumer-focused nature of DASH’s business.
")
Carnival Corporation (CCL)
Description: Carnival Corporation operates cruise ships and provides vacation travel services worldwide.
Technical status: Carnival Corporation followed through bullishly after confirming support at its 200DMA and reclaiming the 50DMA.
Trade commentary: CCL surged 9.8% following earnings as bookings came in strong. While the stock did not challenge its high for the year, the follow-through after confirming multiple support levels is bullish and supports a growing rotation into consumer-facing stocks.
")
United Parcel Service (UPS)
Description: United Parcel Service provides package delivery and logistics services to businesses and consumers.
Technical status: United Parcel Service held a second breakout above its 200DMA, confirming early stages of recovery.
Trade commentary: UPS successfully held a second breakout above its 200DMA, marking a slow but steady recovery. Although UPS remains well below its prior highs, the stock supports the idea that the market is beginning to price in a consumer-friendly economic environment.
")
Micron Technology, Inc (MU)
Description: Micron Technology designs and manufactures memory and storage semiconductor products.
Technical status: Micron Technology Inc (MU) surged to a new all-time high following a 10.2% post-earnings gain, confirming 50DMA support for the second time in a month.
Trade commentary: MU delivered a strong post-earnings reaction and follow-through that pushed the stock to a marginal new all-time high. The stock has consistently held its 50DMA uptrend and successfully defended its support twice in the last month or so, maintaining MU as a bullish signal for the AI trade and the broader market.
")
Microsoft (MSFT)
Description: Microsoft develops software, cloud services, and hardware products for consumers and enterprises.
Technical status: Microsoft Corp (MSFT) held 200DMA support for the second time in a month while remaining below declining 50DMA resistance.
Trade commentary: MSFT continues to hold long-term support at its 200DMA, but declining 50DMA resistance looms as a cautionary technical limitation. I added to my position when the stock first held 200DMA support and remain hopeful for a future breakout above the 50DMA.
")
Dell Technologies (DELL)
Description: Dell Technologies designs, manufactures, and sells computers, servers, and enterprise IT solutions.
Technical status: Dell Technologies Inc (DELL) failed to test 50DMA resistance and instead broke down below its 20DMA and nearly retested 200DMA support.
Trade commentary: DELL initially held 200DMA support ahead of earnings but failed to break through 50DMA resistance on the subsequent recovery. The stock promptly sold off from there. DELL bounced 2.8% on Friday, but I am increasingly cautious and remain on alert. I am holding a stop loss below November’s low, a trigger that would barely preserve some profit from my position.
")
Vertiv Holdings (VRT)
Description: Vertiv Holdings provides digital infrastructure technologies for data centers and communication networks.
Technical status: Vertiv Holdings Co (VRT) broke down below its 50DMA and rebounded after briefly breaking down below prior all-time high support for the second time in a month.
Trade commentary: VRT experienced a sharp selloff tied to AI trade fears and Oracle-related rumors but rebounded after Oracle denied those rumors. VRT remains one of my favorite AI-related stocks, but I am on edge and will strictly enforce a stop loss below the recent low to protect substantial profits (similar to my hard decision to stop out of shares of AMD, my first AI-related holding to drop from the longer-term portfolio). The best way I know to avoid hanging around for the bursting of a bubble is to stick to the discipline of technicals.
")
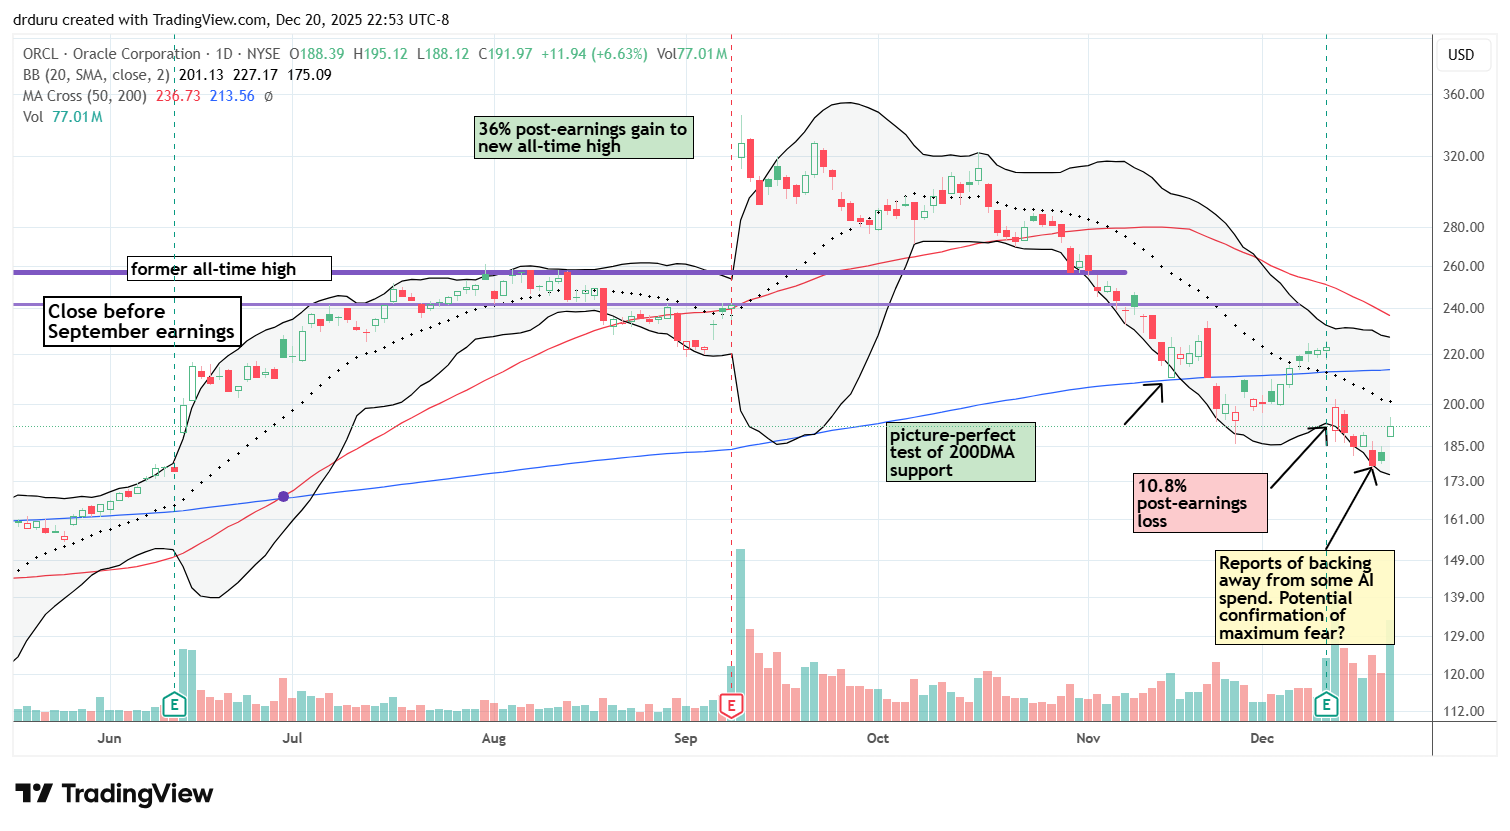
Oracle Corporation (ORCL)
Description: Oracle Corporation develops enterprise software and cloud infrastructure services.
Technical status: ORCL rebounded sharply on heavy volume after a selloff driven by increasing AI skepticism and fear.
Trade commentary: ORCL suffered a sharp selloff tied to rising credit default swaps and AI buildout rumors, followed by a strong rebound on heavy volume. Despite the bounce, ORCL faces significant overhead resistance, and I am not interested in investing until the technicals improve.
Accenture (ACN)
Description: Accenture provides consulting and technology services with a focus on digital transformation.
Technical status: Accenture reversed its 1.4% post-earnings decline and challenged 200DMA resistance.
Trade commentary: ACN reversed all post-earnings losses after buyers stepped in aggressively starting at 20DMA support. A close above 200DMA resistance could accelerate the recovery that began in November. I will reestablish a position in ACN on a 200DMA breakout.
")
Caption: Accenture reversed its post-earnings decline and challenged 200DMA resistance.
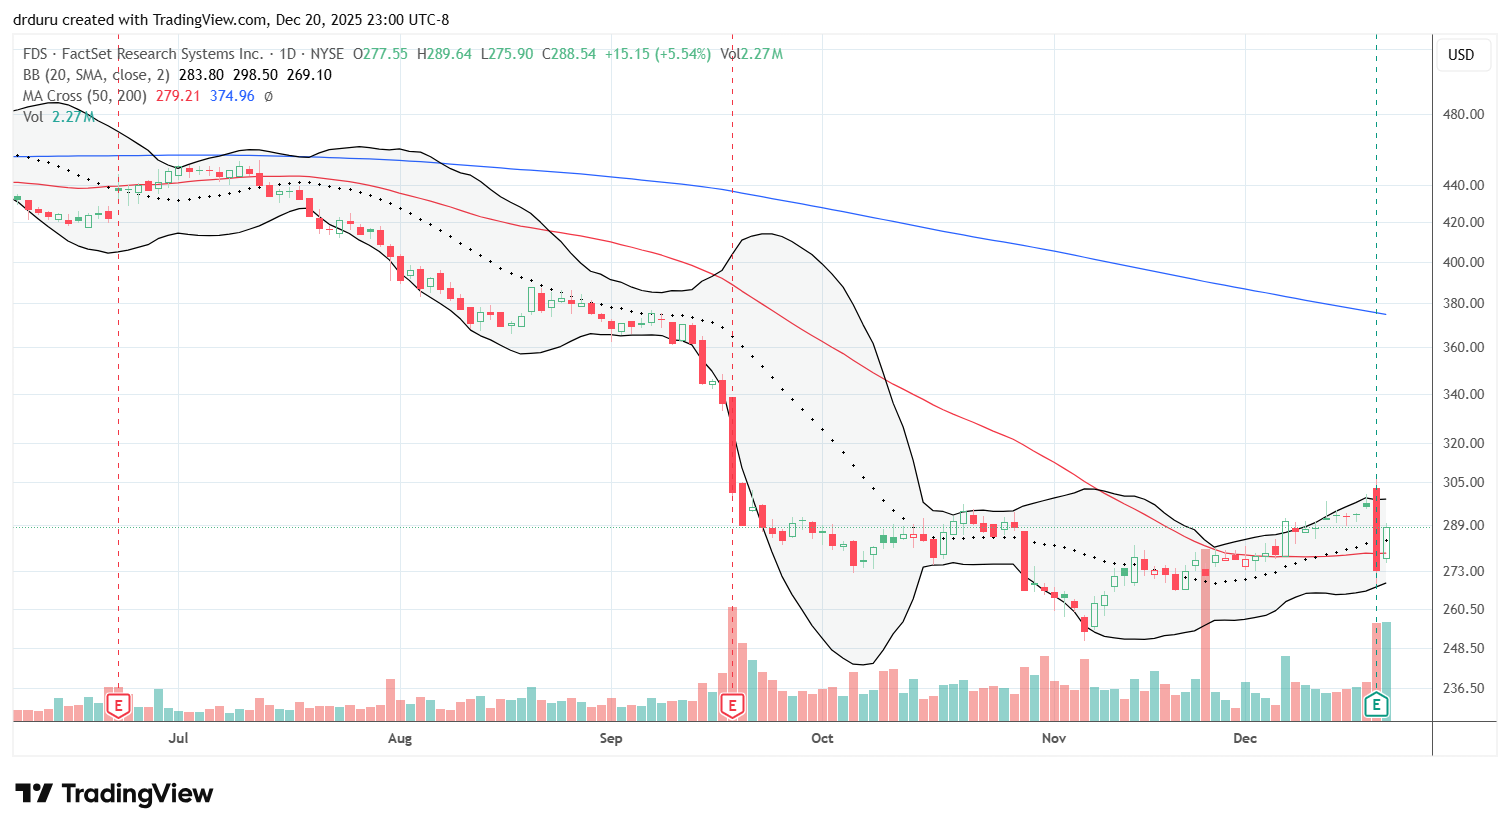
FactSet Research Systems (FDS)
Description: FactSet provides financial data analytics and research tools.
Technical status: FactSet Research Systems (FDS) rebounded sharply after a 7.7% post-earnings selloff, hinting at a possible bottoming attempt.
Trade commentary: FDS dropped sharply after earnings but immediately attracted buyers the following the day. While the upside could be significant if a reversal develops, I want to see a full recovery of post-earnings losses before getting involved again. I saw nothing in the headline earnings results to cause me concern.
Booz Allen Hamilton (BAH)
Description: Booz Allen Hamilton provides management and technology consulting services, primarily to government clients.
Technical status: Booz Allen Hamilton remained below declining 50DMA resistance amid elevated trading volume.
Trade commentary: BAH attracted my interest after the CEO loaded up on over $2M in shares. The stock is under new pressure following the chief financial officer’s resignation. Elevated volume provides the potential for seller’s exhaustion. Ironically, the sell-off helped me hold on to the profit in my shares, profit from a call I sold short against those shares, and roll into a short Jan $90 call.
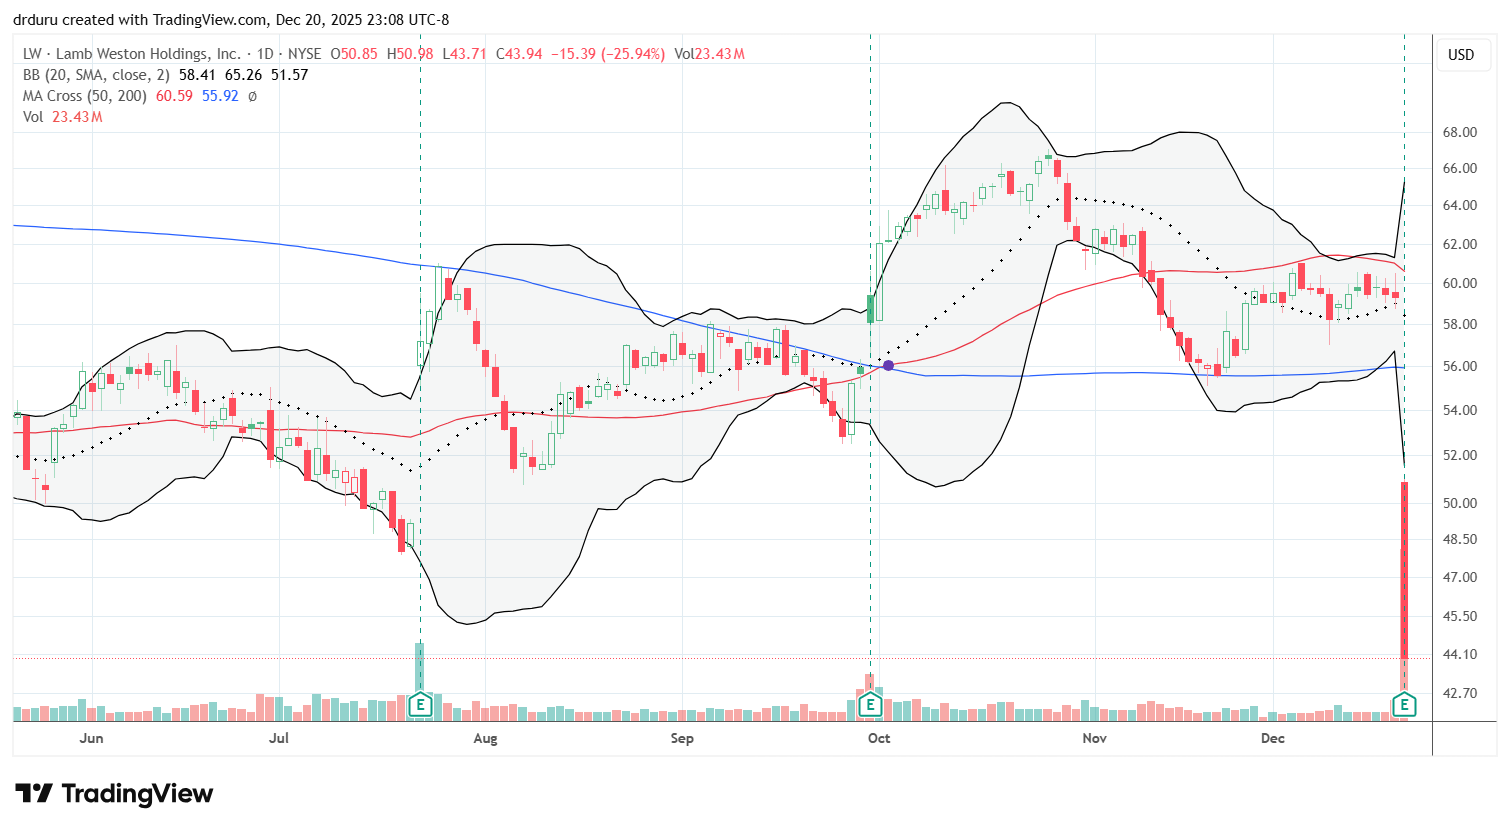
Lamb Weston Holdings (LW)
Description: Lamb Weston processes and markets frozen potato products for foodservice and retail customers.
Technical status: Lamb Weston Holdings, Inc (LW) collapsed to a new multi-year low following a sharp 25.9% post-earnings selloff to levels last seen in the immediate aftermath of the pandemic.
Trade commentary: LW was my biggest disappointment of the week. I moved from a profit to a loss after taking a chance that LW’s recent success at remaining stable after earnings indicated early signs of a recovery underway. Instead, I am looking to exit the stock after the next rebound, which I suspect will be a false recovery.
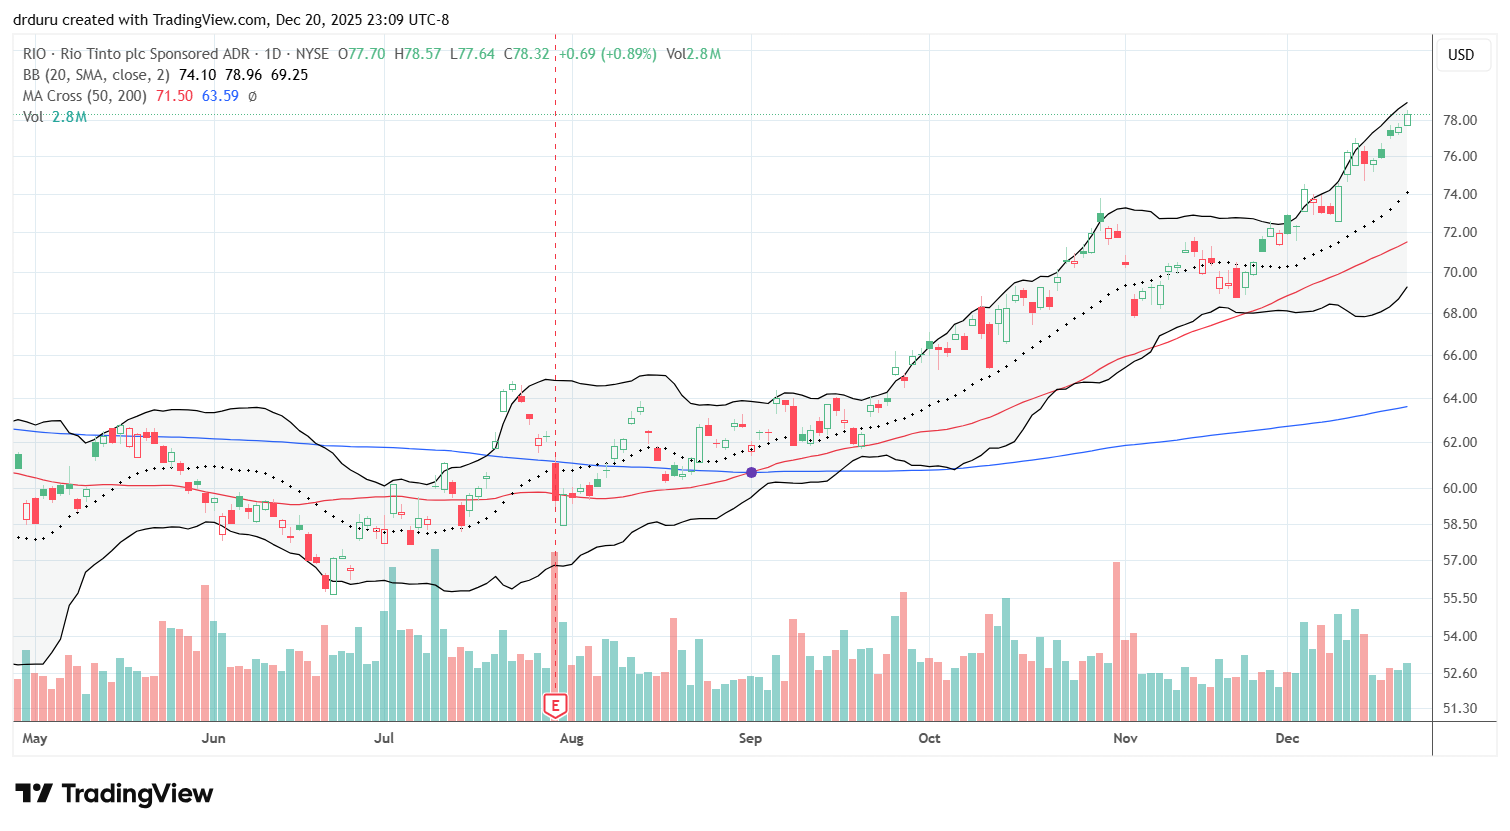
Rio Tinto (RIO)
Description: Rio Tinto is a global mining company producing metals and minerals.
Technical status: Rio Tinto plc (RIO) continued a strong breakout with sustained upside momentum. Last week’s rally took RIO close to a 3-year high.
Trade commentary: RIO remains one of my favorite commodity plays for a coming era where I think central banks will be forced to increase market accommodation even with stubbornly sticky inflation. The current breakout could mark the start of a longer-term secular move.
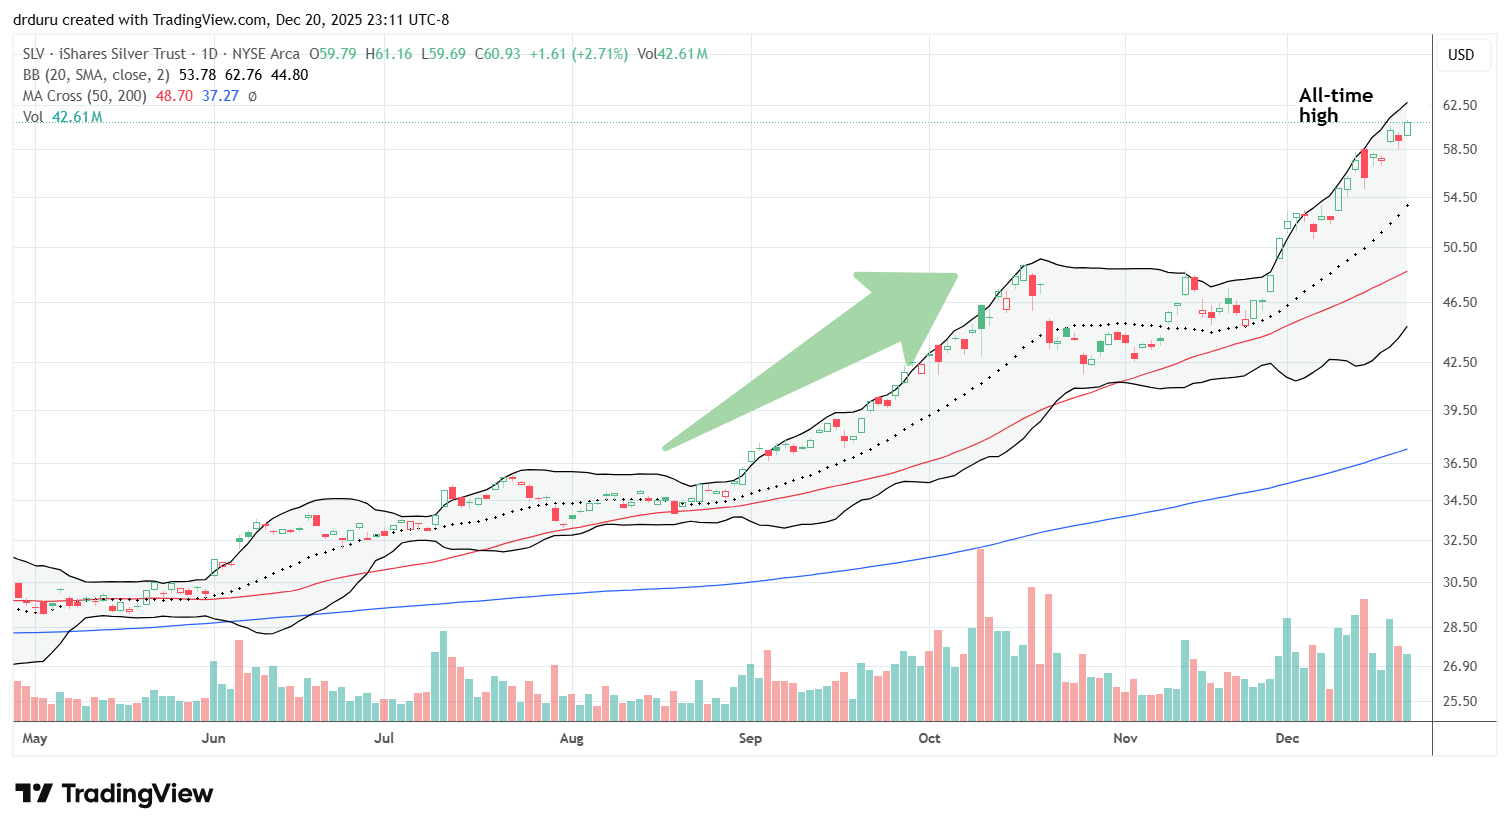
iShares Silver Trust (SLV)
Description: The iShares Silver Trust (SLV) is an exchange-traded fund designed to track the price of silver by holding physical silver bullion, allowing investors to gain exposure to silver price movements without owning the metal directly.
Technical status: SLV is on an amazing uptrend. After resting the last half of October and all of November, SLV resumed its streak higher this month.
Trade commentary: SLV has been one of my big misses of the year. I only managed to trade it once or twice. I take some consolation that my commodity plays like RIO are now trading in near tandem with SLV. This move seems to validate my expectations for an accommodative Fed even before a new chair takes office in May installed to direct the President’s ideas for monetary policy.
")
")
Be careful out there!
Footnotes
Subscribe for free to get email notifications of future posts!
“Above the 50” (AT50) uses the percentage of stocks trading above their respective 50-day moving averages (DMAs) to measure breadth in the stock market. Breadth defines the distribution of participation in a rally or sell-off. As a result, AT50 identifies extremes in market sentiment that are likely to reverse. Above the 50 is my alternative name for “MMFI” which is a symbol TradingView.com and other chart vendors use for this breadth indicator. Learn more about AT50 on my Market Breadth Resource Page. AT200, or MMTH, measures the percentage of stocks trading above their respective 200DMAs.
Active AT50 (MMFI) periods: Day #133 over 20%, Day #22 over 30%, Day #20 over 40%, Day #15 over 50% (overperiod), Day #8 under 60% (underperiod), Day #106 under 70%
Source for charts unless otherwise noted: TradingView.com
Full disclosure: long IWM shares, long LW, long CAT calendar call, long MSFT, long BAH covered call, long DELL, long VRT, long RIO
FOLLOW Dr. Duru’s commentary on financial markets via StockTwits, BlueSky, and even Instagram!
*Charting notes: Stock prices are not adjusted for dividends. Candlestick charts use hollow bodies: open candles indicate a close higher than the open, filled candles indicate an open higher than the close.
* Blog notes: this blog was written based on the heavily edited transcript of the following video that includes a live review of the stock charts featured in this post. I used ChatGPT to process the transcript.