Stock Market Commentary
The stock market suffered experienced a jarring selloff during the announcement of reciprocal tariffs from President Trump, a move that, despite ample telegraphing, shocked both investors and global trade partners. The Futures dropped sharply, with even oil down 2.4% and the S&P 500 plunging as much as 3% after-hours. This tariff crash necessitates a trading plan. After setting the context, I will explore a few scenarios.
What surprised me most was the market’s apparent lack of preparation for bad news. Despite months—if not a year—of telegraphing these tariff plans, investors failed to price in the associated risks. The market even first rallied when Trump started with news about a 10% baseline tariff against all countries. This behavior underscores a key pricing risk in the market: with unstable and changing policies that includes the prospect of retaliatory actions from across the globe, it may be difficult for markets to properly price in downside risks. Countries like Vietnam, which will be significantly affected, may impact companies like Nike (NKE) that depend on their manufacturing base. The EU is already planning countermeasures. Canada and Mexico’s responses are still evolving.
Despite this disarray, I emphasize: do not panic. Selling into an oversold market—particularly in the major indices—is a poor trading strategy. While there are individual stocks with poor fundamentals that may warrant selling at any time, selling index exposure in the middle of a sharp drawdown is typically the wrong timing. The appropriate time to sell was earlier—like at the 200DMA breakdown—not when prices are collapsing and emotions are peaking.
I spent time scrolling through CNBC and Yahoo Finance headlines, and the tone of those stories—words like shock, worse than the worst-case scenario, and punishing tariffs—reflects the lack of preparation of analysts and commentators. Even a piece by a CNBC Pro commentator described the tariffs as worse than their downside base case. Some market participants hoped negotiations would lessen the blow or that Trump would not follow through. Thus, the headlines are fueling the potential for panic.
So again, I urge you: do not panic. Instead, have a trading plan.
The Stock Market Indices
S&P 500 (SPY)
The S&P 500 gave a false sense of stability, gapping down and rallying to gains in a sign of capitulation by sellers. Remember, the index remains below its 200-day moving average (DMA) (the blue line), placing it firmly in bear market territory under my criteria. Thus, the price action will remain subject to sharp disruptions. The conventional bear market definition at 20% below all-time highs creates a late signal. In fact, by THAT time, a bear market call can become a strong buying signal!
NASDAQ (COMPQ)
The NASDAQ has been limping behind the S&P 500 and has been especially vulnerable. I laid out a worst-case scenario where the index could fall rapidly to 16,000 if follow-through selling occurs. This level could trigger buying opportunities assuming market breadth is deeply oversold by that time.
The iShares Russell 2000 ETF (IWM)
IWM added to the whiplash by printing a promising bullish engulfing pattern, suggesting a possible bottom. I had previously purchased IWM calls on its extreme move. I took profits before the tariff announcement due to my growing unease with the market rallying into major (bad) news and looming resistance from the downtrending 20DMA (the dotted line).
The Short-Term Trading Call With A Trading Plan
- AT50 (MMFI) = 28.5% of stocks are trading above their respective 50-day moving averages
- AT200 (MMTH) = 37.1% of stocks are trading above their respective 200-day moving averages
- Short-term Trading Call: cautiously bullish
AT50 (MMFI), the percentage of stocks trading above their respective 50DMAs, closed at 28.5%. My favorite technical indicator dropped as low as 22.6% before rallying. AT50 approached the oversold threshold but avoided touching the March low. This kind of higher low could be the beginning of a sustainable low.
The volatility index (VIX) gapped higher at the open but faded sharply all day. However, the VIX still closed with a gain. Since the VIX did not gap at least to its previous high, the morning’s open is not as strong a capitulation moment as I would like. A “turnaround Tuesday” with strong follow-through buying would increase my confidence in a capitulation-type low.
My Tariff Crash Trading Plan
I built my trading plan around avoiding emotional reactions and making methodical decisions based on technical indicators, particularly during market extremes. My goal is not to predict what happens next, but to map out scenarios and execute if specific signals appear according to the AT50 trading rules.
If the market reaches official oversold conditions – with AT50 dropping to 20% or below – then my short-term trading call can flip from cautiously bullish to bullish. While I might also use this opportunity to make long-term investments, I have to apply careful risk management given the bear market. In other words, I execute short-term trades in anticipation of selling into the next bounce out of oversold conditions.
The VIX plays an important part of the trading plan at these levels. During Monday’s possible capitulation day, the VIX did not spike to previous highs, weakening the overall capitulation signal. I am now watching for either a gap up in the VIX to its prior highs or, ideally, a spike above 35 followed by a sharp decline. If the market delivers both AT50 oversold (below 20%) and a VIX spike followed by a plunge, then this powerful combination will trigger bullish trades.
How I Trade Shares and Options in This Trading Plan
In extreme conditions like these, I manage risk carefully. For example, I buy shares in small amounts in anticipation of the potential to accumulate more at lower prices. I only buy shares in companies that give me high confidence and conviction. This is NOT the time for wild speculation like the traders whipping around recent IPO Newsmax (NMAX): up 492% day 1, up 179% day 2, and down 77% day 3. Yikes!
For options, I mainly trade spreads—either vertical, calendar, or diagonal. Why? Because option premiums explode higher during volatility spikes, and buying straight calls can easily backfire. Even if the stock moves in the expected direction, an implosion in implied volatility can significantly erode gains and even cause losses. I learned these lessons the hard way. With spreads, I reduce exposure to inflated volatility premiums and maintain better control of my risk/reward profile.
Note well – I do not predict bottoms. The AT50 trading rules are about identify good risk/reward trading rules at and near market extremes. Trades represent reactions and do not form (explicit) predictions.
Historical and Structural Context
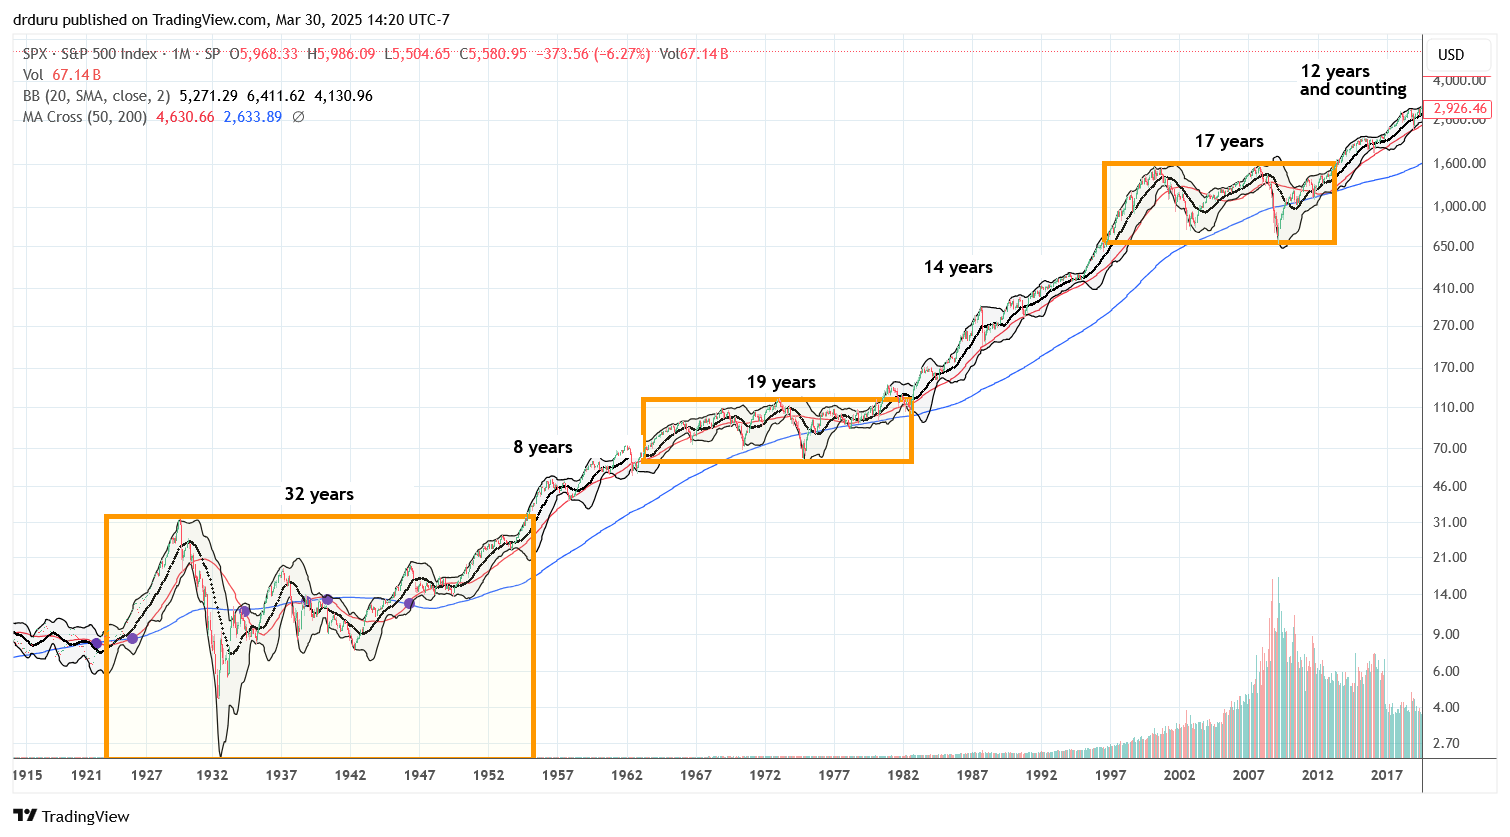
Beyond the immediate setup, I have reflected on the long-term chart of the S&P 500. The market’s long uptrend has created a widespread belief that stocks always go up in the “long-term”. This is a byproduct of a global economic order that supported this growth.
But that order is ending.
Think about this: the S&P 500 has experienced extended periods in the past of going nowhere for long stretches of time, such as from the early or mid 1960s to 1982, and again from 2000 to 2013. If the global economy is truly getting restructured right before our eyes, then the market may enter another long-term trading range as prices and expectations adjust. In other words, if the economic order is much different than the past, then past relationships are likely to fail. Traders and investors alike cannot take one pattern from the past and assume it will apply for a current condition. We must all remain vigilant, strategic and prepared for churn.
Valuation Concerns
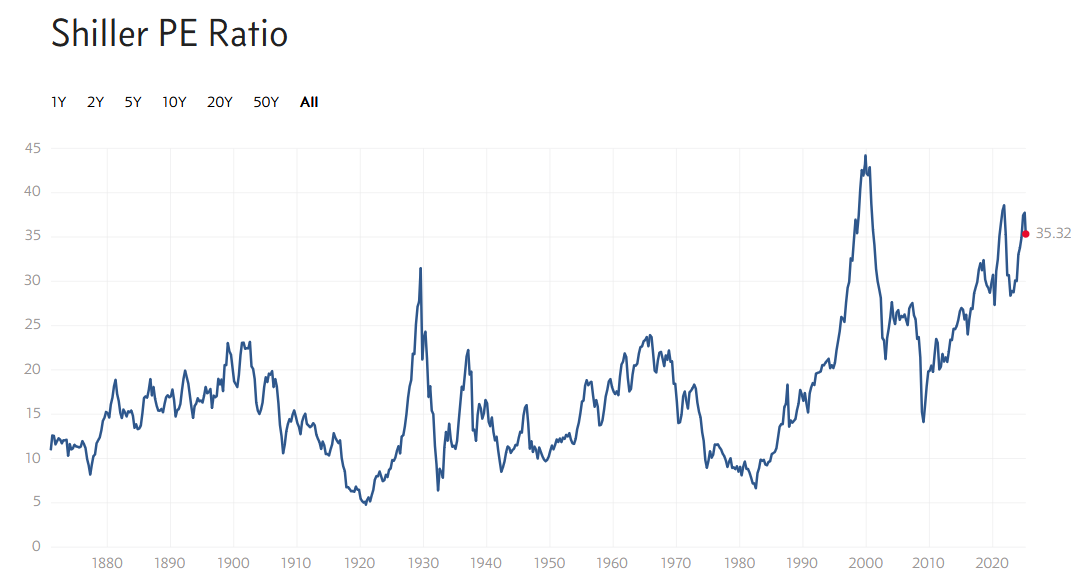
Looking at valuation metrics, such as the Shiller P/E ratio, the market remains richly valued even after the recent drawdown. The chart below shows that today’s high valuation stopped short of both the pandemic surge peak and the 2000 dot-com bubble top but there is plenty of room to the downside for valuations to properly price in a new more uncertain and volatile economic order. In particular, note that Trump is fond of justifying tariffs because of U.S. economic performance before 1913. If we are gunning for a pre-1913 economy then perhaps we will also get pre-1931 stock valuations….much lower than current levels!
U.S. Treasury Secretary Scott Bessent Talks Tariffs
Bloomberg interviewed U.S. Treasury Secretary Scott Bessent shortly after Trump finished his description of the U.S.’s new tariff plans. Starting a month ago, I paid closer attention to Bessent’s policy pronouncements. They are very educational and revealing. I pulled the following passages from the transcript of the interview with some editing help from ChatGPT…
Approach to Trade and Tariffs
- The Secretary emphasized that countries should not panic in response to the new tariffs; this is “the high bar, barring retaliation.”
- Although April 9th marks the activation of tariffs, no immediate negotiations are planned, but communications are expected.
- The Secretary reiterated that tariffs are being used both as a revenue tool and as leverage for trade negotiations.
Market Reactions and Economic Outlook
- Bessent downplayed short-term market movements, emphasizing the long-term fiscal shift away from public sector stimulus toward private sector growth.
- He characterized the U.S. economy as “very solid” and noted no hard data yet confirming a consumer pullback despite negative sentiment.
- Bessent also identified big cap tech stocks as the core weakness in the stock market and implied these companies are not of economic concern to the administration.
The message is clear. The administration is full steam ahead on tariffs and insists that the global economy should be grateful for this “certainty” of a ceiling on tariff rates. However, there can be no certainty until negotiations and retaliations play out.
The Equities: The Need for A Trading Plan
Apple (AAPL)
AAPL had started outperforming the NASDAQ in recent sessions despite its heavy exposure to China. Its 7% after-hours gap down revealed that the market was not adequately pricing the risk from China-related tariffs.
Dollar Tree, Inc (DLTR)
Previously identified as a potential turnaround candidate, DLTR was consolidating just below its 200DMA and posted an 11.2% earnings pop. However, the stock sold off sharply after the tariff announcement, underscoring how even bullish setups can falter in macro shocks. Moreover, I am left wondering why the market was so optimistic going into the tariff news.
Dollar General (DG)
DG convincingly recovered, hitting its 200DMA. I took profits on my call spread before the tariff news as the rally seemed overly optimistic. Moreover, the stock traded to my first price target right at 200DMA resistance. The stock dropped about 6% after-hours, showing here too that traders and investors were overly optimistic going into the tariff news.
Caterpillar (CAT)
CAT rallied into the close but then dropped 5–6% after-hours, reinforcing that industrials are also vulnerable, not just big cap tech as Bessent implied.
Amazon.com (AMZN)
AMZN rallied 2% on the day and may benefit from new trade rules hurting Chinese discount retailers like Temu. I may add call spreads on a pullback.
Etsy, Inc (ETSY)
E-commerce platform ETSY rallied into the tariff news. I am not sure whether ETSY gets a net win or loss given the platform includes international sellers who compete with domestic sellers. Note how traders optimistically rallied ETSY right to downtrending 50DMA resistance.
Be careful out there!
Footnotes
Subscribe for free to get email notifications of future posts!
“Above the 50” (AT50) uses the percentage of stocks trading above their respective 50-day moving averages (DMAs) to measure breadth in the stock market. Breadth defines the distribution of participation in a rally or sell-off. As a result, AT50 identifies extremes in market sentiment that are likely to reverse. Above the 50 is my alternative name for “MMFI” which is a symbol TradingView.com and other chart vendors use for this breadth indicator. Learn more about AT50 on my Market Breadth Resource Page. AT200, or MMTH, measures the percentage of stocks trading above their respective 200DMAs.
Active AT50 (MMFI) periods: Day #326 over 20%, Day #4 under 30% (underperiod), Day #23 under 40%, Day #35 under 50%, Day #62 under 60%, Day #163 under 70%
Source for charts unless otherwise noted: TradingView.com
Full disclosure: long SPY shares and put spread, long AMZN
FOLLOW Dr. Duru’s commentary on financial markets via StockTwits, BlueSky, and even Instagram!
*Charting notes: Stock prices are not adjusted for dividends. Candlestick charts use hollow bodies: open candles indicate a close higher than the open, filled candles indicate an open higher than the close.
* Blog notes: this blog was written based on the heavily edited transcript of the following video that includes a live review of the stock charts featured in this post. I used ChatGPT to process the transcript.


