Stock Market Commentary
Two weeks ago I wrote how a “A DeepSeek Dive and A Tariff Toll” created the next shift in the market’s technical outlook. I stepped back from a bullish position on the market as a result. Now, a familiar theme has unfolded with the stock market looking ready to leave its latest troubles behind. Even as economic and politic uncertainties pile up, the stock market just steadily and surely absorbs the blows. Like skin thickening against a caustic environment, the stock market is tuning out the noise. The stock market has even nearly overcome the abrupt sell-off from December’s post-Fed disappointment.
The Stock Market Indices
The S&P 500 (SPY) churned the first three days of the week. On Wednesday, the index’s intraday low made a picture-perfect test of support at its 50-day moving average (DMA) (the red line). The buyers took that cue and ran the S&P 500 right to its all-time high on Thursday. The index ended the week teasing another all-time high. I am looking to buy a breakout from here as such price action could launch the next run-up.
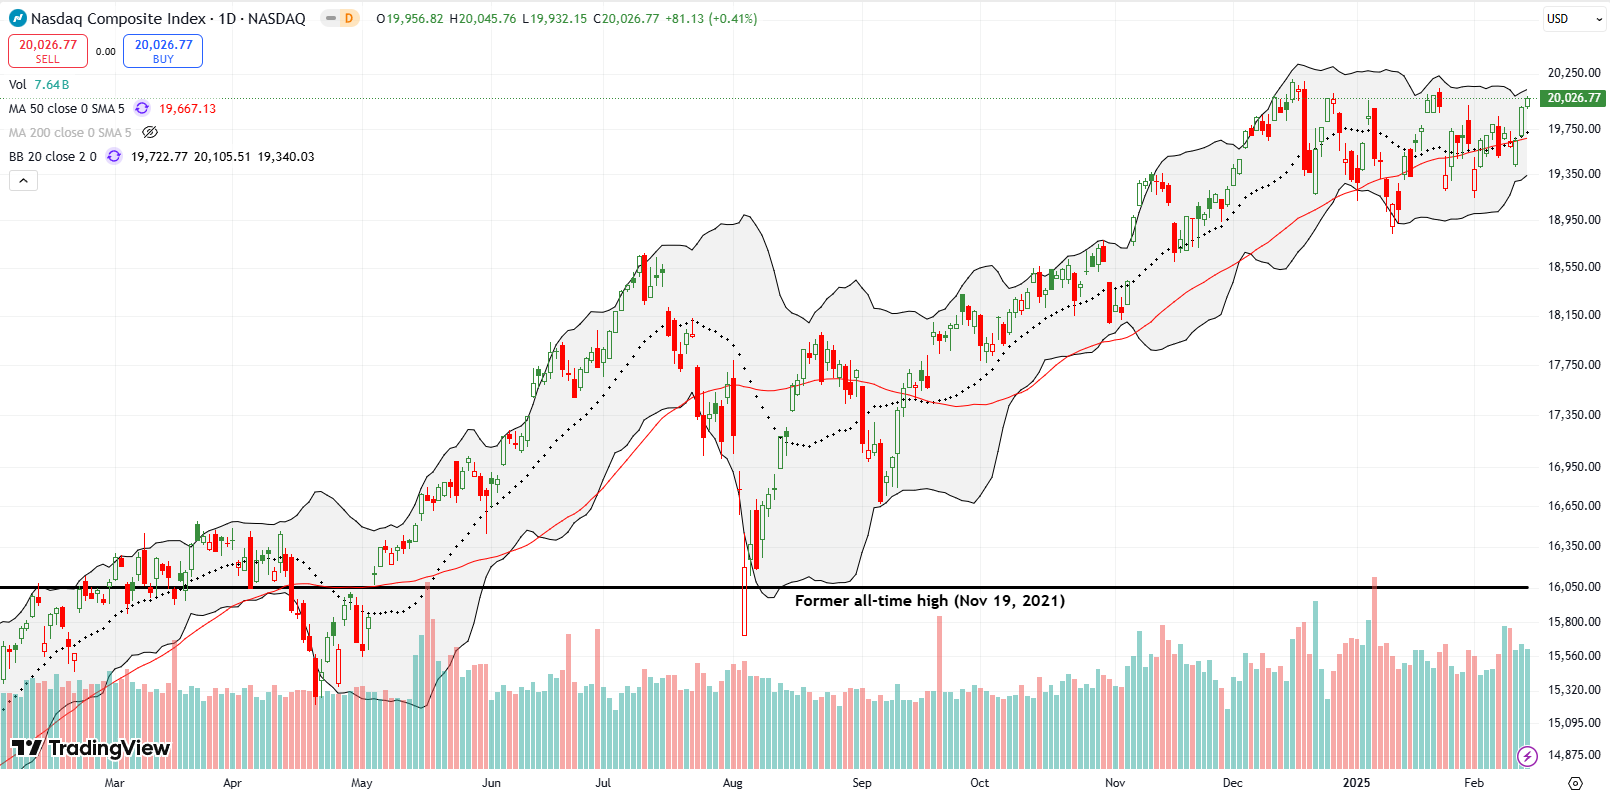
The NASDAQ (COMPQX) is trading more choppily than the S&P 500. Yet, the tech-laden index is holding a neat pivot around its uptrending 50DMA. The NASDAQ ended the week just under its all-time high and an “inch” away from nullifying the bearish topping pattern created by the DeepSeek drama.
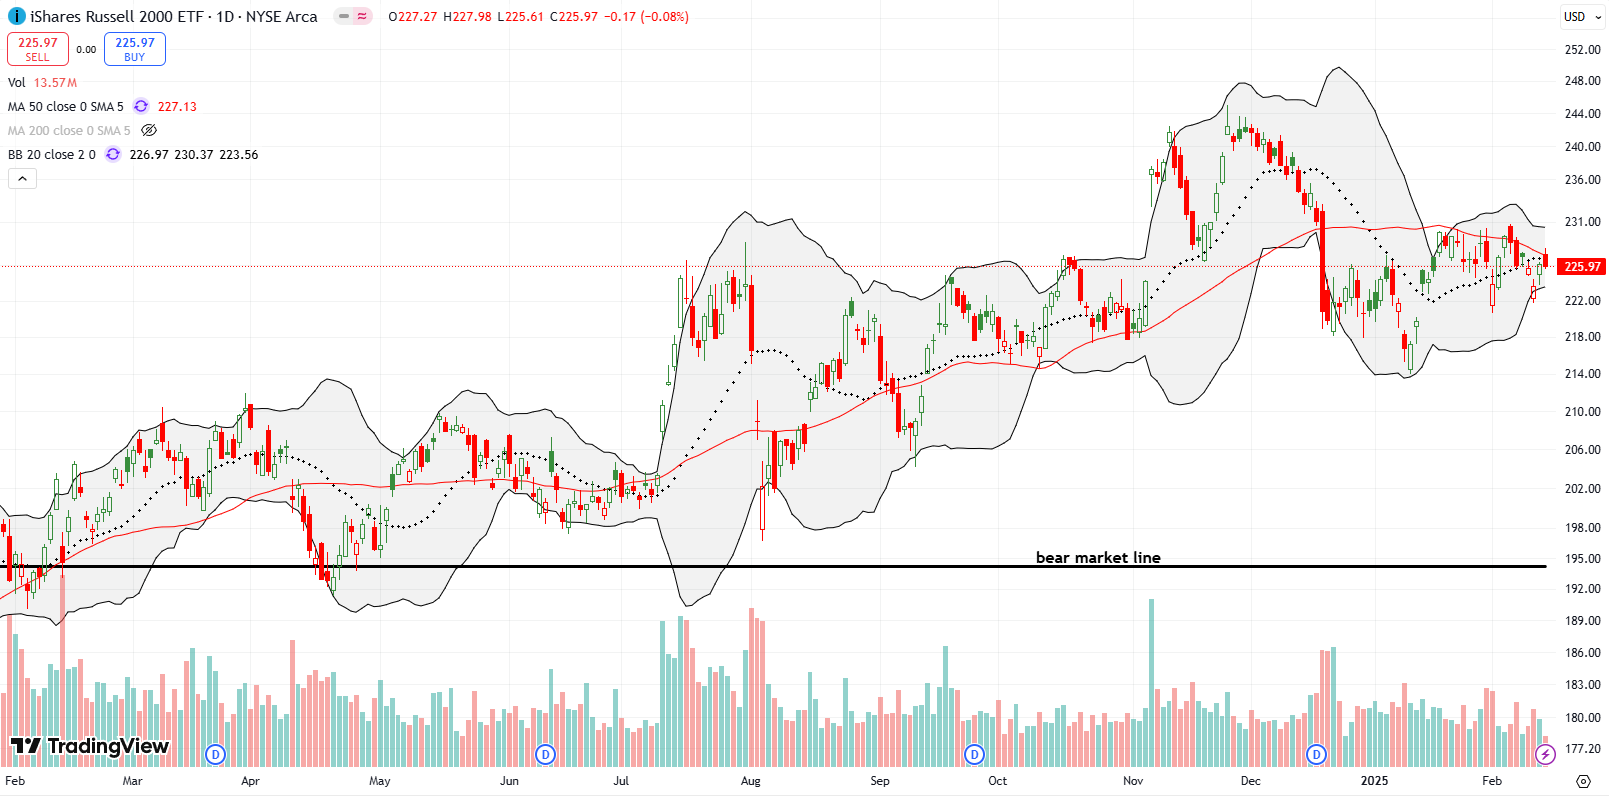
The iShares Russell 2000 ETF (IWM) is churning even more than the NASDAQ. Like the NASDAQ, IWM has yet to recover from its plunge in mid-December after a post-Fed disappointment. However, ominously, IWM’s 50DMA is now turning downward. IWM ended the week failing once again at 50DMA resistance.
I managed to scalp profits on the rangebound trading after buying call options on Wednesday’s dip and selling on Thursday’s rebound.
The Short-Term Trading Call With Troubles Behind
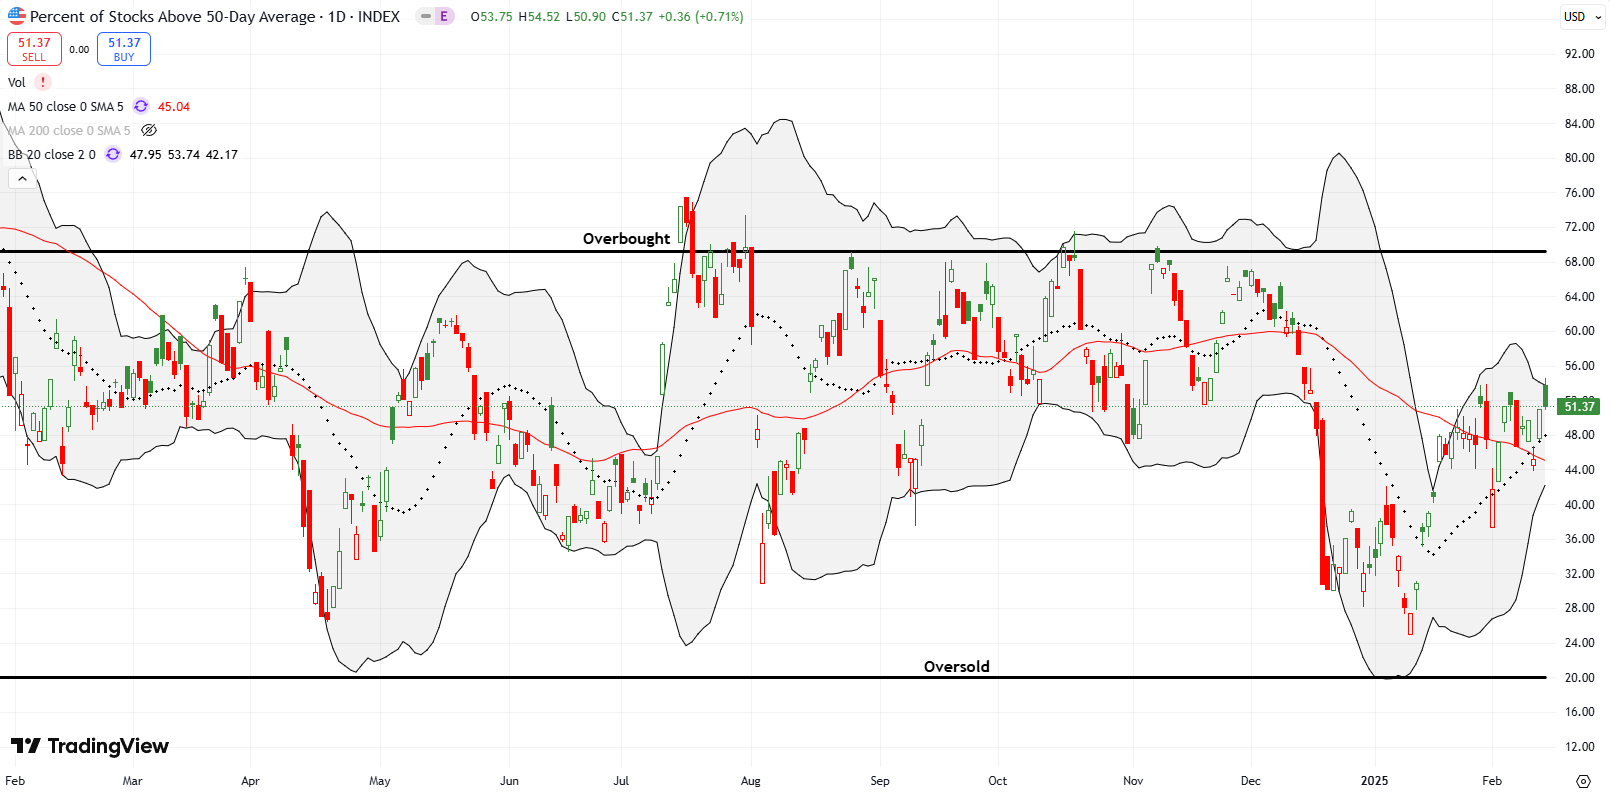
- AT50 (MMFI) = 51.4% of stocks are trading above their respective 50-day moving averages
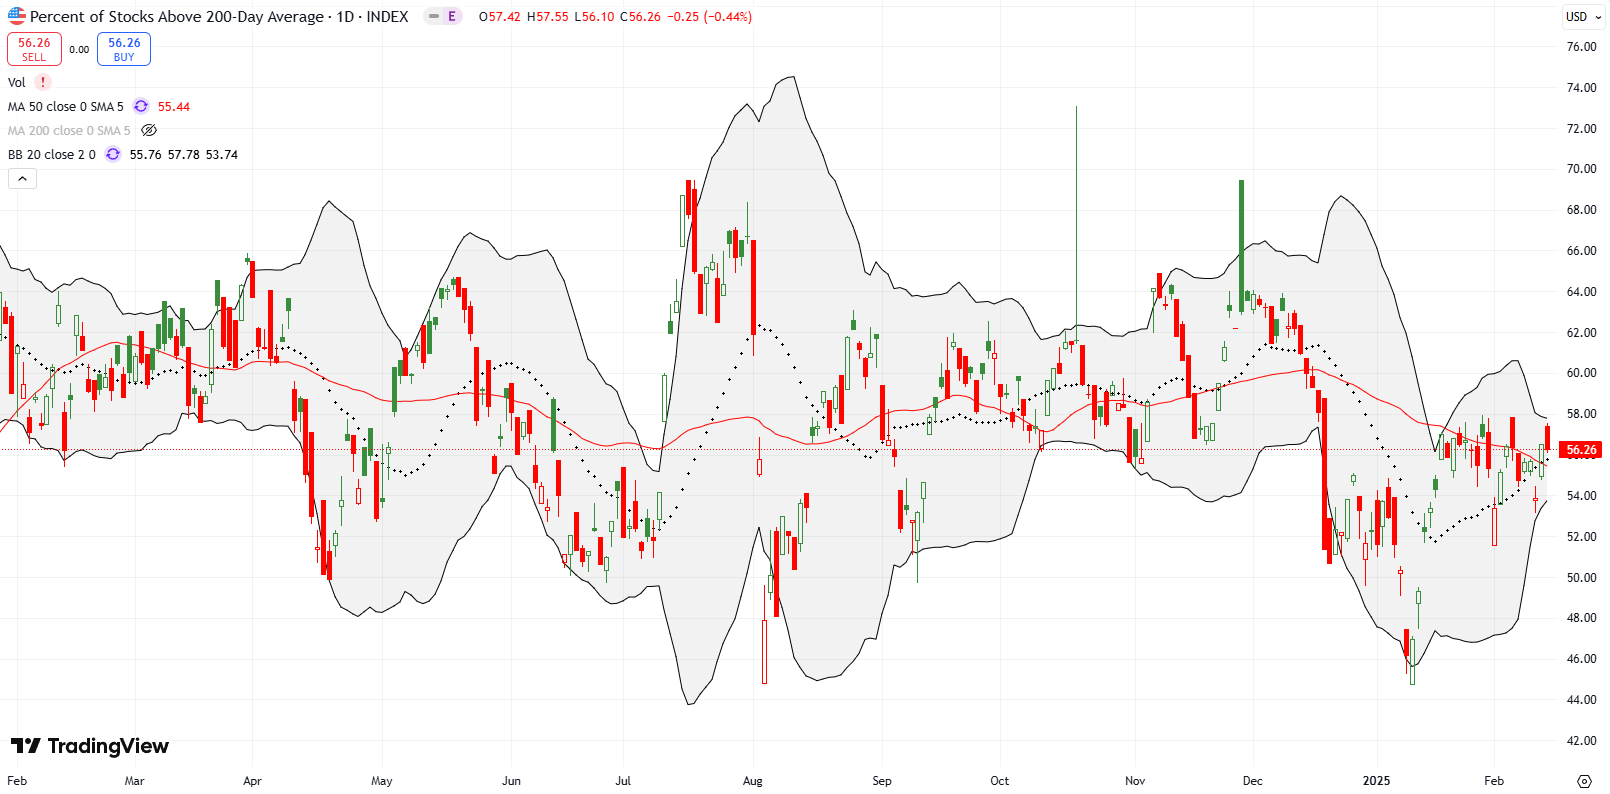
- AT200 (MMTH) = 56.3% of stocks are trading above their respective 200-day moving averages
- Short-term Trading Call: neutral
AT50 (MMFI), the percentage of stocks trading above their respective 50DMAs, closed the week at 51.4%. My favorite technical indicator is yet again at the edge of a breakout. Each of the last three weeks, AT50 has tried and failed to break out. Will this fourth week be the charm? While IWM is not likely to cooperate, the S&P 500 and the NASDAQ look poised to provide the necessary push. Meanwhile, earnings season is well underway and has produced significant winners and losers even as the theme of leaving troubles behind dominates some important trading action.
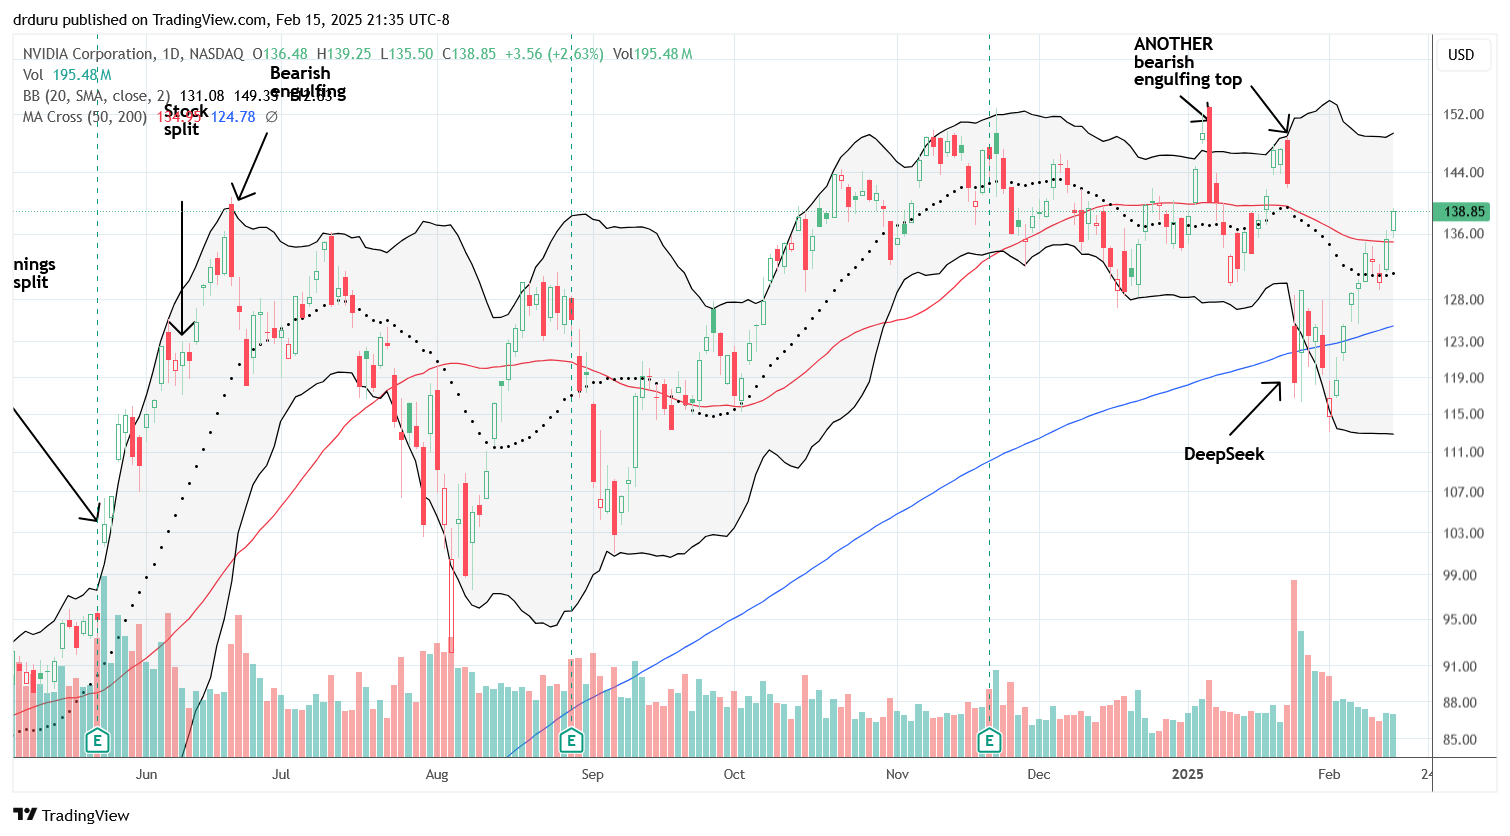
NVIDIA Corporation (NVDA) is leaving its DeepSeek troubles behind. Since the close of that day where NVDA closed below its 200DMA (the blue line) for the first time in over 2 years, NVDA has gained a healthy 17.3%. While NVDA has plenty of work left to invalidate its bearish engulfing topping patterns (and I still contend these tops will hold for months to come), I am impressed by a recovery so rapid that NVDA has confirmed breakouts above its 200DMA and 50DMA.
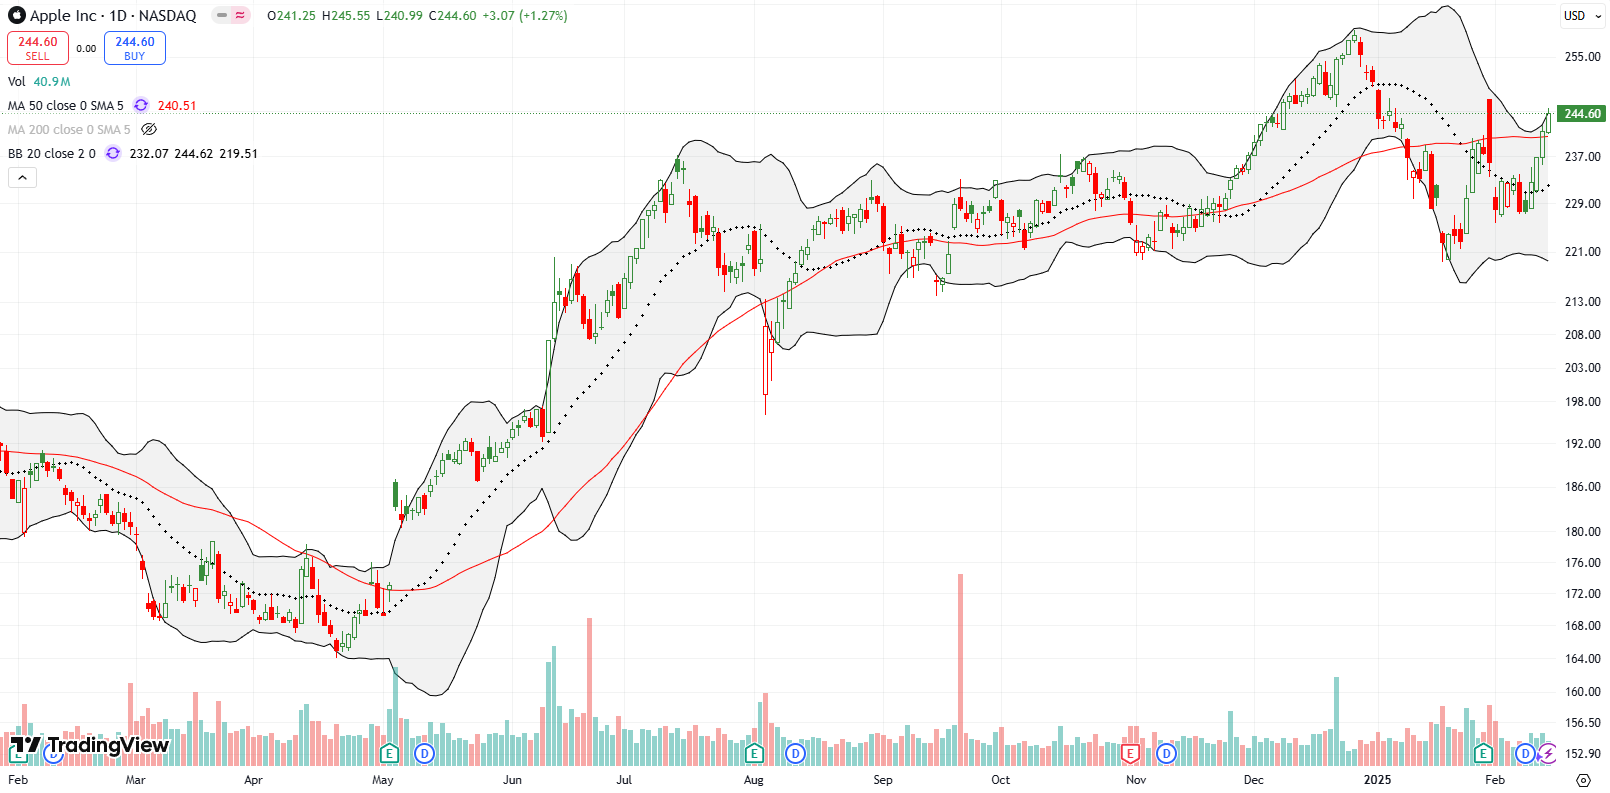
Apple (AAPL) is leaving post-earnings troubles behind. The stock’s post-earnings, bearish engulfing pattern looked ominous with a close below the 50DMA. Sellers only managed one more day of follow-through. From there, AAPL regained its balance and next shot straight up. AAPL closed last week with a confirmed 50DMA breakout. I wanted to buy into the breakout, but I could not get a call option at an acceptable price. I am looking to try again on Tuesday (Monday is the President’s Day holiday).
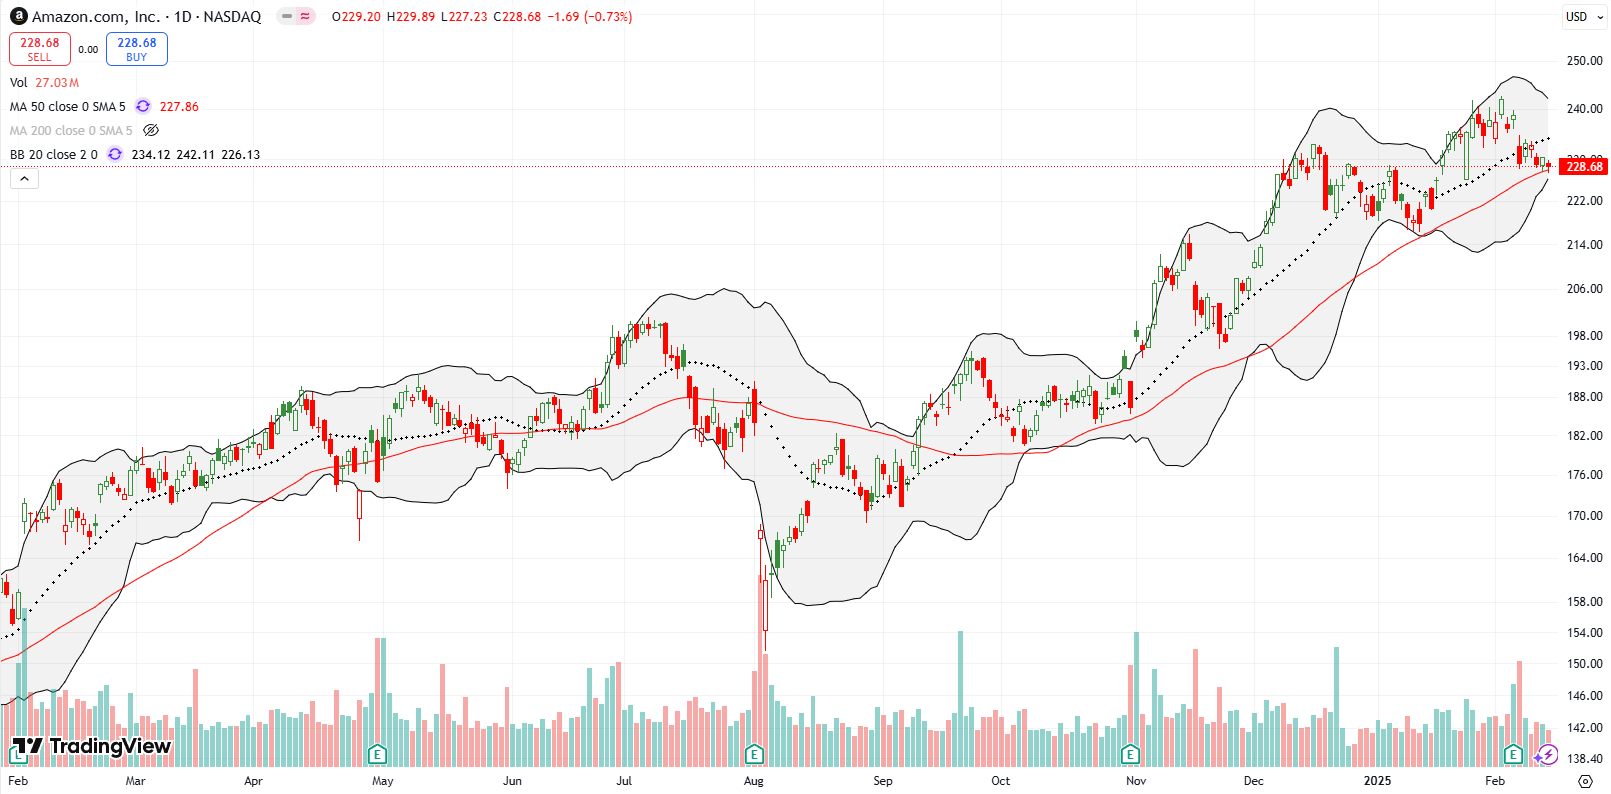
Amazon.com, Inc (AMZN) lost 4.1% post-earnings and slowly drifted lower from there. AMZN closed last week teetering right on top of 50DMA support. I go into this week with the long side of a calendar spread that was a play on an old trading rule to buy AMZN on the first post-earnings day no matter the pricing action. The trade will only succeed with a sharp rebound off 50DMA support.
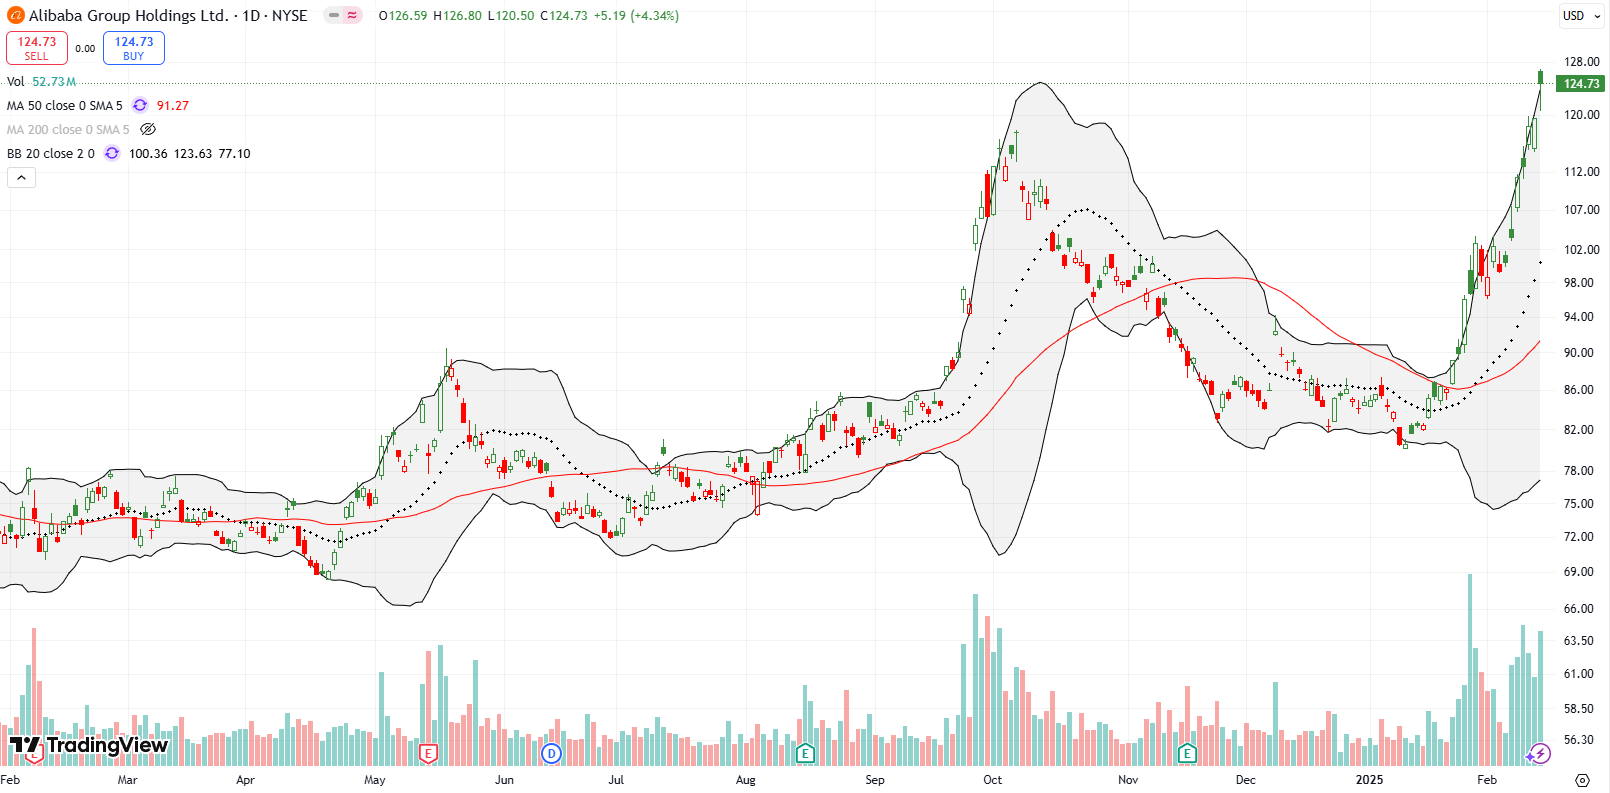
Somehow, I completely missed the entire run-up in Alibaba Group Holdings Ltd (BABA). Ever since BABA’s 50DMA breakout three weeks ago, buyers have piled into the stock to the tune of an astonishing 40.0% gain and a 2-year high. BABA is on its second parabolic move during this time. The stock is truly defying the typical gravity that inevitably brings the fun to an end…like the pullback following September’s parabolic run-up.
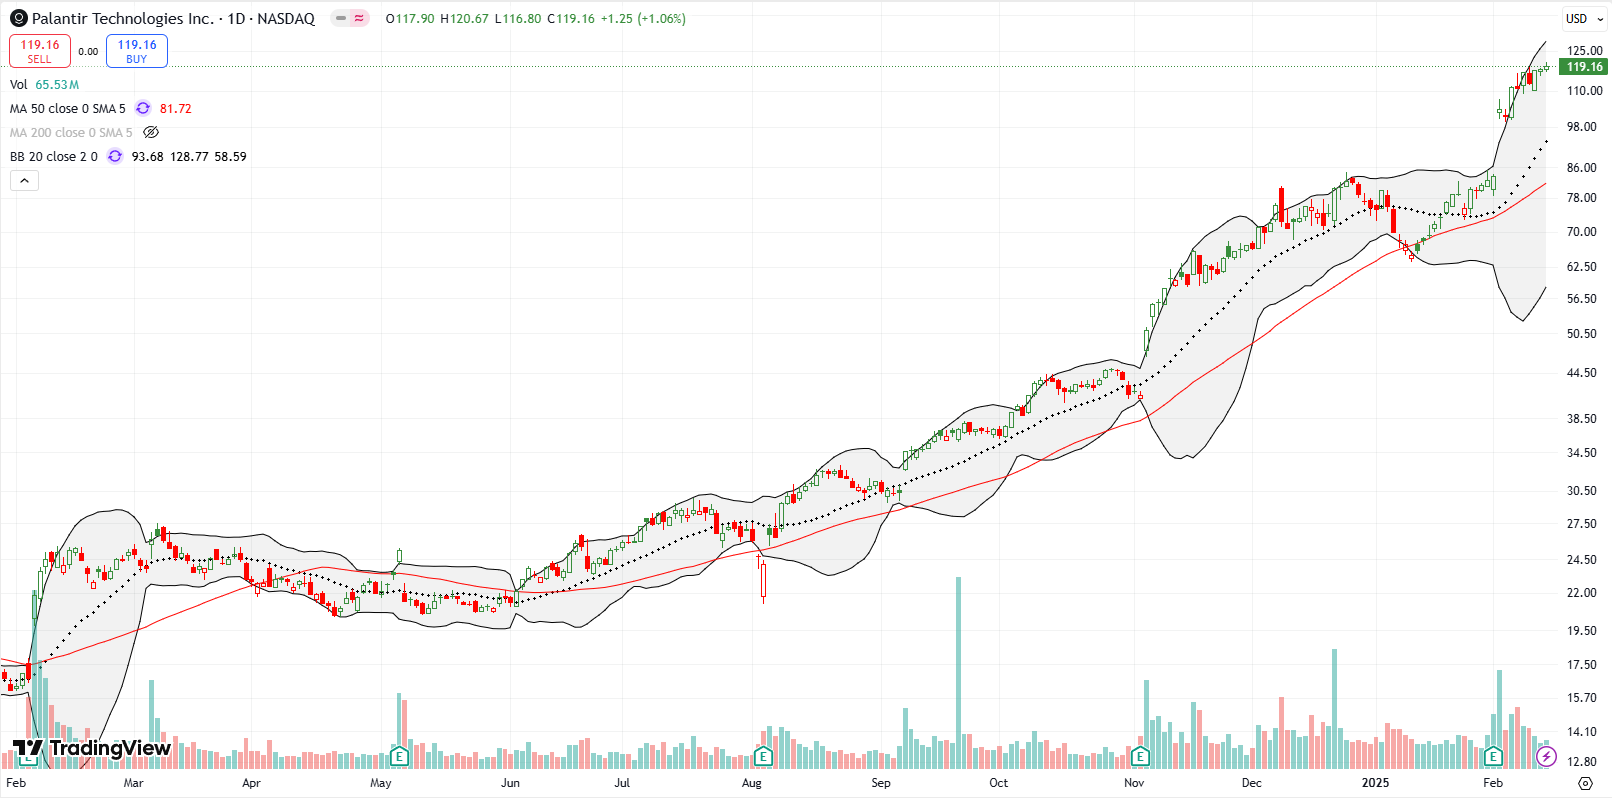
Palantir Technologies Inc (PLTR) builds and deploys software platforms for the intelligence community to assist in counterterrorism investigations and operations. The stock took off last summer and seems unconcerned with any potential cuts int he Federal government’s budget. In the latest episode of price runs, PLTR continues to push higher after an earlier 24% post-earnings surge. The chart below says it all. The valuation also speaks volumes: forward price/sales of 72, forward price/earnings of 385, and forward price/book of 42. I do not how folks keep justifying buying the stock….but they are!
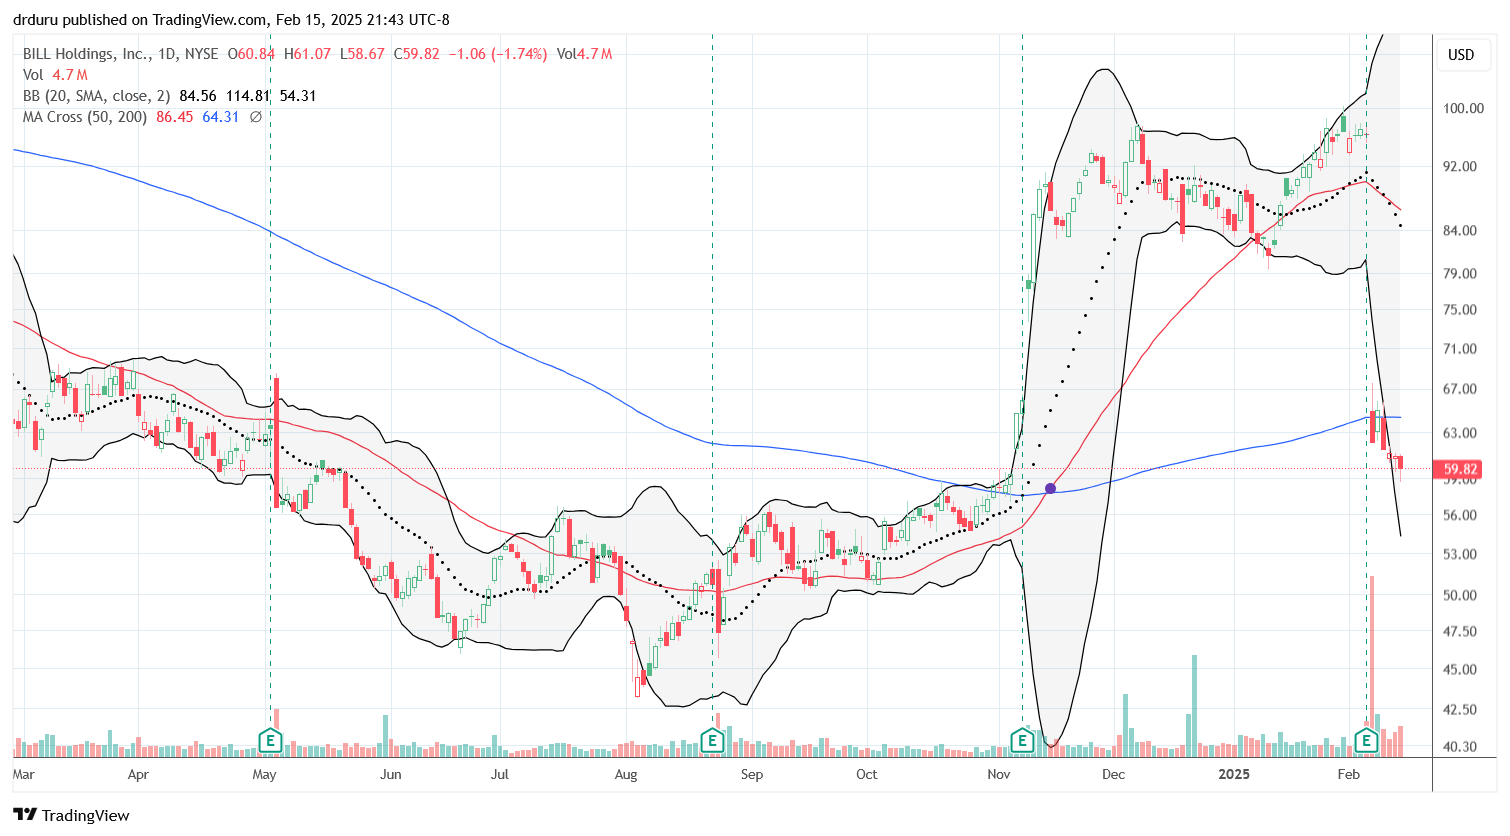
Paycheck management company BILL Holdings, Inc (BILL) is one bizarre company and stock. Just one quarter after achieving lift-off with a 17.3% post-earnings surge, BILL plunged 25.5% post-earnings last week. The stock sliced right through 200DMA support, turned the trendline into confirmed resistance, and gave back all its gains since the last 200DMA breakout. I have now gone from lamenting missing BILL’s turnaround to wondering whether to completely leave this stock alone. At a minimum, BILL is a no-touch until it closes above its 200DMA again.
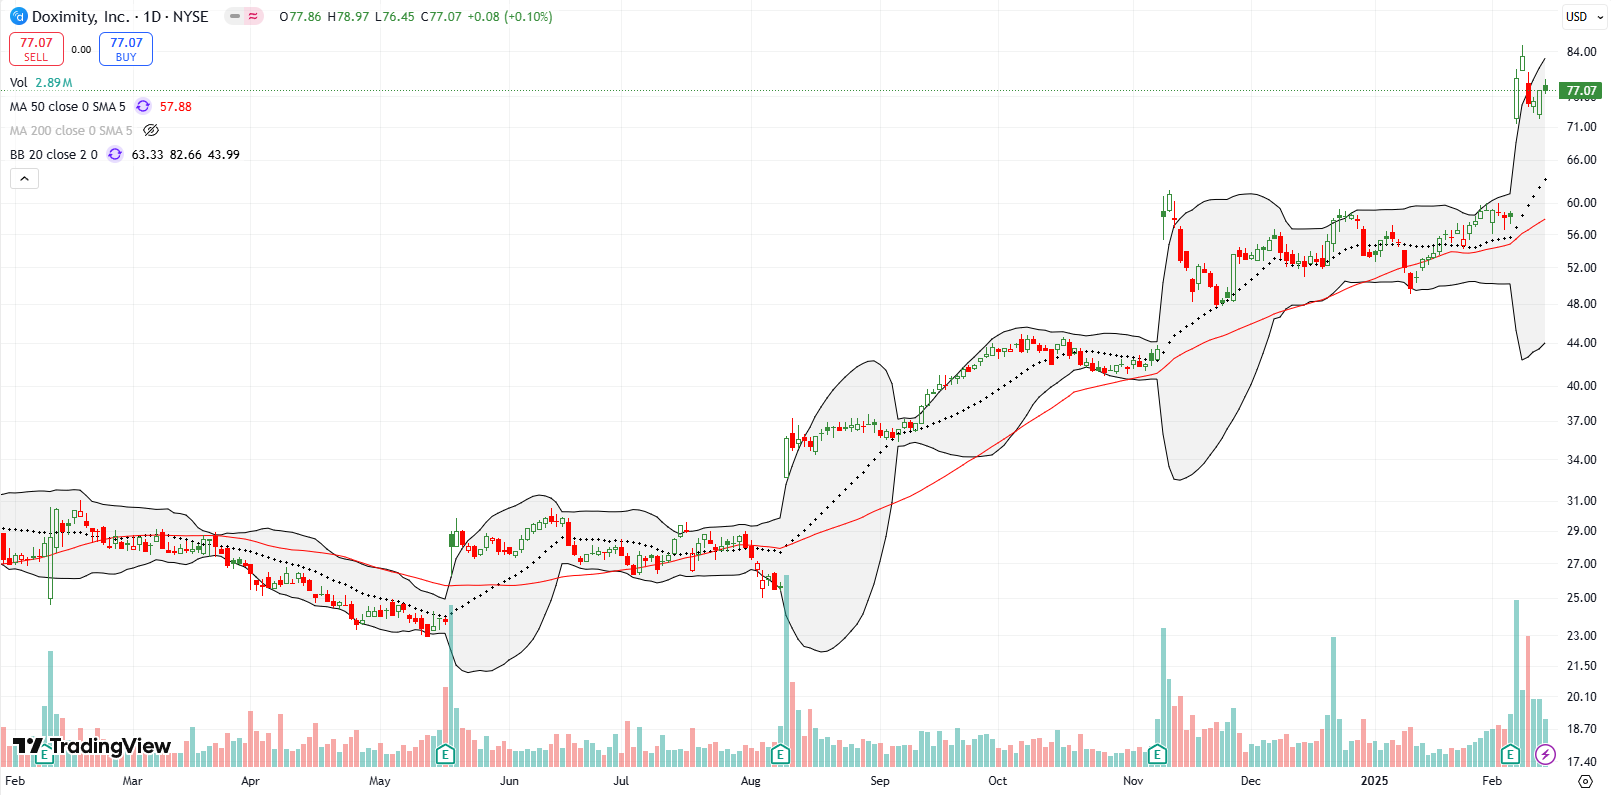
Doximity, Inc (DOCS) operates a cloud-based digital platform for medical professionals. I have not tracked the stock until now. The stock flared out quickly after its IPO three years ago and sold off from there. DOCS hit an all-time low around $20 in late 2023. DOCS’s fortunes truly turned around after earnings last May. After that 18.1% surge, DOCS has basically been on one post-earnings leapfrog after another. Last week’s 36.0% post-earnings surge took the stock to a near 3 1/2 year high.
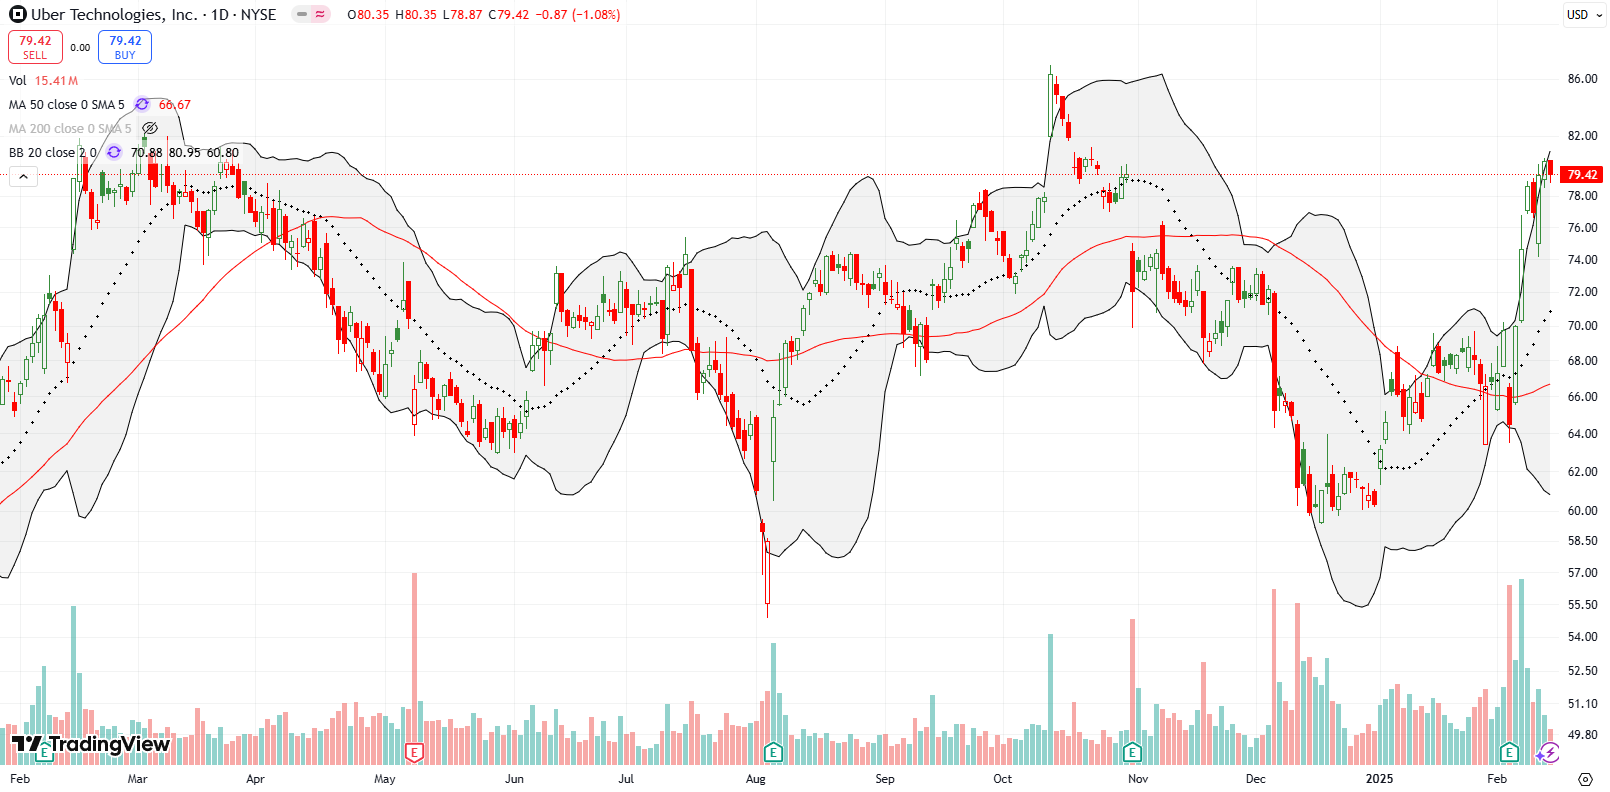
Uber Technologies, Inc (UBER) cannot make up its mind. The stock has traded in a wide range for over a year. The last peak came on the heels of a 10.8% surge after Tesla (TSLA) scored a dud with its robotaxi announcement. UBER failed to sustain the excited relief and sold off quickly from there to the bottom of its range. The last price action featured a flip-flop around earnings and a subsequent push straight up. With UBER trading short of the top of the trading range, I am looking for an opportunity to get bearish even with Bill Ackman accumulating shares since January.
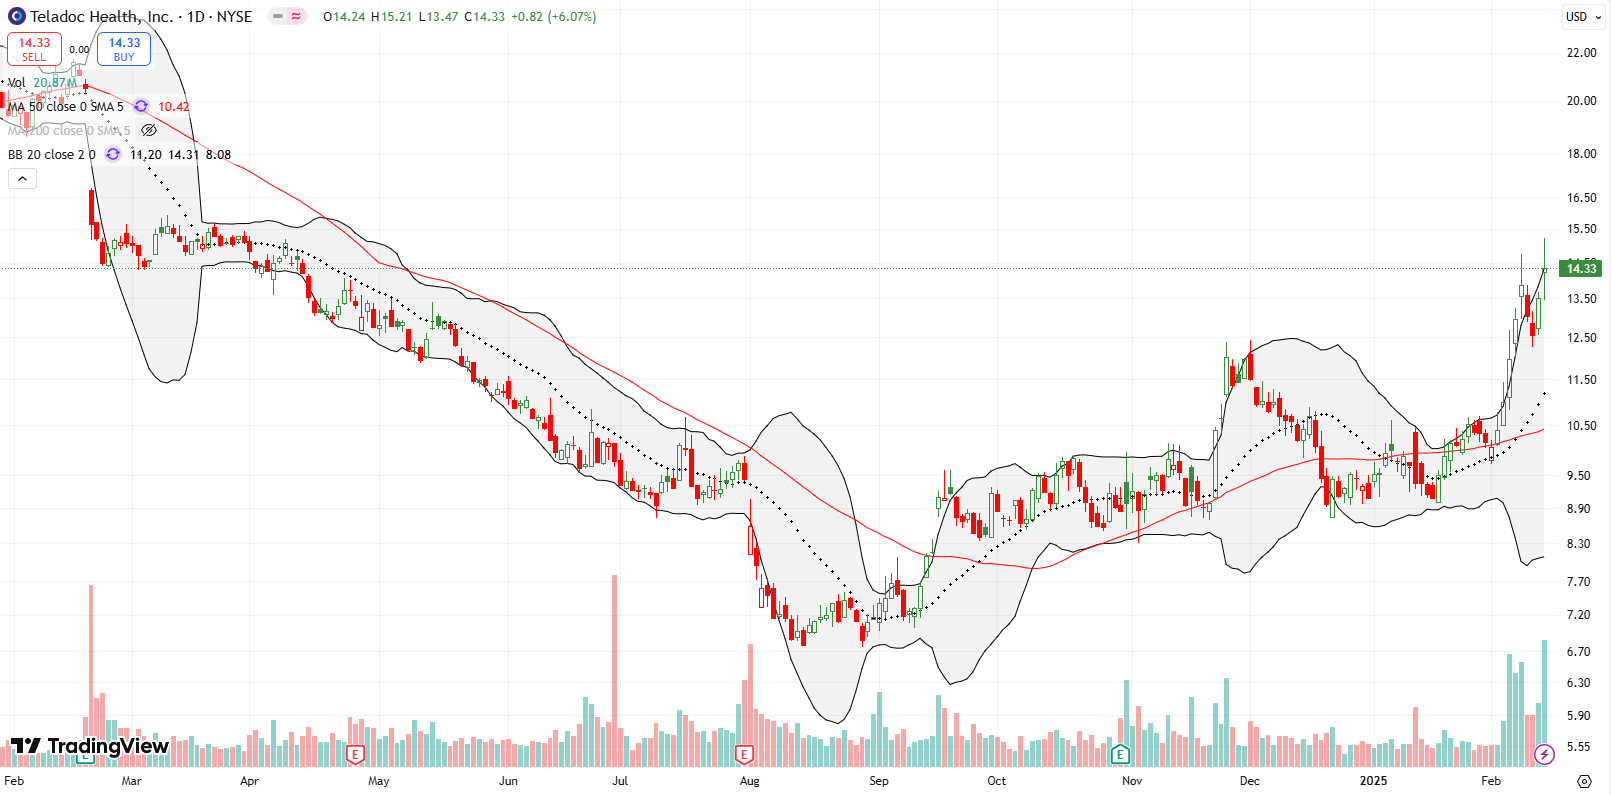
I gave up on telehealth company Teledoc Health, Inc (TDOC) a year ago. Now TDOC looks like it is leaving troubles behind with a bearish to bullish reversal. TDOC held 20DMA (dotted line) and 50DMA support and shot straight up to a 10-month high. TDOC’s acquisition of another software company seems to be the only public news. On the technical side, I now want to buy the dips. I already missed a shallow one last week.
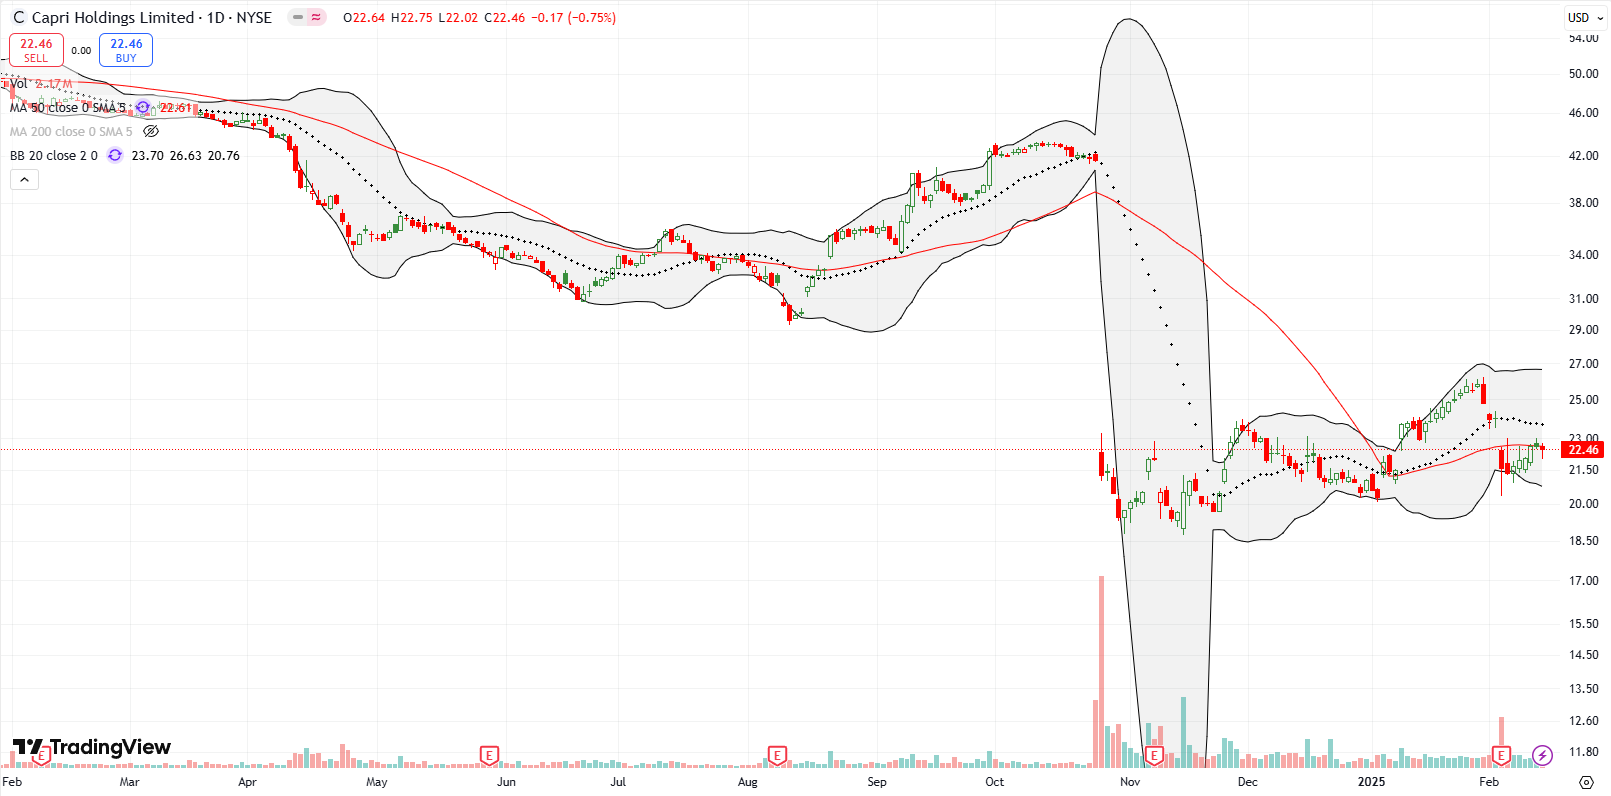
A month ago, I braced for losing my holding in luxury retailer Capri Holdings Limited (CPRI) to being called away. Instead, the short call quickly withered to zero. I promptly sold another weekly call. My CPRI position was called away THAT week. Good thing. CPRI fell 10.1% post-earnings on February 5th. Last week CPRI struggled with 50DMA resistance. I decided to move on from this contrarian play as there are so many other better trades out there.
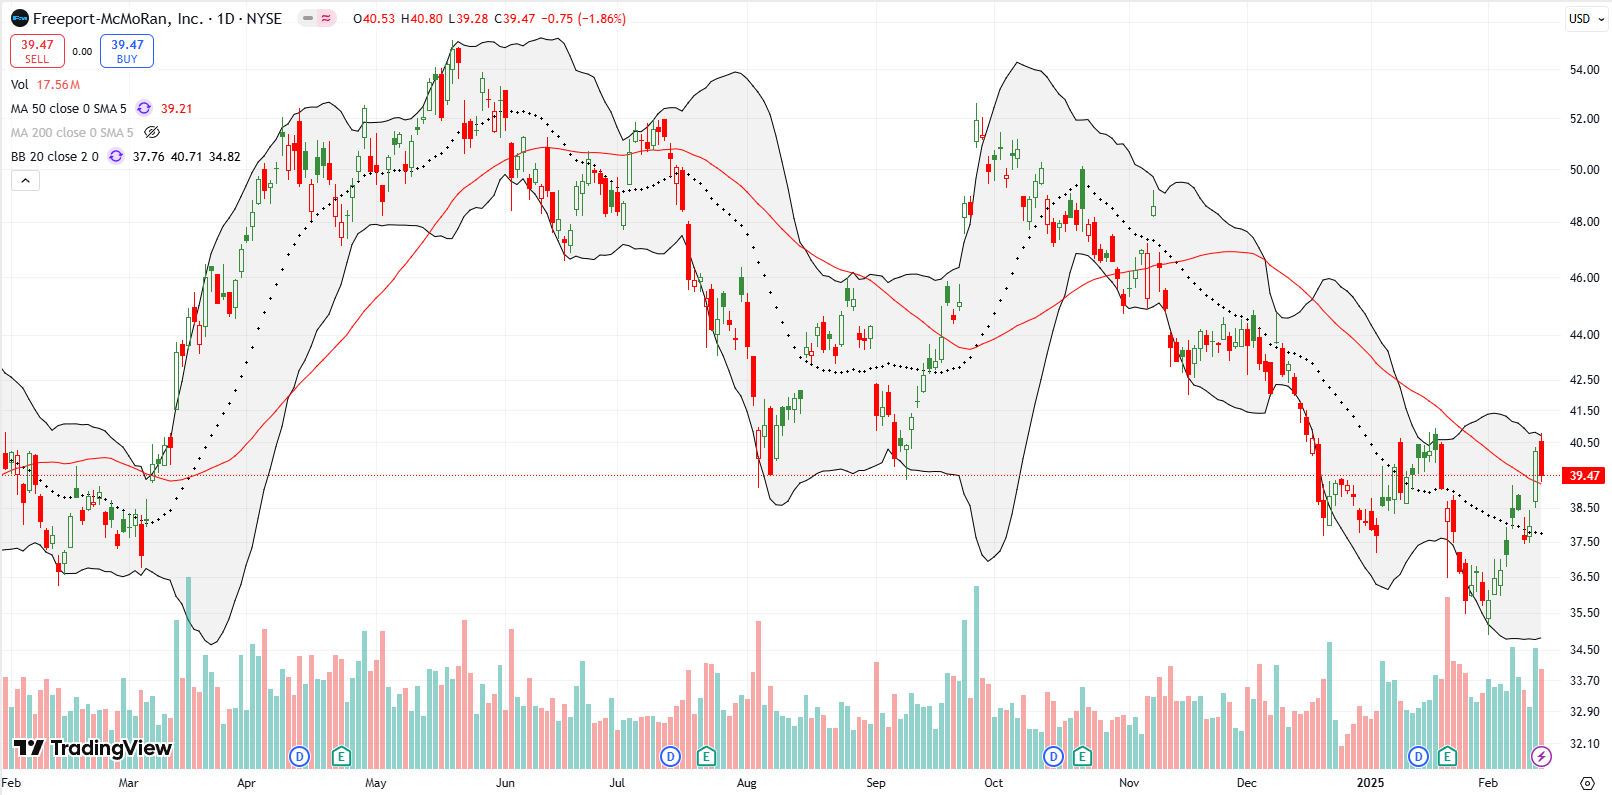
Copper miner Freeport-McMoRan, Inc (FCX) slid down a downtrend starting from late September. Last week, FCX tried to leave those troubles behind with a 50DMA breakout. The next day, sellers prevented a confirmation. I am on alert to load up on FCX as soon as the stock confirms a 50DMA breakout with a higher close.
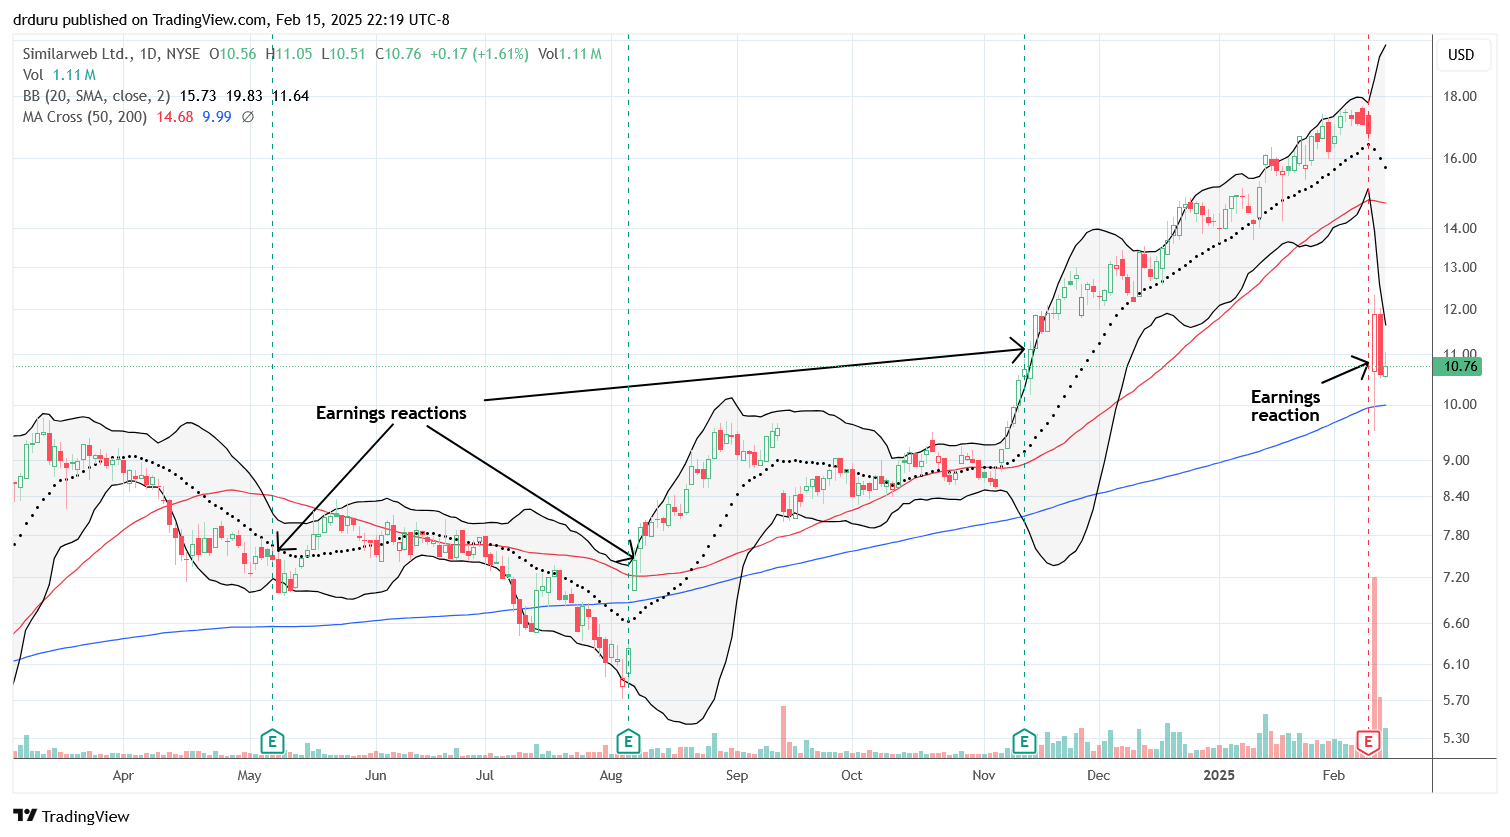
Digital Intelligence software company Similarweb Ltd (SWMB) plunged 29% post-earnings. I cannot understand the panic based on the financial results by themselves. My best guess is that SMWB got way ahead of reality with the 59% run-up from the November earnings report to the last one. SMWB made it to a 3-year high before the plunge. Given the jump off 200DMA support, I bought some shares. Note that I rated SMWB a buy after August earnings.
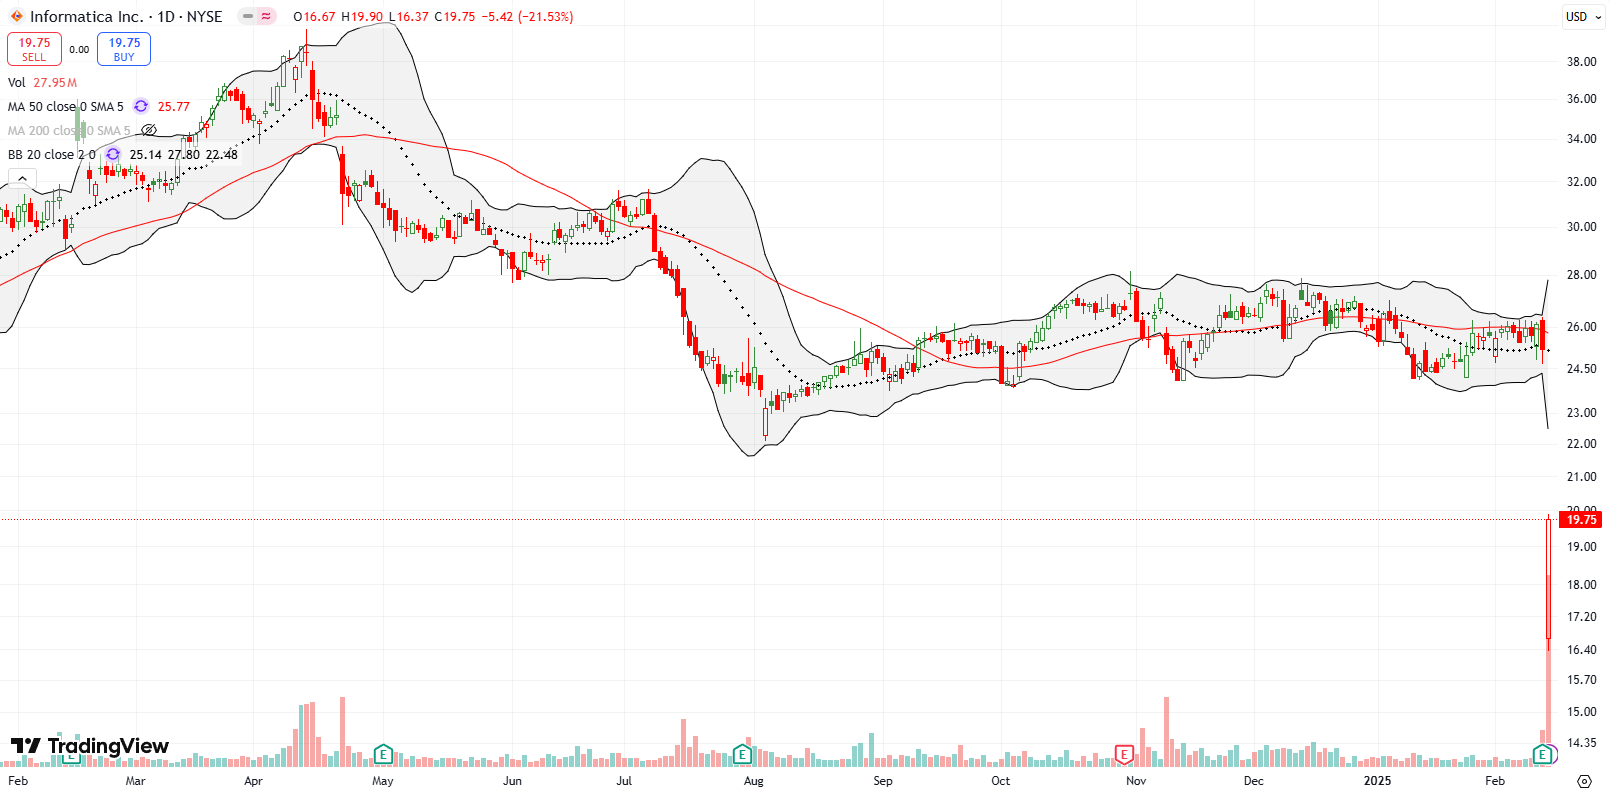
My dedication to Informatica Inc (INFA) failed in spectacular fashion last week. The stock fell post-earnings as much as 35.0% before rebounding for a 24.1% loss. Near a 2-year low, INFA looks like a dead stock. I had high hopes after the stock stabilized following August earnings.
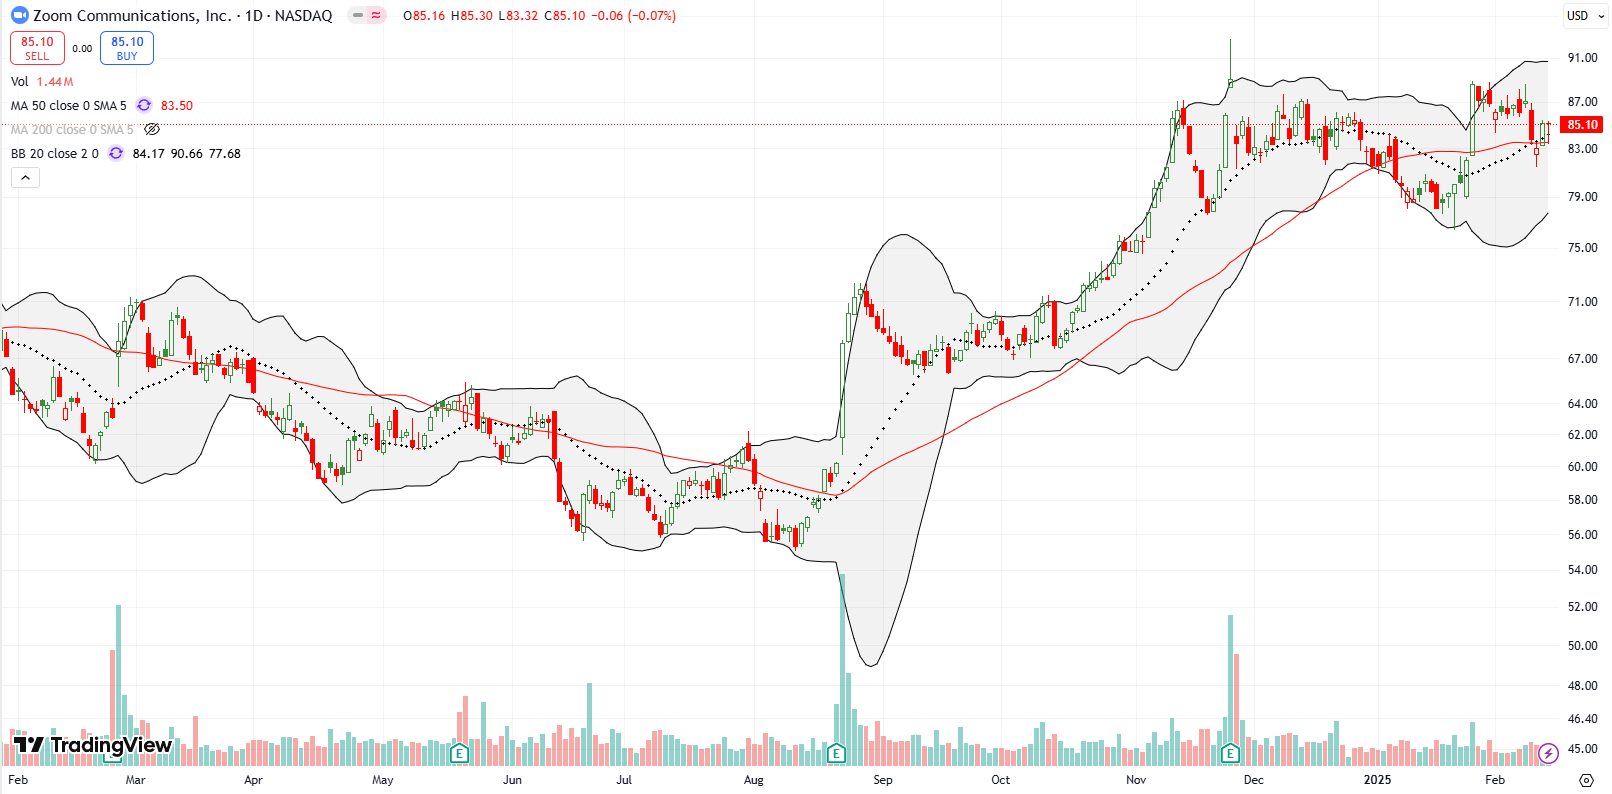
Speaking of high hopes, I thought Zoom Communications, Inc (ZM) was on its way to a fresh breakout after a 50DMA breakout on an 8.1% surge (on no news that I could find). I jumped into a call spread only to watch the momentum come to an abrupt halt. Last week ZM struggled to hold 20DMA and 50DMA support. As it stands, ZM looks like it failed at resistance from its post-earnings topping pattern in November.
Be careful out there!
Footnotes
Subscribe for free to get email notifications of future posts!
“Above the 50” (AT50) uses the percentage of stocks trading above their respective 50-day moving averages (DMAs) to measure breadth in the stock market. Breadth defines the distribution of participation in a rally or sell-off. As a result, AT50 identifies extremes in market sentiment that are likely to reverse. Above the 50 is my alternative name for “MMFI” which is a symbol TradingView.com and other chart vendors use for this breadth indicator. Learn more about AT50 on my Market Breadth Resource Page. AT200, or MMTH, measures the percentage of stocks trading above their respective 200DMAs.
Active AT50 (MMFI) periods: Day #293 over 20%, Day #14 over 30%, Day #20 over 40%, Day #2 over 50% (overperiod), Day #30 under 60% (underperiod), Day #131 under 70%
Source for charts unless otherwise noted: TradingView.com
Full disclosure: long SPY put spread, long IWM, long CAT put, long XLF calls
FOLLOW Dr. Duru’s commentary on financial markets via StockTwits, BlueSky, and even Instagram!
*Charting notes: Stock prices are not adjusted for dividends. Candlestick charts use hollow bodies: open candles indicate a close higher than the open, filled candles indicate an open higher than the close.


