Stock Market Commentary
In announcing the official end of monetary tightening, Federal Reserve Chair Jerome Powell mentioned some form of the word “recalibration” nine times from his introductory statement to the Q&A portion of the press conference. Specifically, “….it’s a process of recalibrating our policy stance away from where we had it a year ago, when inflation was high and unemployment low, to a place that’s more appropriate given where we are now and where we expect to be.” This moment of looser policy is also recalibration time for bulls and bears. The bulls cannot count on looming economic weakness to scare the Fed into a steep rate cut cycle. However, bears betting against the stock market are now going up against a firm economy and lower rates. Absent a new macroeconomic shock, momentum will continue to favor the bulls.
The Fed has a strong forecast for the economy, including a peak unemployment rate of 4.4%, core PCE inflation drifting to the 2.0% target in two years, and a steady 2.0% GDP growth rate. These expectations suggest that the Fed is in no hurry to keep pushing rates down. Indeed, the median rate expectation drifts from the new range of 4-3/4 to 5% to 3% in 2 years. The recalibration driven from a forecast of a strong economy and lower rates showed in the tug and pull on the indices in the immediate aftermath of the 50 basis point rate cut. More on this dynamic later.
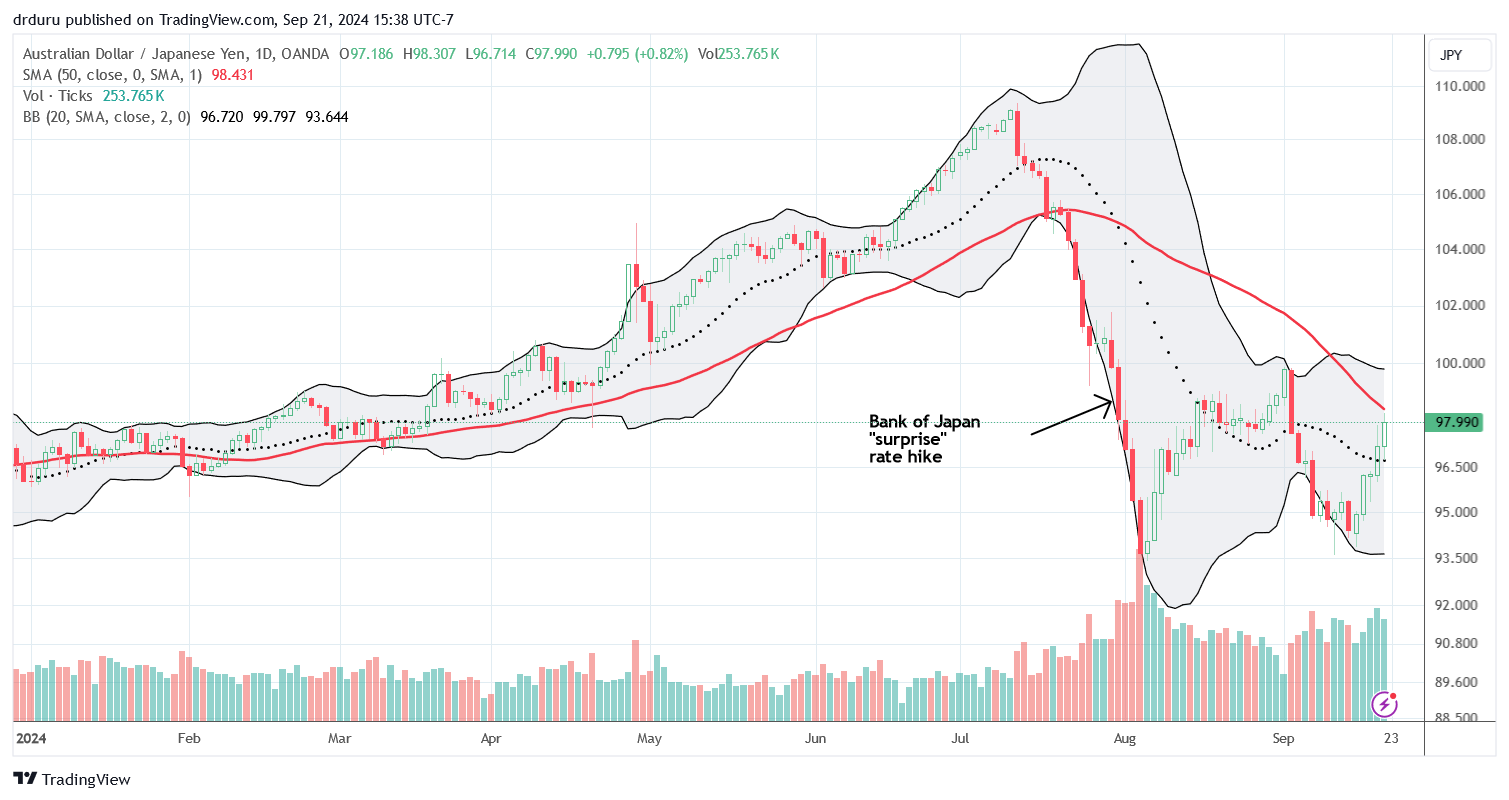
In the meantime, the Bank of Japan cooperated with the bulls by holding still on its interest rate on Thursday night (Eastern time). The yen weakened all week and further supported the upward bias in the markets. Traders need to continue monitoring the currency market, the Australian dollar versus the Japanese yen in particular, given the return of inverse correlations between stocks and the yen. AUD/JPY rallied straight into resistance at a downtrending 50-day moving average (DMA). Thus, financial markets face an immediate test of resolve going into this extended post-Fed period. The market now must feed on Fedspeak through all of October, the last of the stock market’s three most dangerous months of the year.
The Stock Market Indices
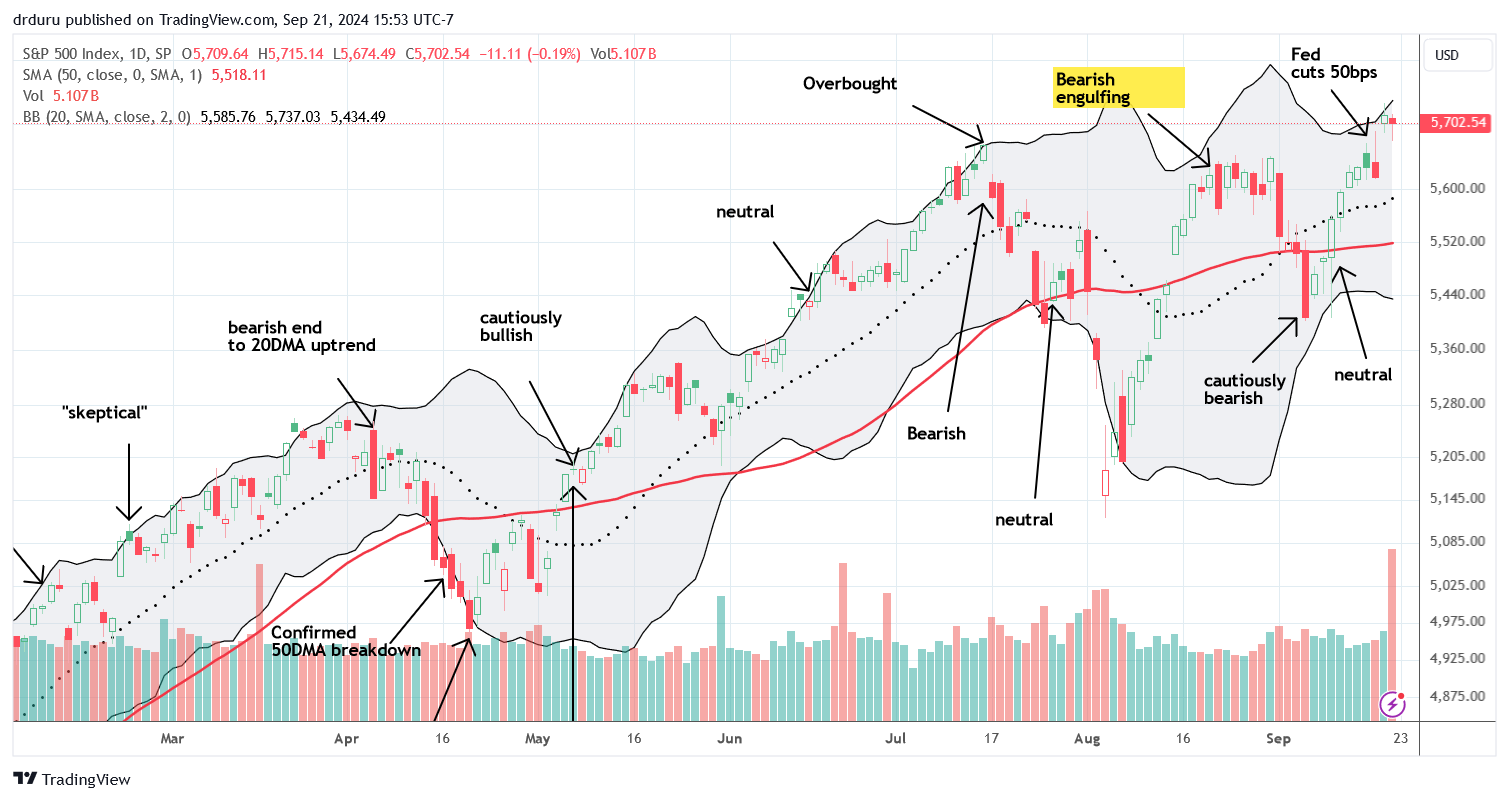
The S&P 500 (SPY) forced the issue of recalibration by first fading in response to the Fed’s rate cut. The index jumped to a new intraday all-time high and then promptly fell to a 0.3% loss. The move had the look of a potential blow-off top timed for maximum, highly anticipated good news. However, buyers got some sleep, reconsidered their hesitation, found some cash in couch cushions, and gapped the market higher Thursday morning. The S&P 500 closed at an all-time high and fought back a fresh fade attempt on Friday. The chart below shows the vacillations in my short-term trading calls.
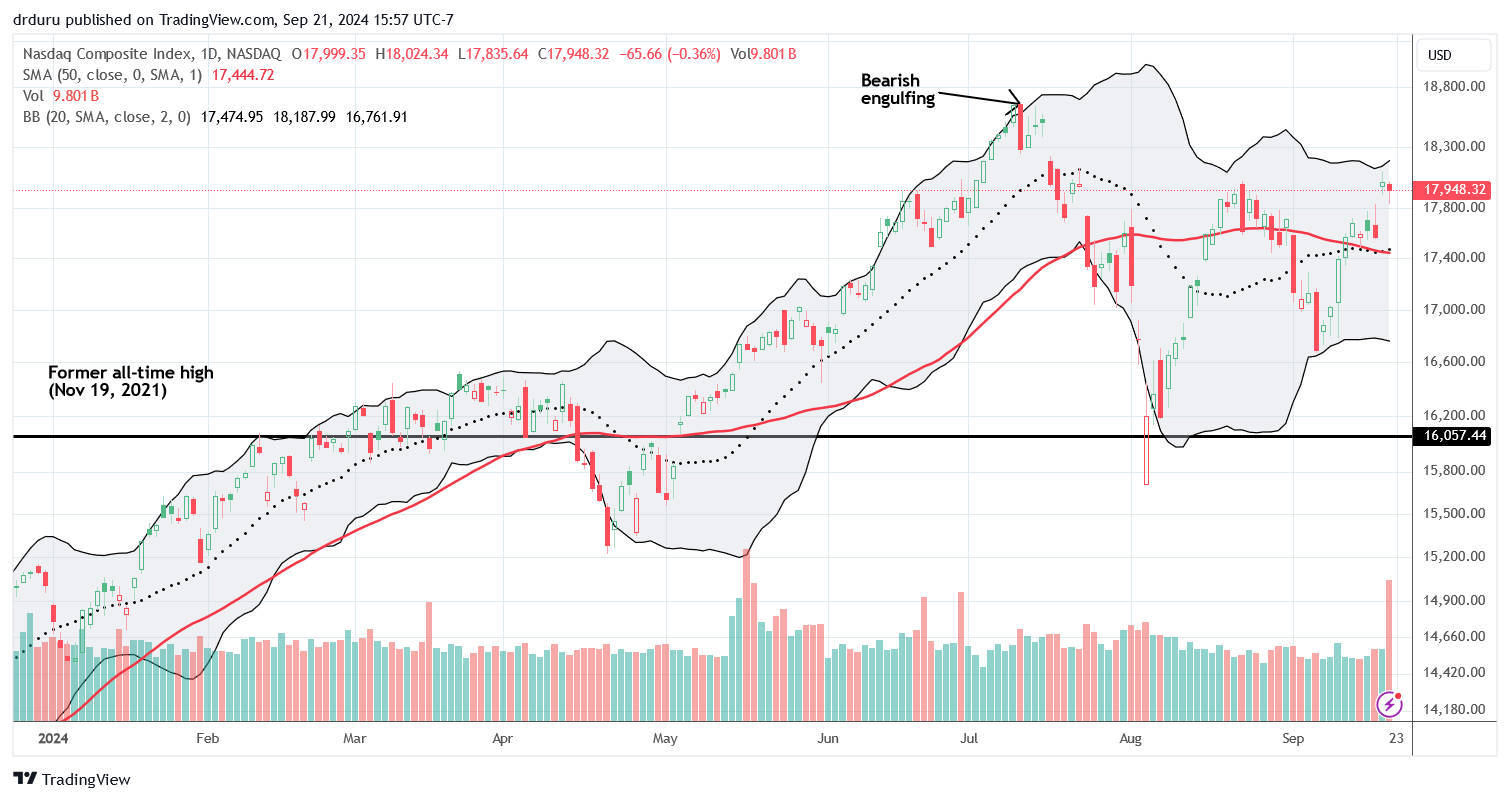
The NASDAQ (COMPQ) also hurdled its last high. However, the tech-laden index continues to trade under the shadow of its bearish engulfing topping pattern from July. I expect that all-time high to become a major battle point if the current rally continues higher.
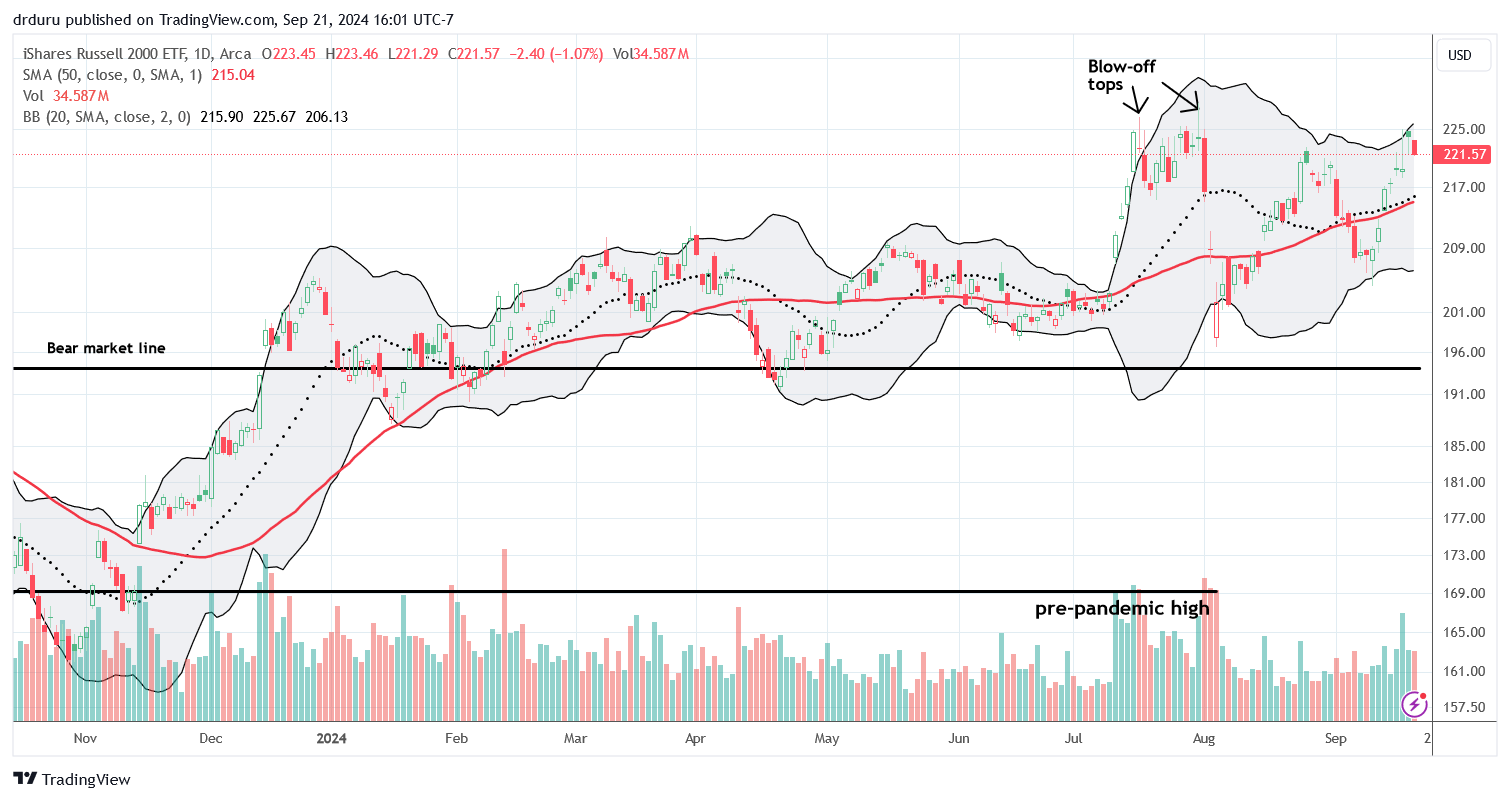
The iShares Russell 2000 ETF (IWM) also hurdled over its last high. However, its underperforming 1.1% pullback on Friday looks a little ominous. The ETF of small caps essentially failed at resistance from the blow-off tops in July. Thus, buyers need to step up immediately to stave off a retest of 50DMA support.
The Short-Term Trading Call With Recalibration
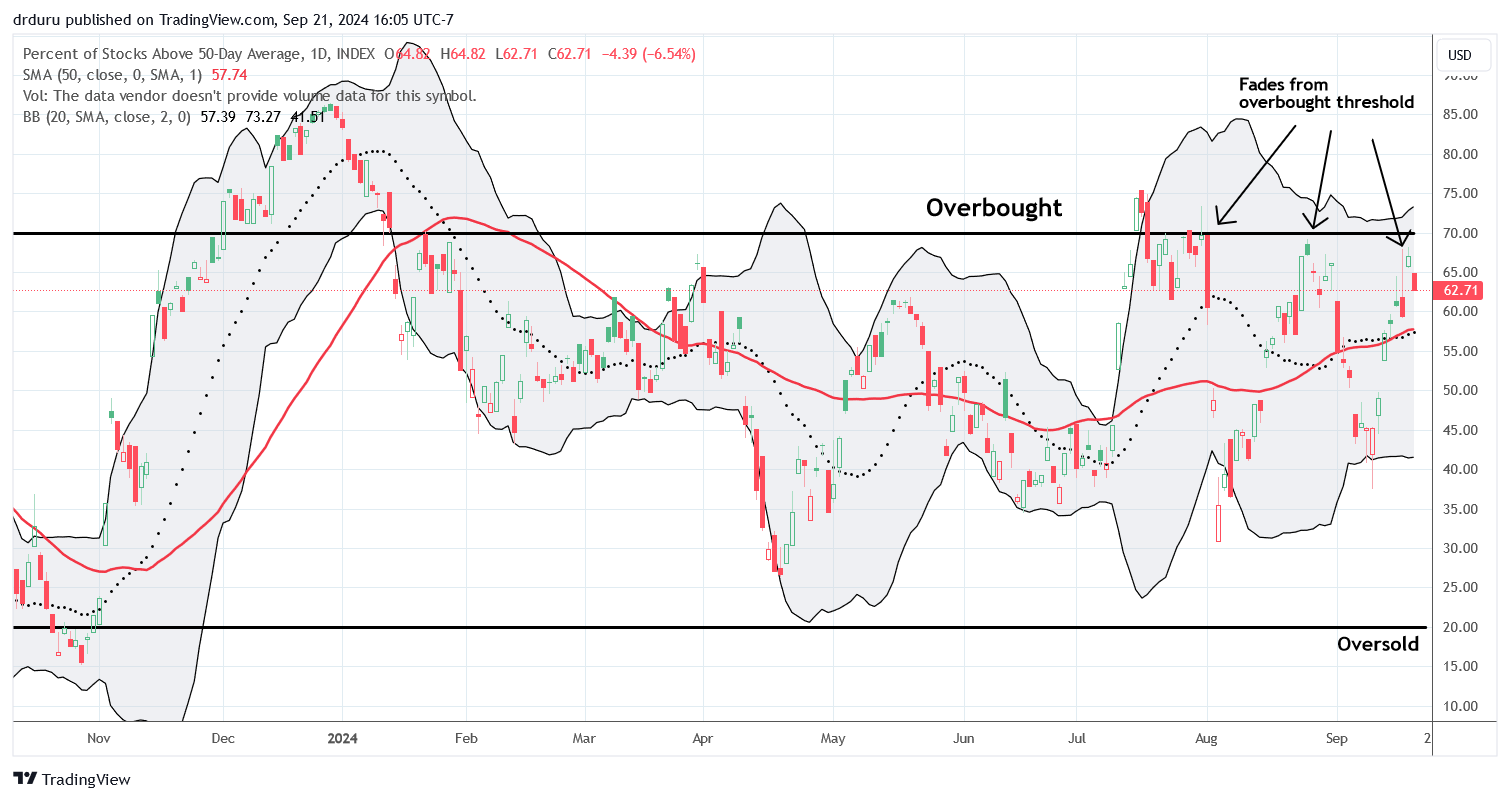
- AT50 (MMFI) = 62.7% of stocks are trading above their respective 50-day moving averages
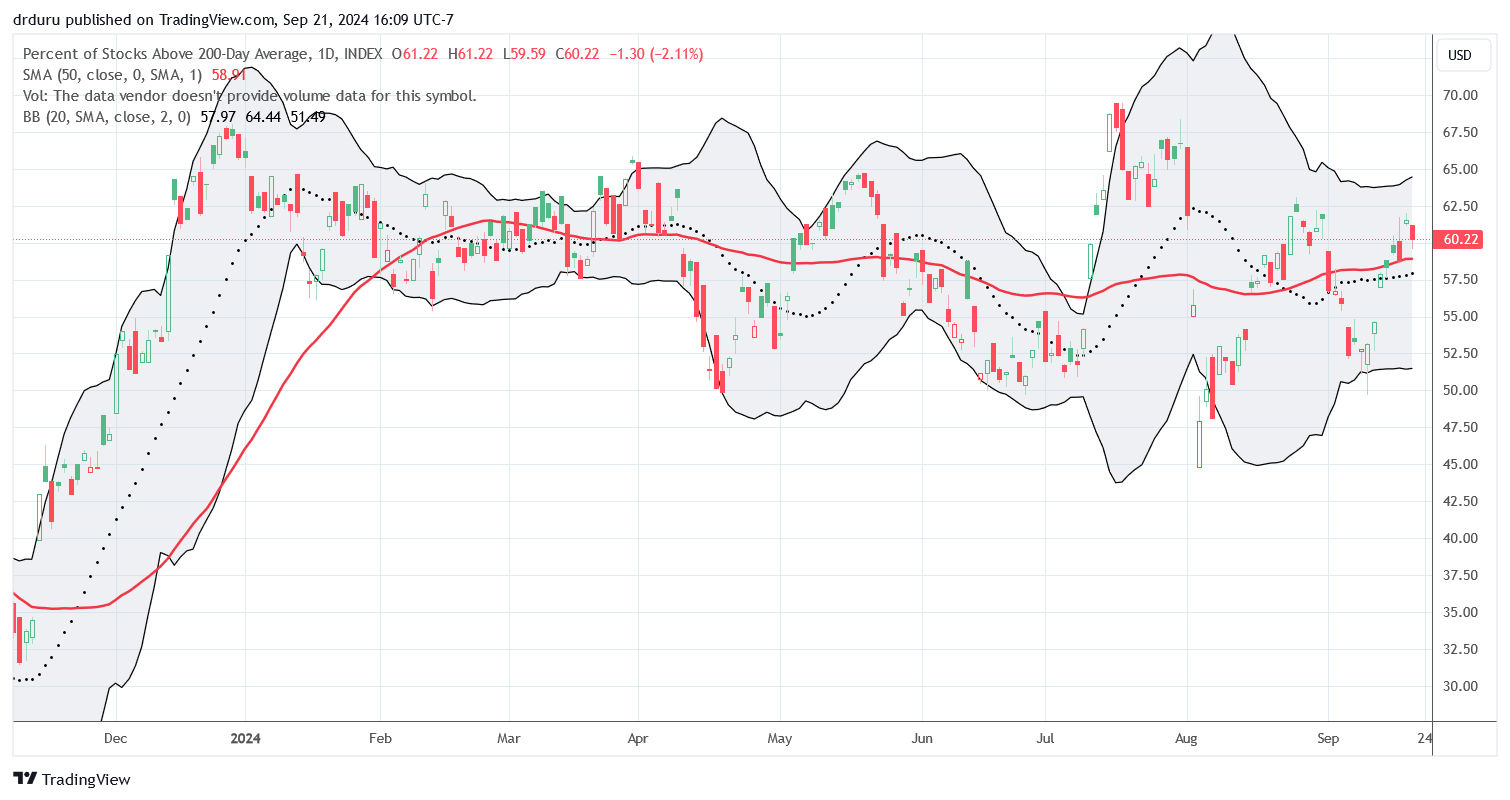
- AT200 (MMTH) = 60.2% of stocks are trading above their respective 200-day moving averages
- Short-term Trading Call: neutral
AT50 (MMFI), the percentage of stocks trading above their respective 50DMAs, closed the week at 62.7%. The recalibration between bulls and bears left my favorite technical indicator in a precarious position. Wednesday’s fade fell from the overbought threshold of 70%, a bearish signal based on the AT50 trading rules. Thursday’s rebound positioned AT50 to invalidate the bearish signal. However, Friday’s fade just reinforced the bearish signal. Thus, my recalibration is to reconcile contradictory trading signals. The S&P 500 and the NASDAQ are positioned to go higher while IWM is positioned to fade back to 50DMA support. The end result is a short-term trading call that stays at neutral. I do not foresee a near-term scenario for flipping bullish, but I can see going bearish if the S&P 500 closes below its post-Fed low.
After the Fed meeting, I posted the following video to discuss bearish and bullish trading signals.
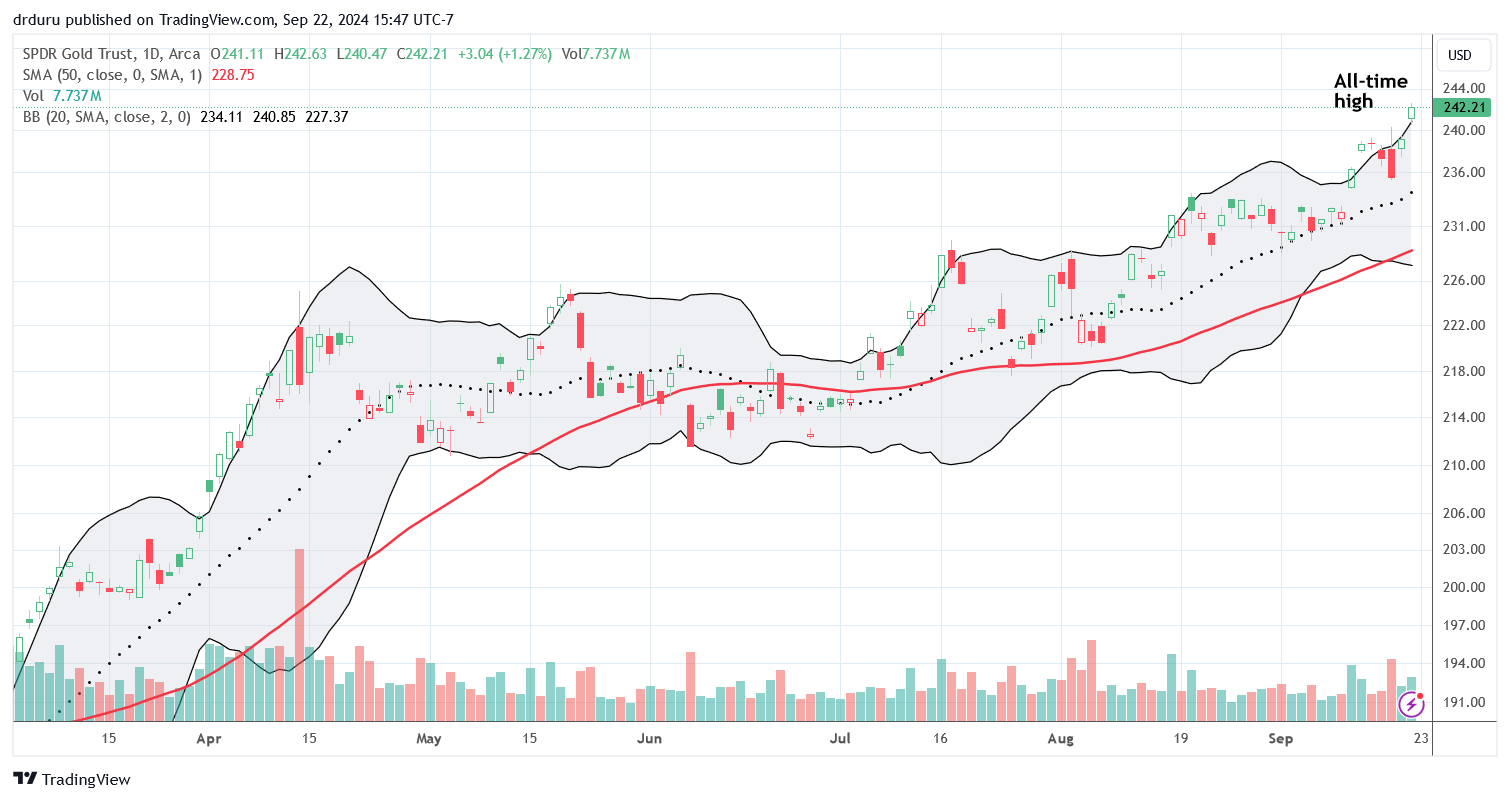
The SPDR Gold Trust (GLD) left no doubt about its posturing. Gold is in bullish form and promises to keep soaring as the Fed continues to reduce rates. GLD is now up 26.7% year-to-date and well outpaces the S&P 500’s 19.6% gain for the year. I love GLD’s odds for continuing to outperform the S&P 500 in the coming months and years, especially given budget deficits by the Federal government should continue to soar under any political scenario.
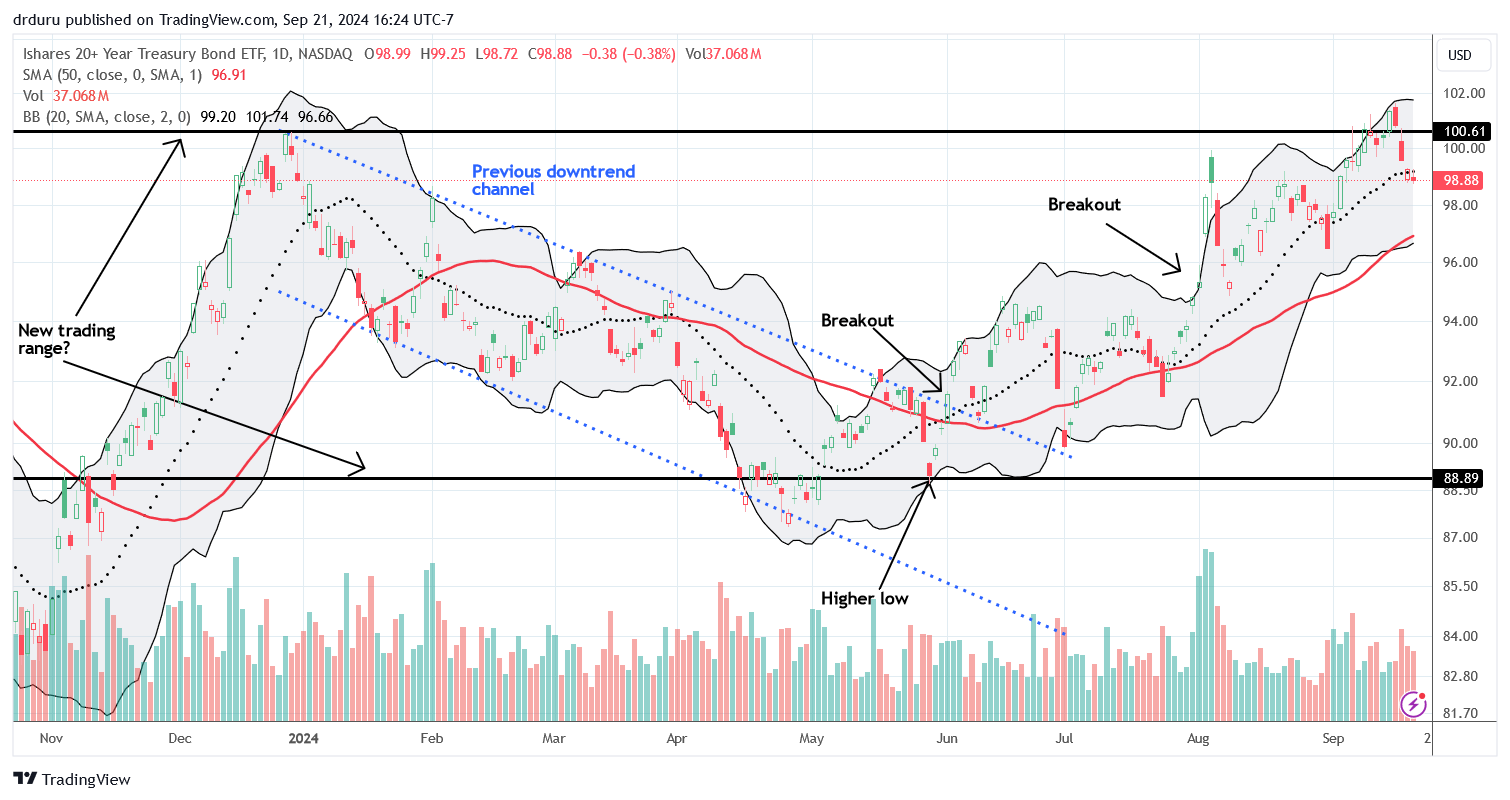
While the Fed dropped short-term rates, long-term rates pushed higher. I interpret this contrarian behavior as a sign that the bond market sees the potential for hotter inflation in response to a looser Fed. Inflation could remain elevated if short-term rates continue falling in parallel with a strong economy. This scenario also supports higher gold prices. The iShares 20+ Year Treasury Bond ETF (TLT) briefly broke out above a presumed trading range but is now back within it. I took profits on TLT puts that I bought as a bet on this trading range holding. As a reminder, higher yields mean lower bond prices.
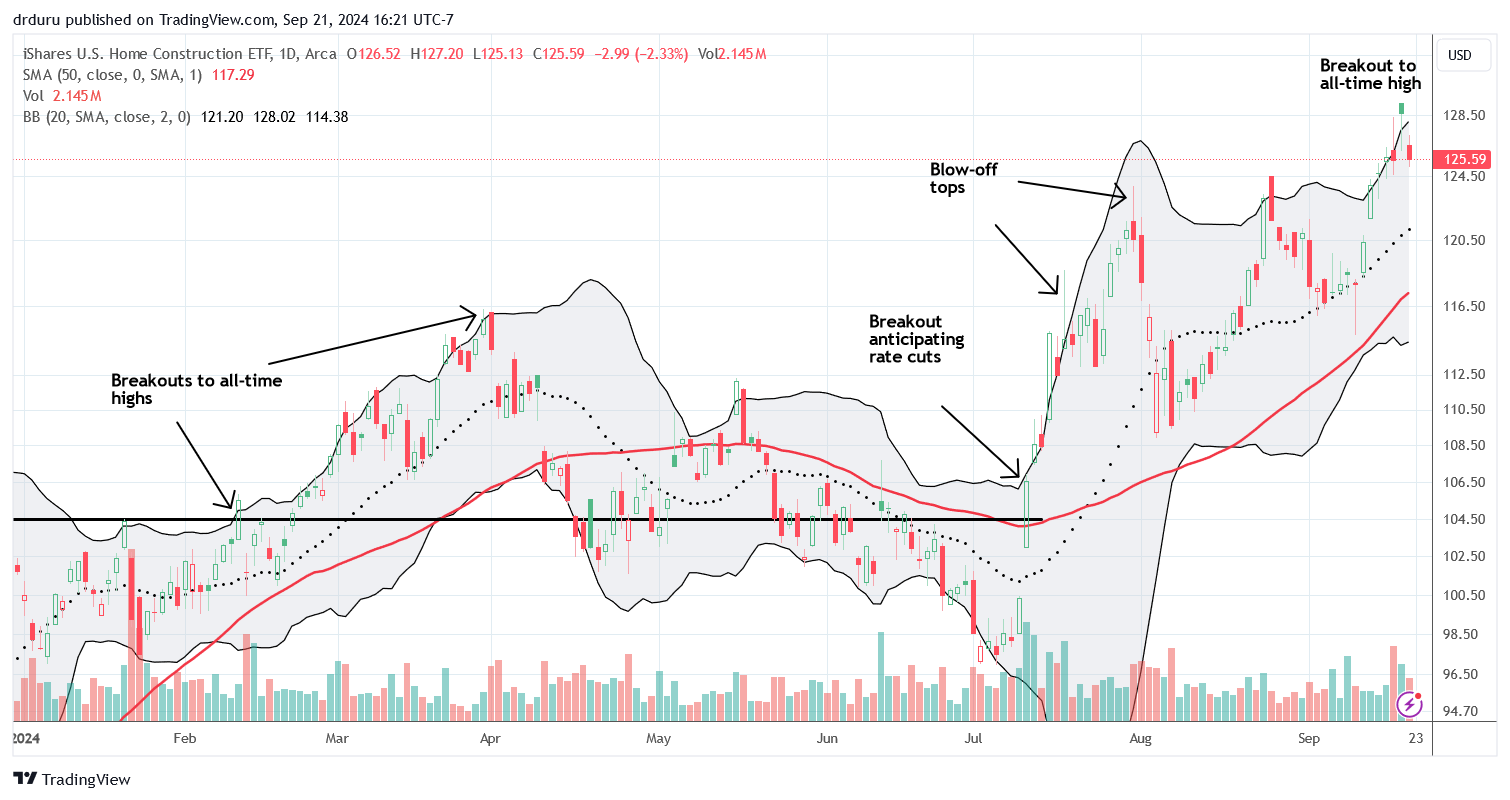
The iShares US Home Construction ETF (ITB) is a direct beneficiary of lower rates and a strong economy. ITB continues to outperform the S&P 500 with a 23.5% year-to-date gain. ITB faded on Wednesday and promptly gapped higher on Thursday. However, Friday’s 2.3% pullback left behind a pattern close to a topping abandoned baby top. The pullback was largely driven by a 5.3% post-earnings loss for Lennar Corporation (LEN). Accordingly, I am assuming ITB has topped out for now.
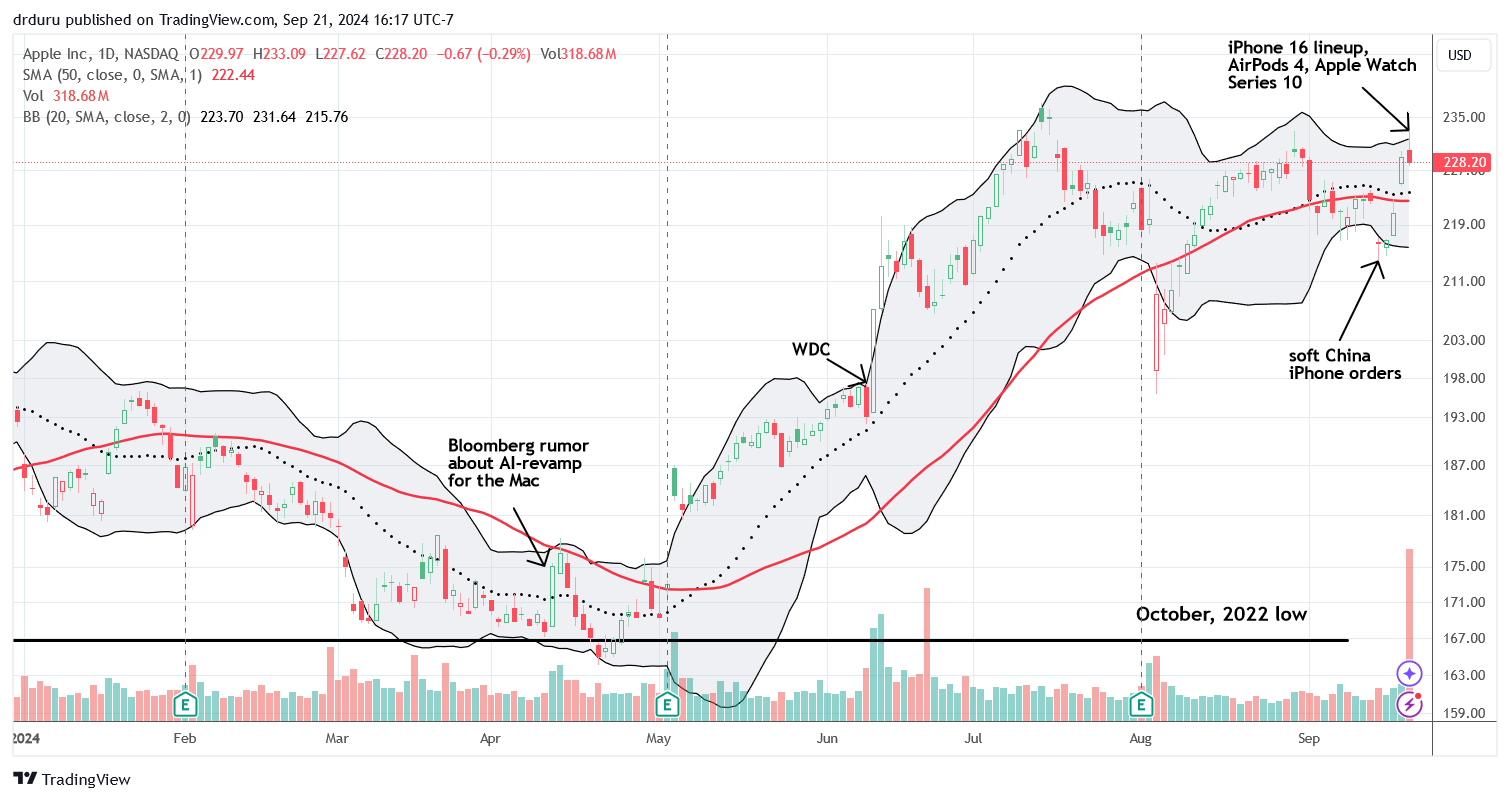
With the recalibration generating conflicting signals, I am keeping a close eye on market favorites and darlings. The signs are shaky. Last week, Apple (AAPL) flipped from despair over soft iPhone orders in China to a giddy anticipation of Apple’s latest product announcements. The flip created a 50DMA breakout. However, Friday’s fade created a fail right at resistance from the previous high. AAPL also stopped short of its all-time high set in July.
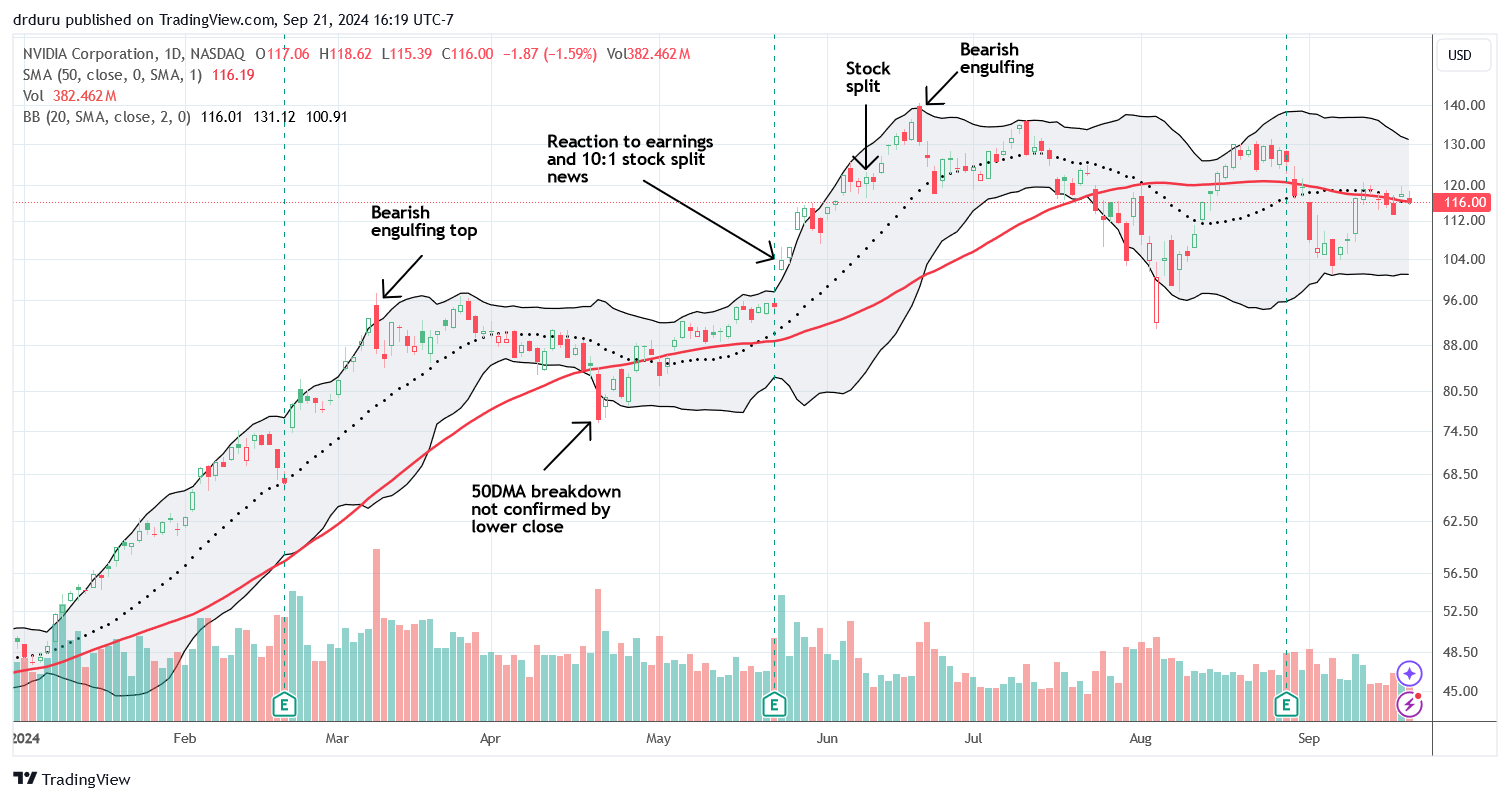
While AAPL stopped short of giving the bulls confirmation, NVIDIA Corporation (NVDA) is failing even more. Just like the NASDAQ, NVDA is trading under the shadow of a bearish engulfing topping pattern from the summer. Unlike the NASDAQ, NVDA failed to hurdle its previous high. In fact, NVDA did not even try. All week, NVDA hugged its 50DMA. I bought a fresh weekly strangle (put and call options with different strikes) in anticipation of a major move away from the 50DMA, up or down. For now, NVDA looks exhausted.
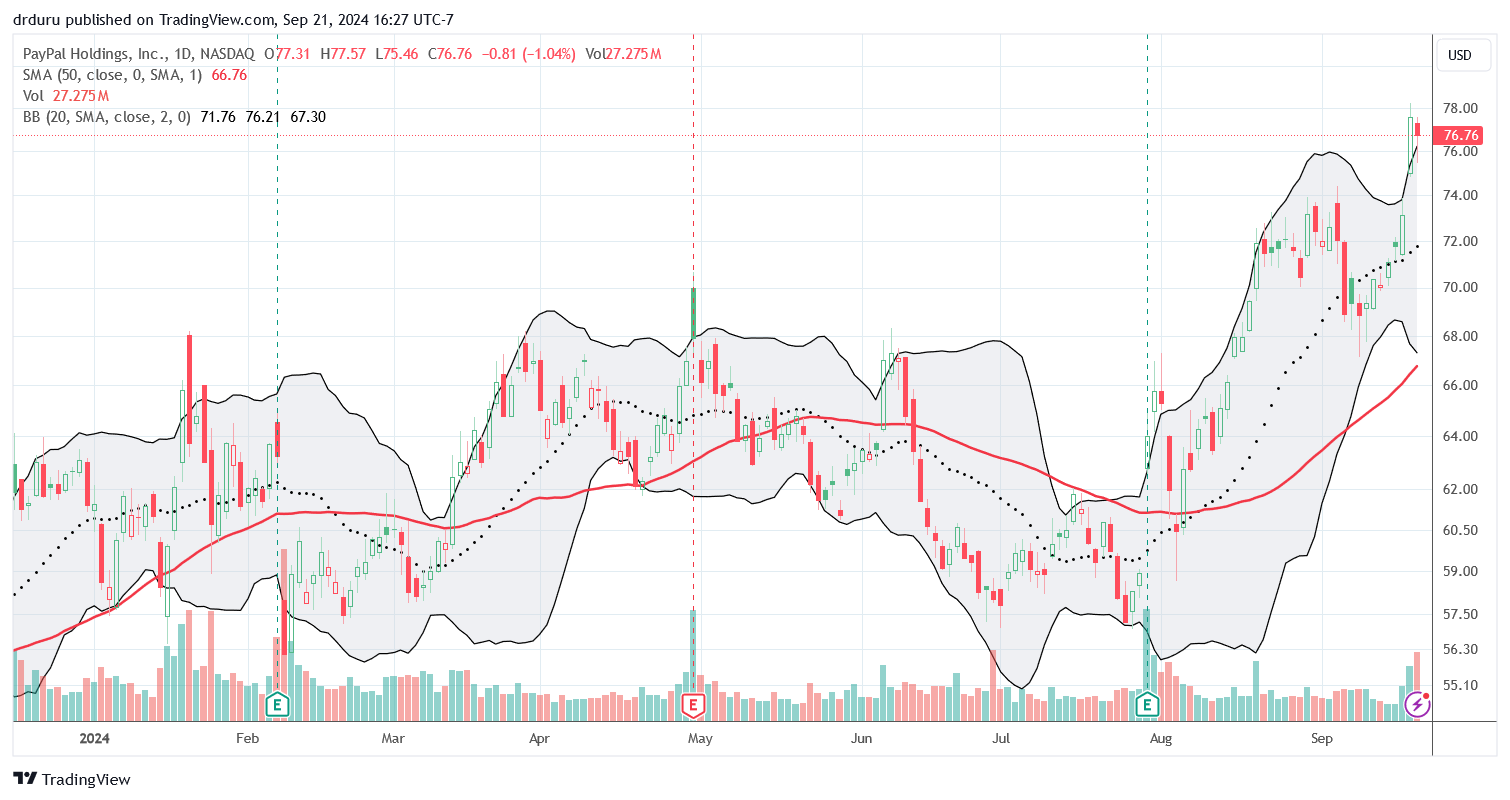
I have been a long-suffering holder of PayPal Holdings, Inc (PYPL). PYPL benefited from Thursday’s bullish recalibration with a 6.1% surge and a 17-month high. I like the fresh momentum here because it suggests PYPL has finally carved out a bottom.
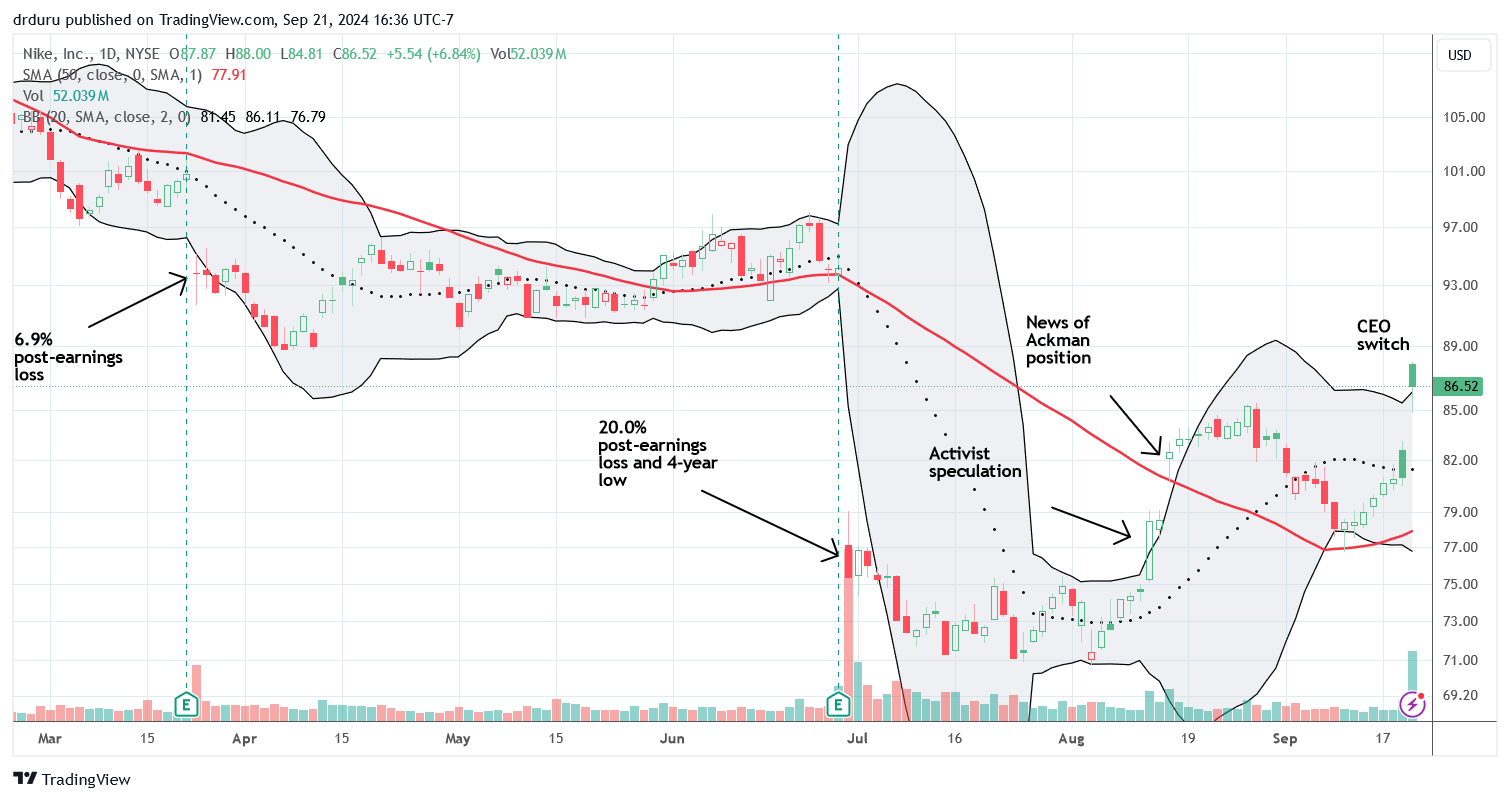
A month ago I talked about the bullish setup for Nike, Inc (NKE) from a surge on activist speculation. Much to my surprise, NKE eventually drifted lower after news of Bill Ackman’s position confirmed the speculation. The stock delivered a perfect test of 50DMA support, and NKE provided a perfect setup with a test of 50DMA support. I bought call options on a confirmation of support. At the gap open on Thursday, I took profits even though I still had over a week until expiration. I guess Ackman got right to work as the company announced a switch in CEO the next day. I could only imagine the profits as NKE gapped higher and closed with a 6.8% gain.
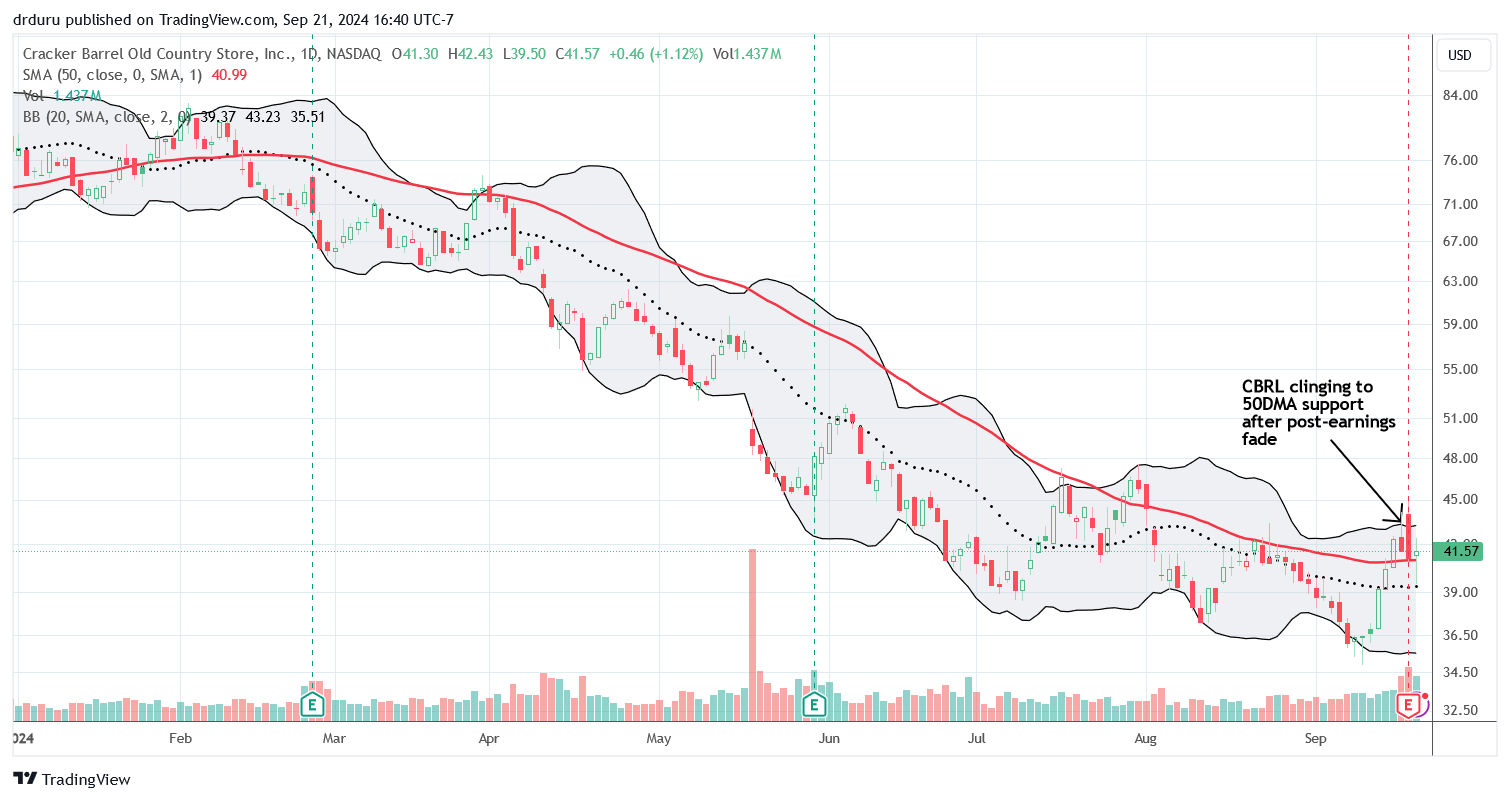
I gave up on Cracker Barrel Old Country Store, Inc (CBRL) four months ago. However, I keep taking a peek at the stock. CBRL rallied off a 15-year low into last week’s earnings. While CBRL faded post-earnings, the stock is showing faint signs of a bottoming as the 50DMA flattens out. A close above July’s high would draw me back in.
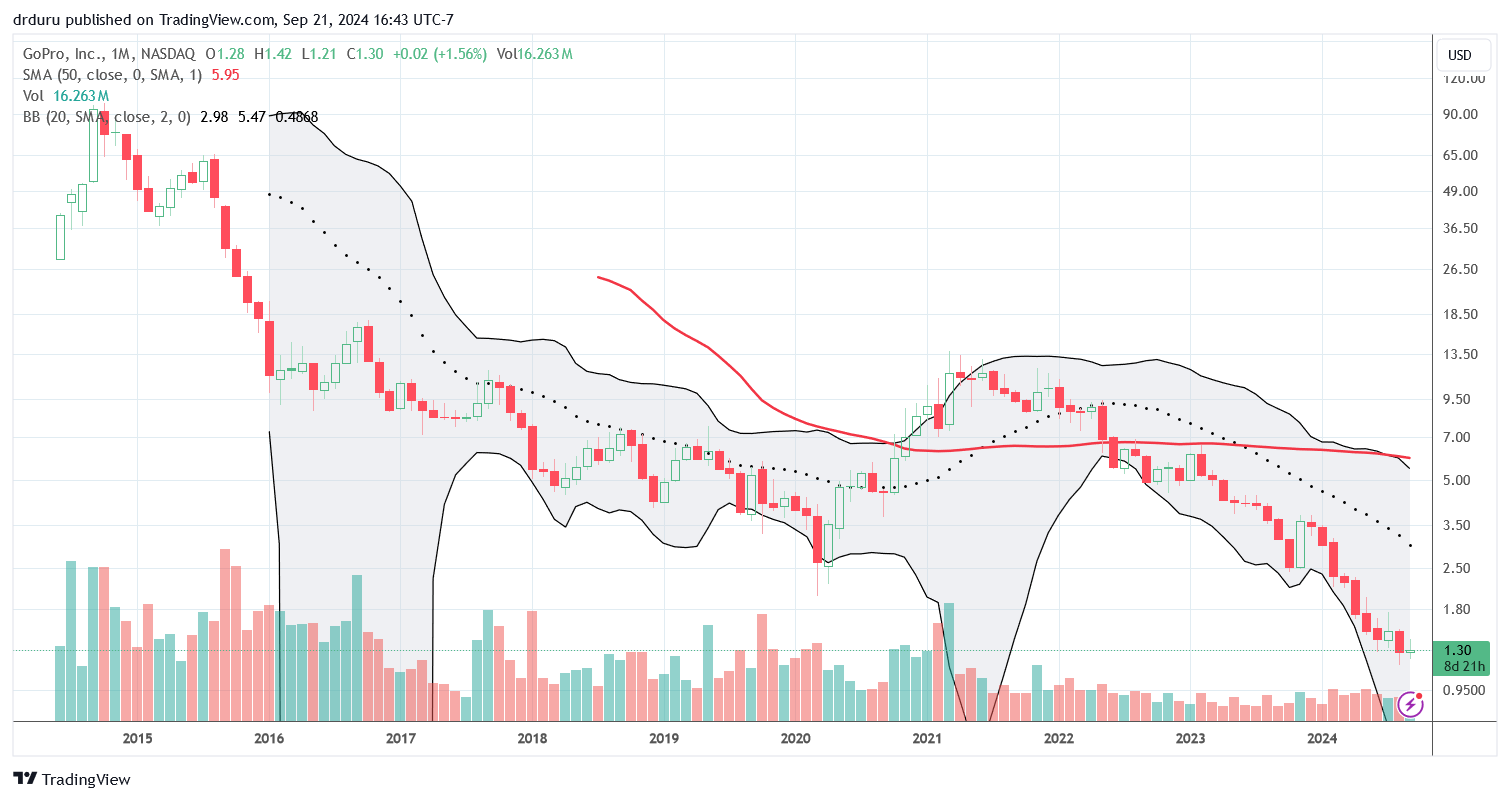
I ran into the name GoPro, Inc (GPRO) while reading a book on data analytics. Curious, I checked out GPRO’s chart, half expecting to find that the action camera manufacturer no longer traded in the public markets. GPRO is desperately trying to hang in there. Earnings last month took the stock to a new all-time low after a 12.1% loss. While the stock has recovered those losses, Friday’s 6.5% loss created a failure at 50DMA resistance. The monthly chart below shows GPRO’s near persistent journey to oblivion. As with so many similar stocks, the pandemic provided new life and false hope to GPRO in the form of a countertrend rally fed by generous stimulus into the economy and financial markets.
Be careful out there!
Footnotes
Subscribe for free to get email notifications of future posts!
“Above the 50” (AT50) uses the percentage of stocks trading above their respective 50-day moving averages (DMAs) to measure breadth in the stock market. Breadth defines the distribution of participation in a rally or sell-off. As a result, AT50 identifies extremes in market sentiment that are likely to reverse. Above the 50 is my alternative name for “MMFI” which is a symbol TradingView.com and other chart vendors use for this breadth indicator. Learn more about AT50 on my Market Breadth Resource Page. AT200, or MMTH, measures the percentage of stocks trading above their respective 200DMAs.
Active AT50 (MMFI) periods: Day #208 over 20%, Day #107 over 30%, Day #31 over 40%, Day #6 over 50%, Day #2 over 60%, Day #46 under 70%
Source for charts unless otherwise noted: TradingView.com
Full disclosure: long SPY put spread, long QQQ put spread, short AUD/JPY, long IWM, long GLD, long ITB, long NVDA strangle, long PYPL
FOLLOW Dr. Duru’s commentary on financial markets via StockTwits, Twitter, and even Instagram!
*Charting notes: Stock prices are not adjusted for dividends. Candlestick charts use hollow bodies: open candles indicate a close higher than the open, filled candles indicate an open higher than the close.

1 thought on “Recalibration Time for Bulls and Bears – The Market Breadth”