Stock Market Commentary
The second quarter of the year ended with notable divergence. The third quarter picked up where the second quarter left off. Q3 took the Q2 baton of notable divergence, sending big cap stocks ever higher while leaving most of the market further behind. The jobs report seemed to be strong enough and weak enough at the same time, satisfying everyone (Marketplace called the report a sign of “normalcy”). Bonds yields also took comfort and backed off. While it is easy to say that lower bond yields helped pass the stock baton from Q2 to Q3, the stock market has trended higher regardless of the trends in the bond market. So instead of explaining the latest price moves in the market with a specific catalyst, I am just sitting back and marveling at the strong start to Q3 for the seemingly unstoppable S&P 500 and the NASDAQ.
The Stock Market Indices
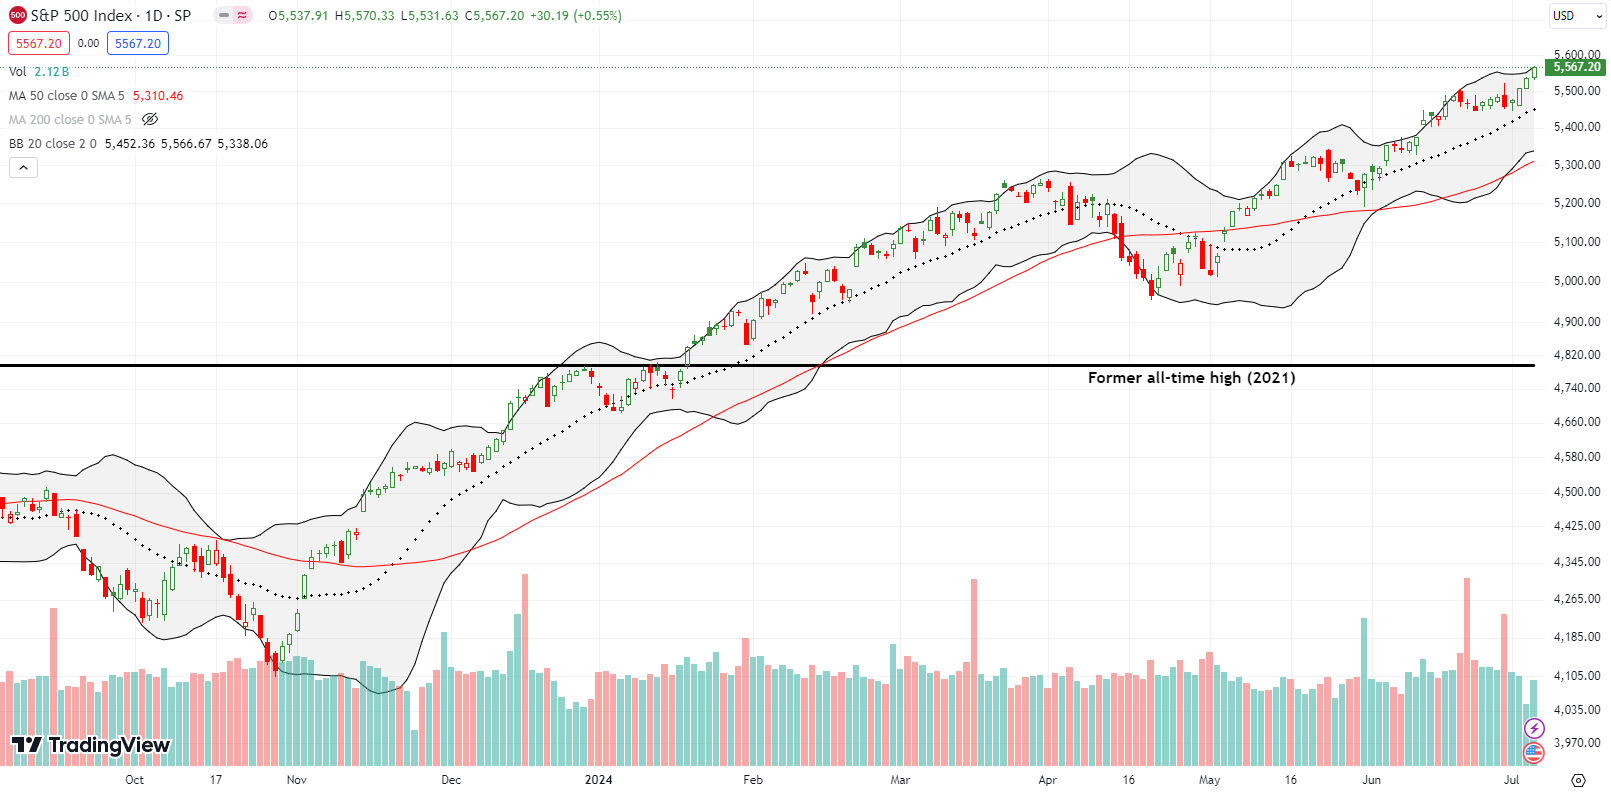
The S&P 500 (SPY) is off to a strong start for the month. The index is up 4 straight days for a 2.0% gain for the holiday-shortened week and for the month. The previous week’s bearish engulfing pattern is already a distant memory; the index looks as bullish as ever. Sellers failed to follow-through on the bearish setup and could not even reach the uptrending 20-day moving average (DMA) (the dotted line). Buyers were happy to close the week right at the upper Bollinger Band (BB) in the wake of the June jobs data. The trading action completed three straight days of all-time highs.
Still, I repeated the previous week’s move of buying a weekly put as a (partial) hedge to bullish trading positions. The put options were so “cheap” that I did not bother buying a spread this time (which of course makes the position a stronger hedge).
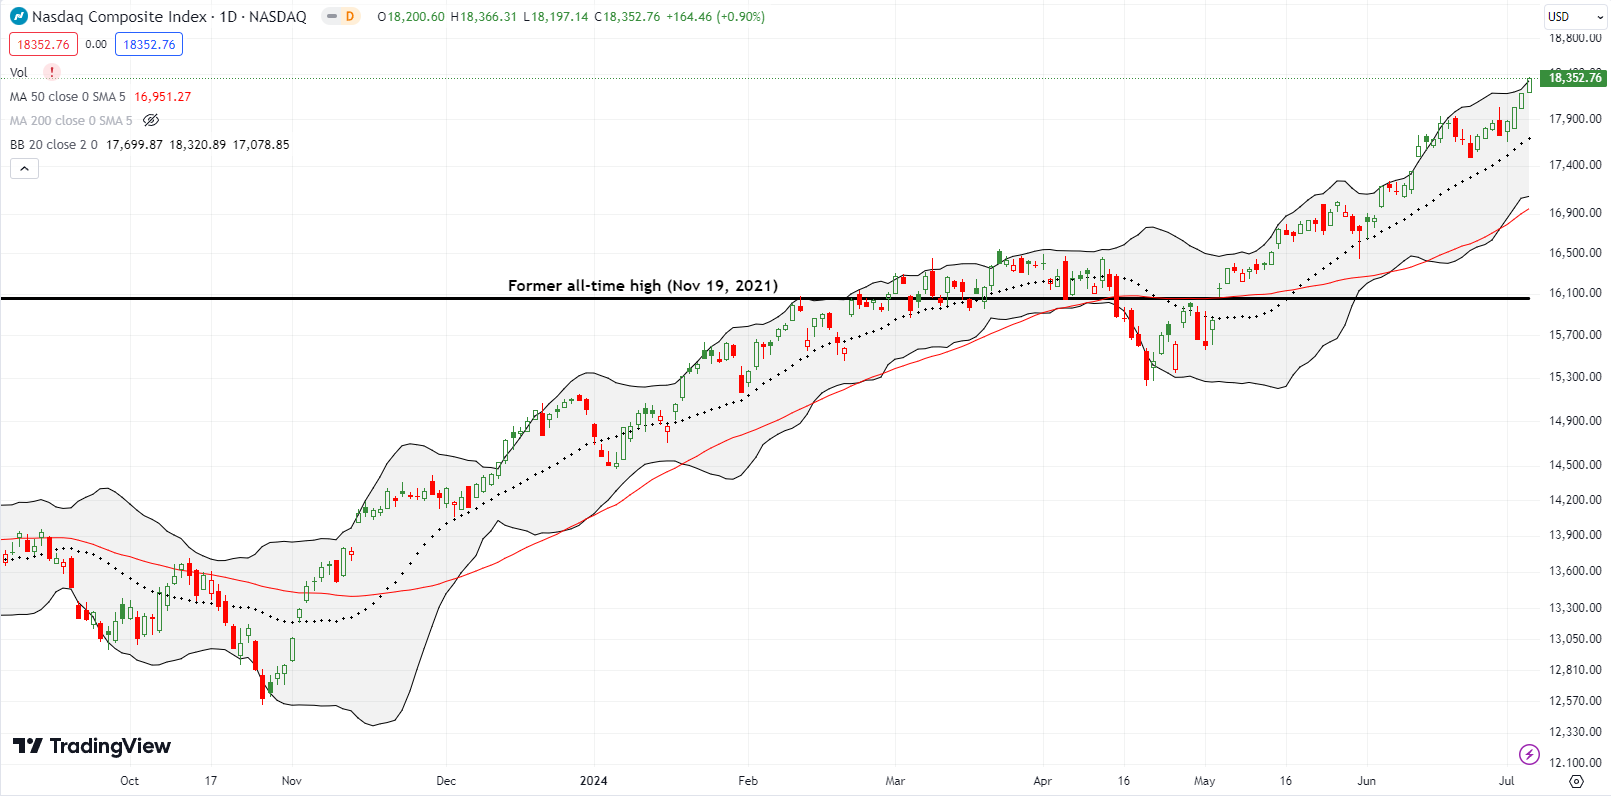
The NASDAQ (COMPQ) was a carbon copy of the S&P 500. I took profits on both of my QQQ positions from the previous week and reloaded on Friday with a fresh QQQ calendar call spread. THIS time I fully expect the short side to expire worthless while I ride the long side into the July monthly expiration week. We’ll see of course…
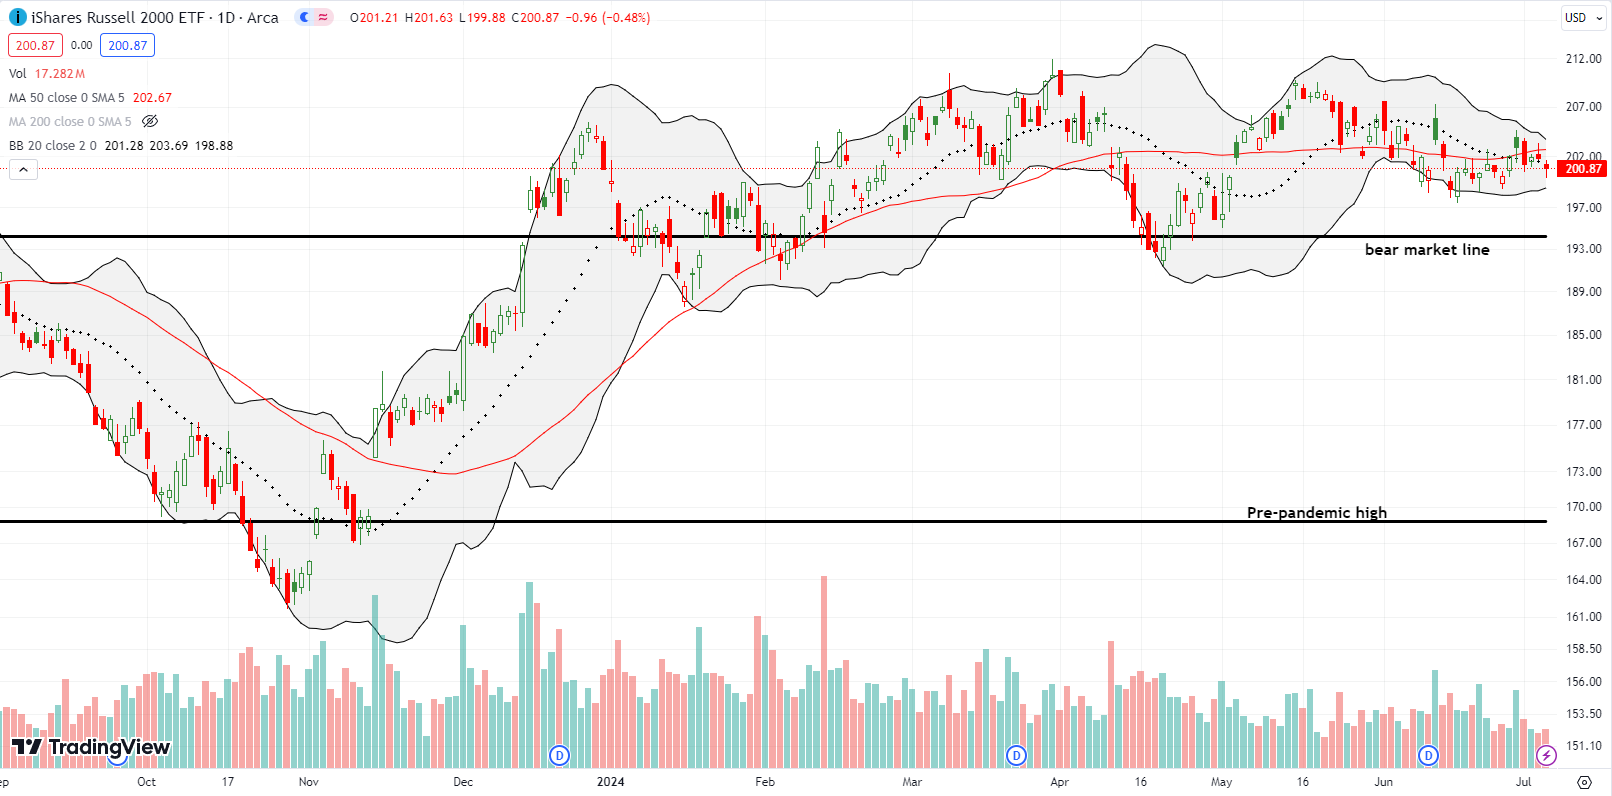
The iShares Russell 2000 ETF (IWM) returned to significant under-performance. The ETF of small caps went nowhere for the week. The pivot around the 50DMA (the red line) has continued for over a month. At least IWM’s churn provides consistency for entering and exiting swing trades. The short side of my last IWM calendar call spread expired worthless, and I will ride the long side into the coming week.
The Short-Term Trading Call With A Baton Pass
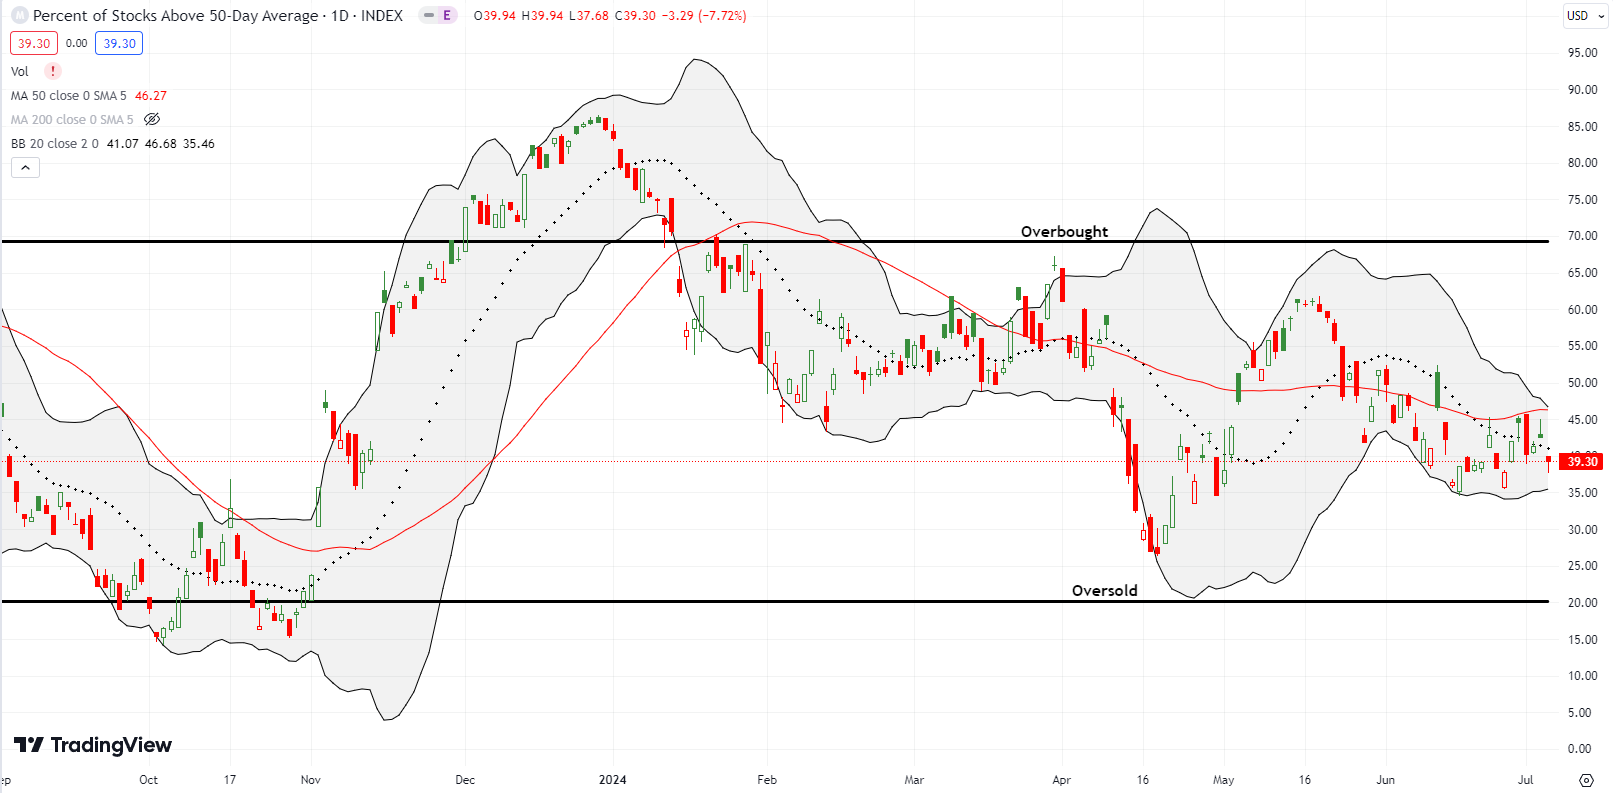
- AT50 (MMFI) = 39.3% of stocks are trading above their respective 50-day moving averages
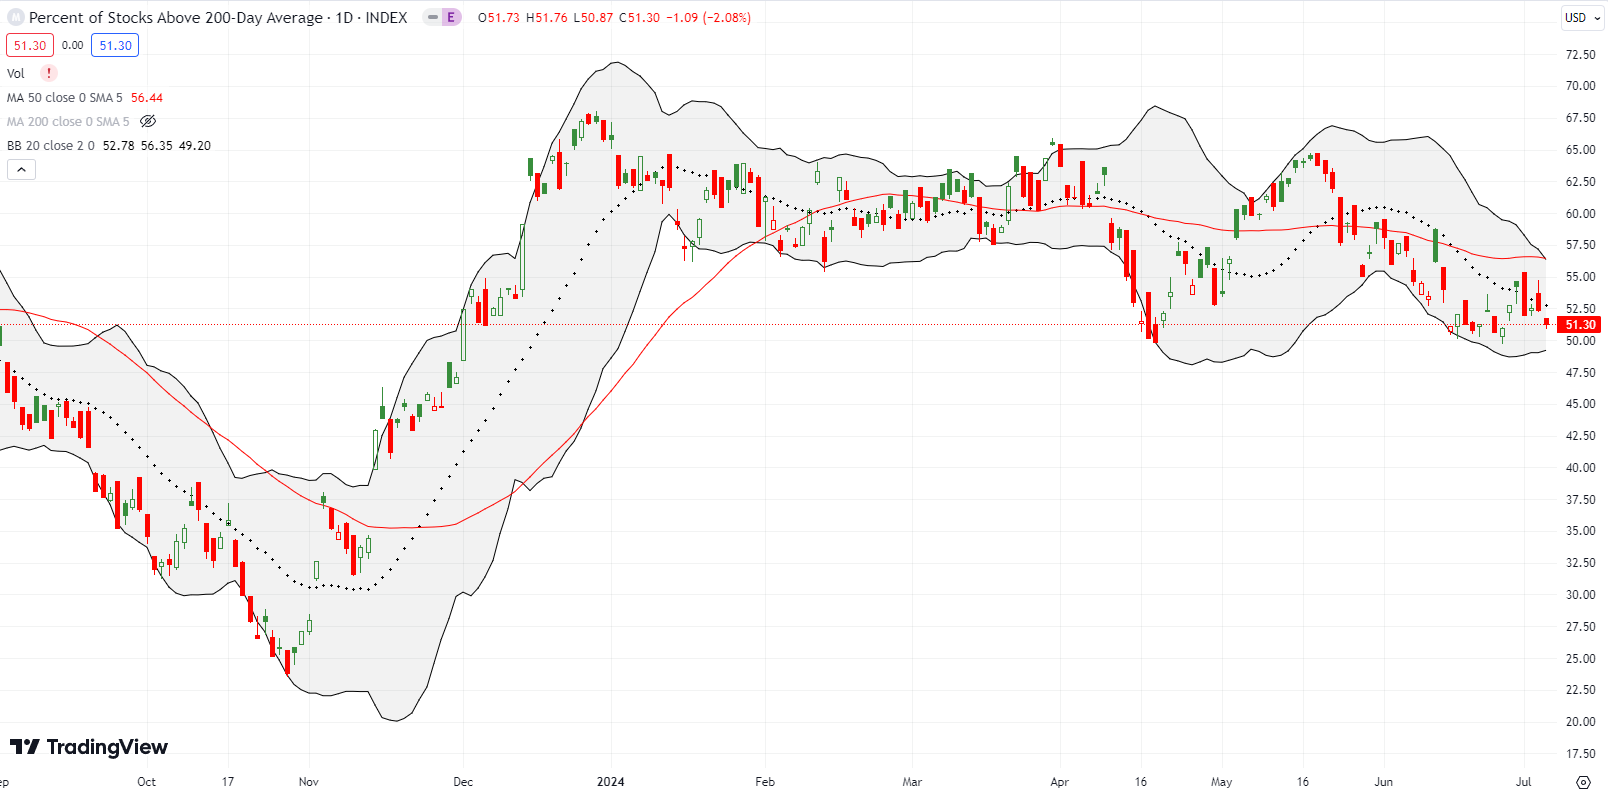
- AT200 (MMTH) = 51.3% of stocks are trading above their respective 200-day moving averages
- Short-term Trading Call: neutral
AT50 (MMFI), the percentage of stocks trading above their respective 50DMAs, returned to a bearish divergence from the S&P 500. While the S&P 500 reached ever skyward, my favorite technical indicator closed the week at a low for the new month. AT50 even started the month with a big four and a half point drop. Needless to say, I am NOT declaring an official bearish divergence given the on-going and persistent strength in the indices. My short-term trading call continues to sit uncomfortably at neutral.
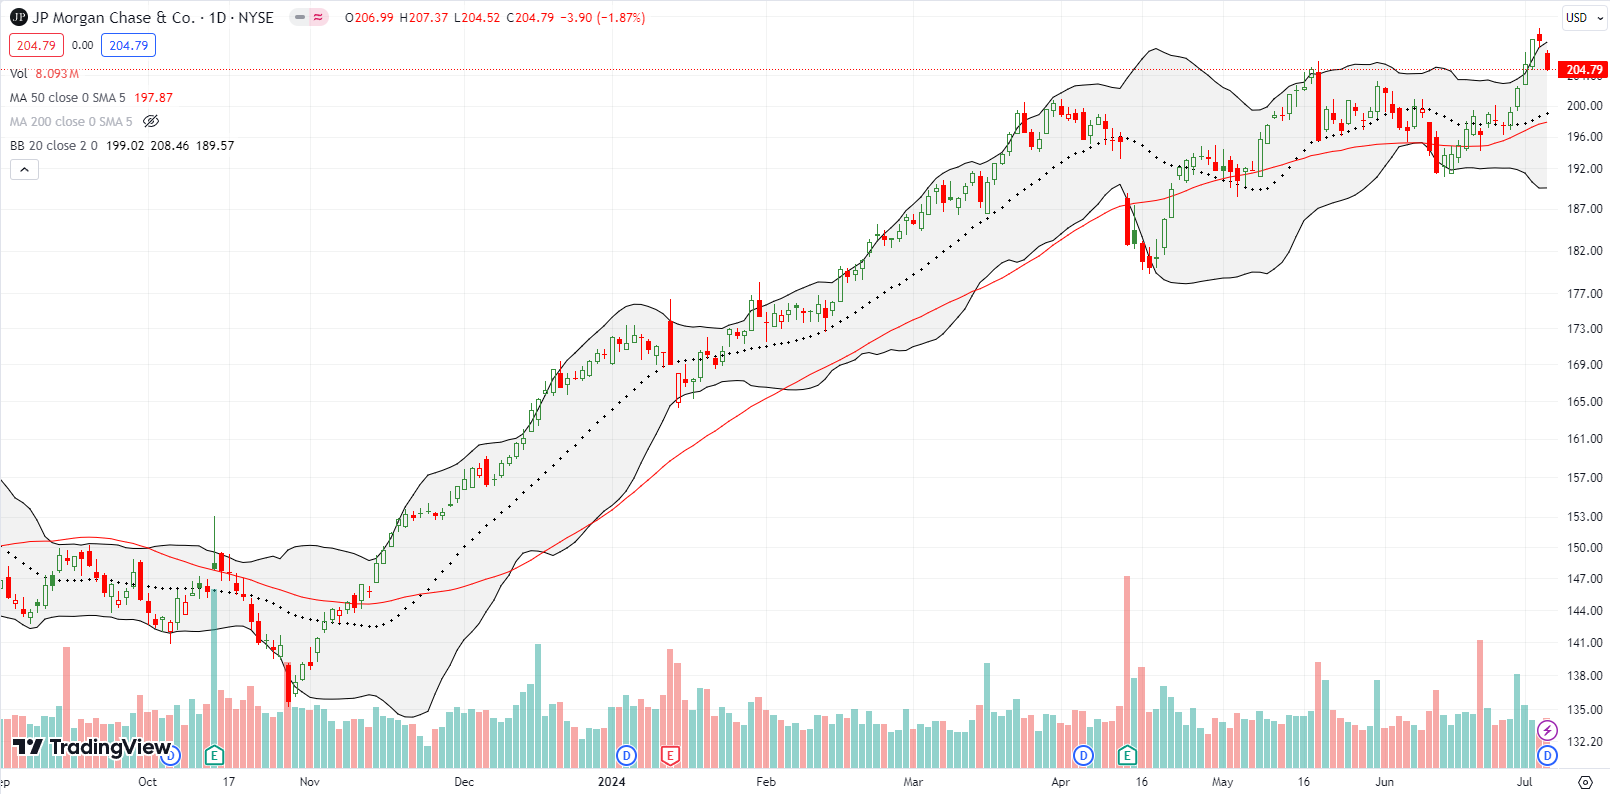
JP Morgan Chase & Co (JPM) ended the week by pulling back to its previous all-time high. While the passing of the baton was not smooth for JPM, the stock is still a textbook example of the on-going resilience in major stocks. JPM tumbled 6.5% post-earnings in April in a bearish 50DMA breakdown. Just one month later, JPM printed a new all-time high. Soon afterward, JPM quickly fell 4.5% after CEO Jamie Dimon announced an end to share buybacks. Once again, the price action looked toppy. A confirmed 50DMA breakdown in 3 weeks seemed to deliver a new opening for bearishness. Another three weeks later JPM was back at an all-time high. So now all I can ask is how soon will the next all-time high arrive?
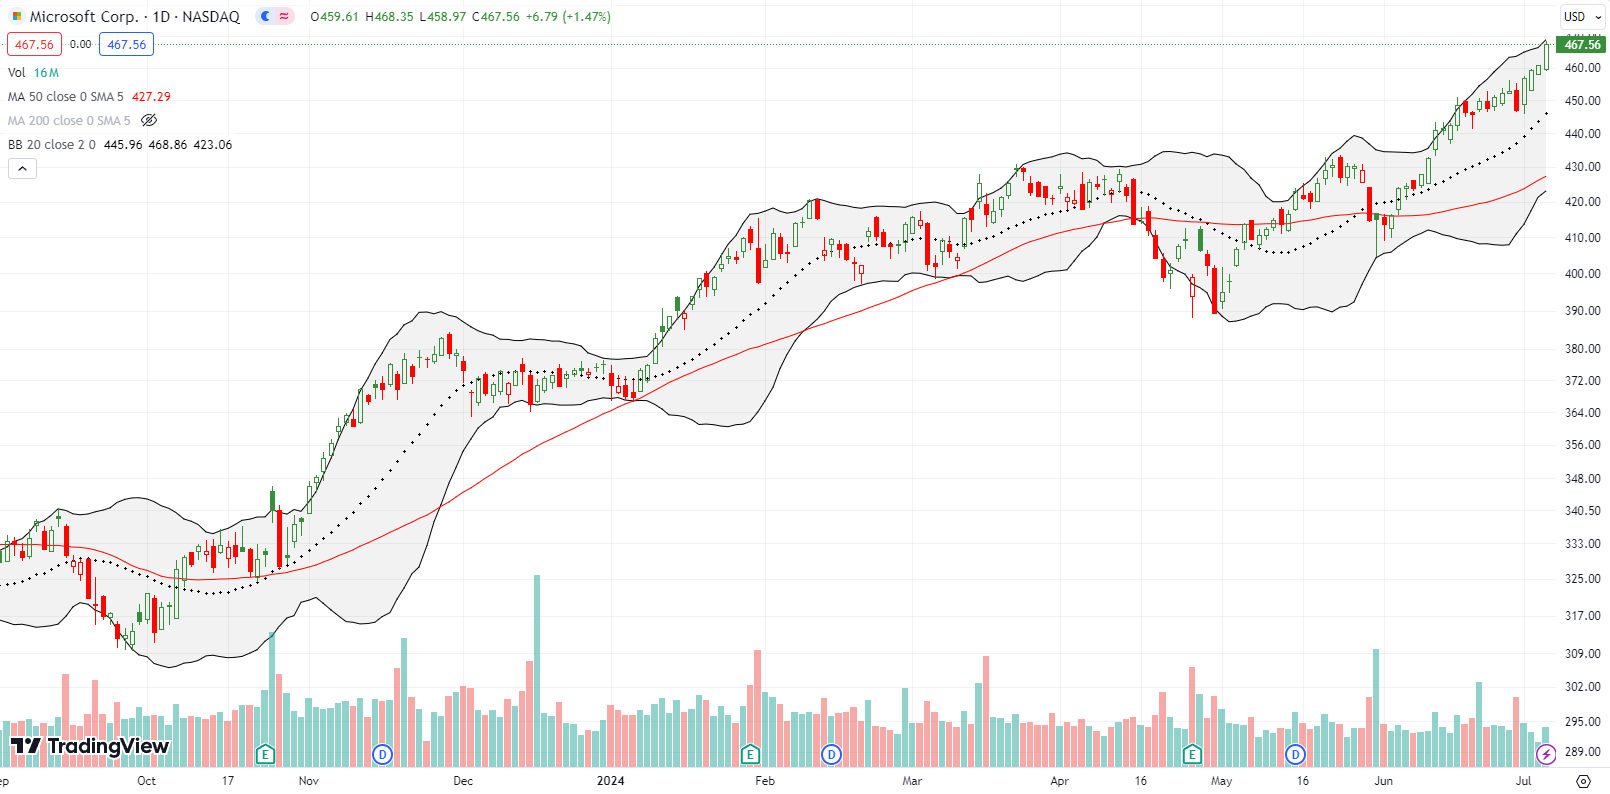
Microsoft, Inc (MSFT) has also faked out bears since reporting earnings in April. Back then, MSFT dropped 2.5%, completely recovered the next day, and then fell to a 3 1/2 month low shortly thereafter. That point was invitation for me to aggressively buy MSFT given its membership in my generative AI trade basket. However, I failed and never once bought MSFT since then – a huge miss on my part. MSFT has been hitting all-time highs for the last 3 weeks. At least I am back to flipping QQQ call options.
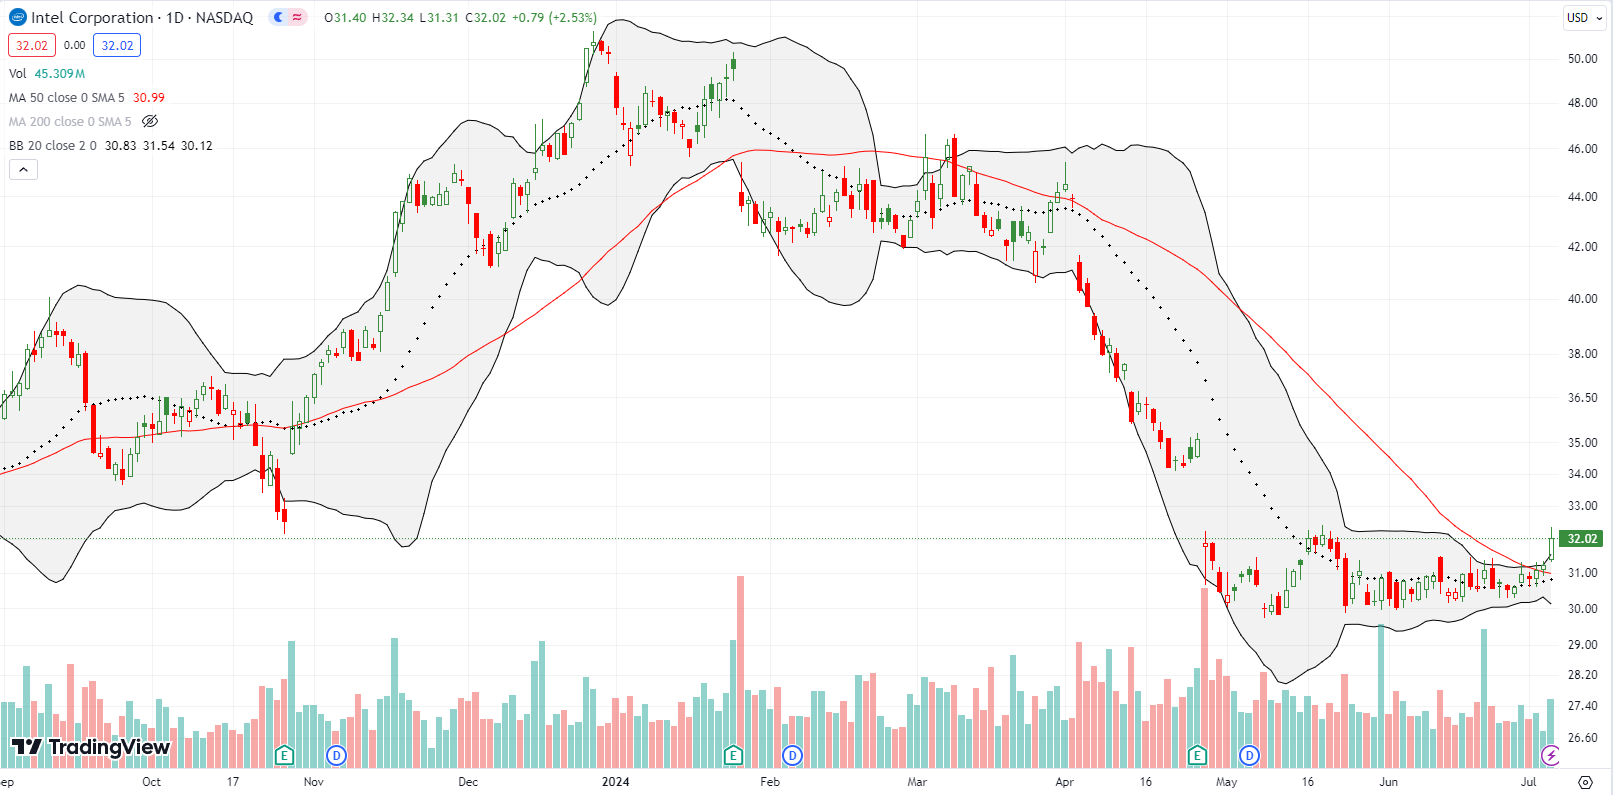
It has been a while since I have had anything promising to say about Intel Corporation (INTC). On Friday, the stock finally triggered a trade for my “between earnings” trade on the forlorn semiconductor company. INTC gained 2.5% and confirmed a 50DMA breakout. The stock is even close to confirming a bullish turn from a consolidation period. If so, I will buy shares for what I hope will be an extended hold.
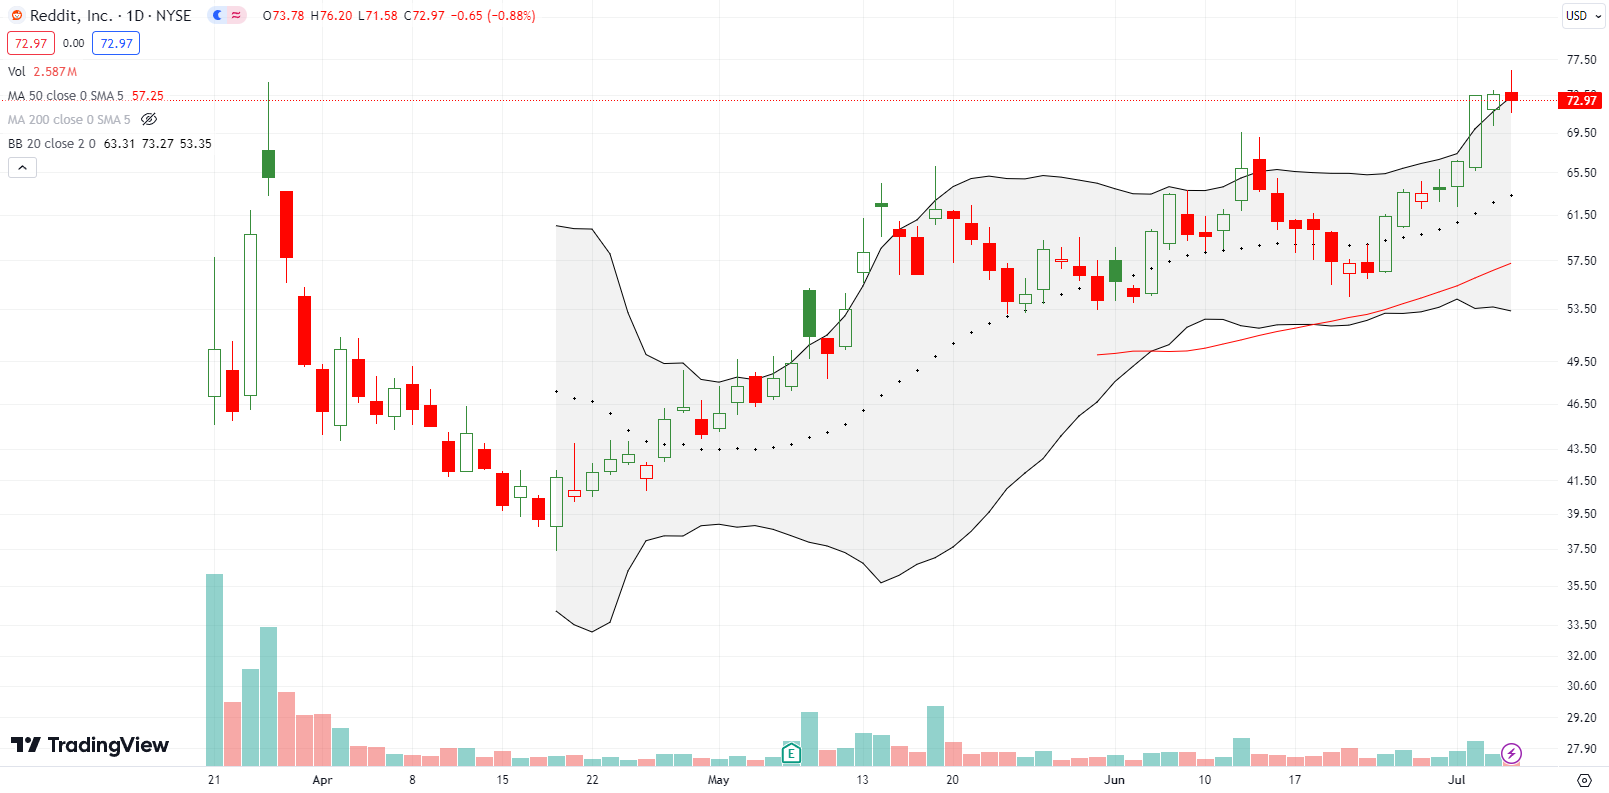
Long-lived social media platform and recent IPO Reddit, Inc (RDDT) surged 10.4% on Tuesday for an all-time high. While RDDT failed to close above its all-time intraday high, I suspect that the churn getting to this point has shaken out a lot of sellers and paved the way for yet higher prices in due time. Take note of the nascent uptrend from the 50DMA which served as “near” support last month.
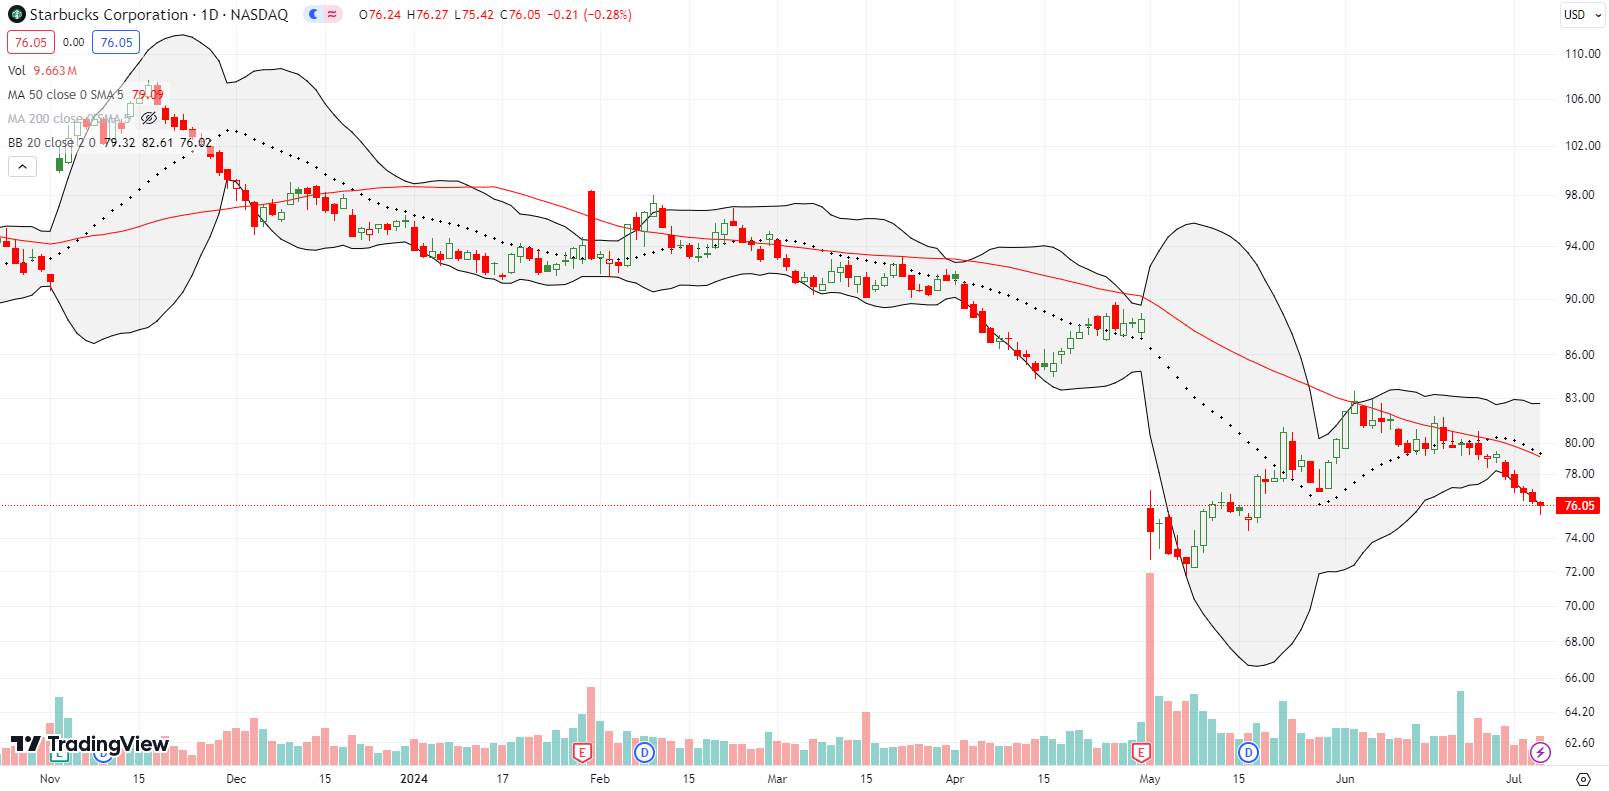
Starbucks Corporation (SBUX) is finally losing its steam from the Cramer bottom. SBUX has failed at downtrending 50DMA resistance multiple times since early June. The stock is now in the middle of an extended losing streak. I am not yet interested in jumping back in given the freshly tepid technicals. However, I am monitoring for a new entry opportunity.
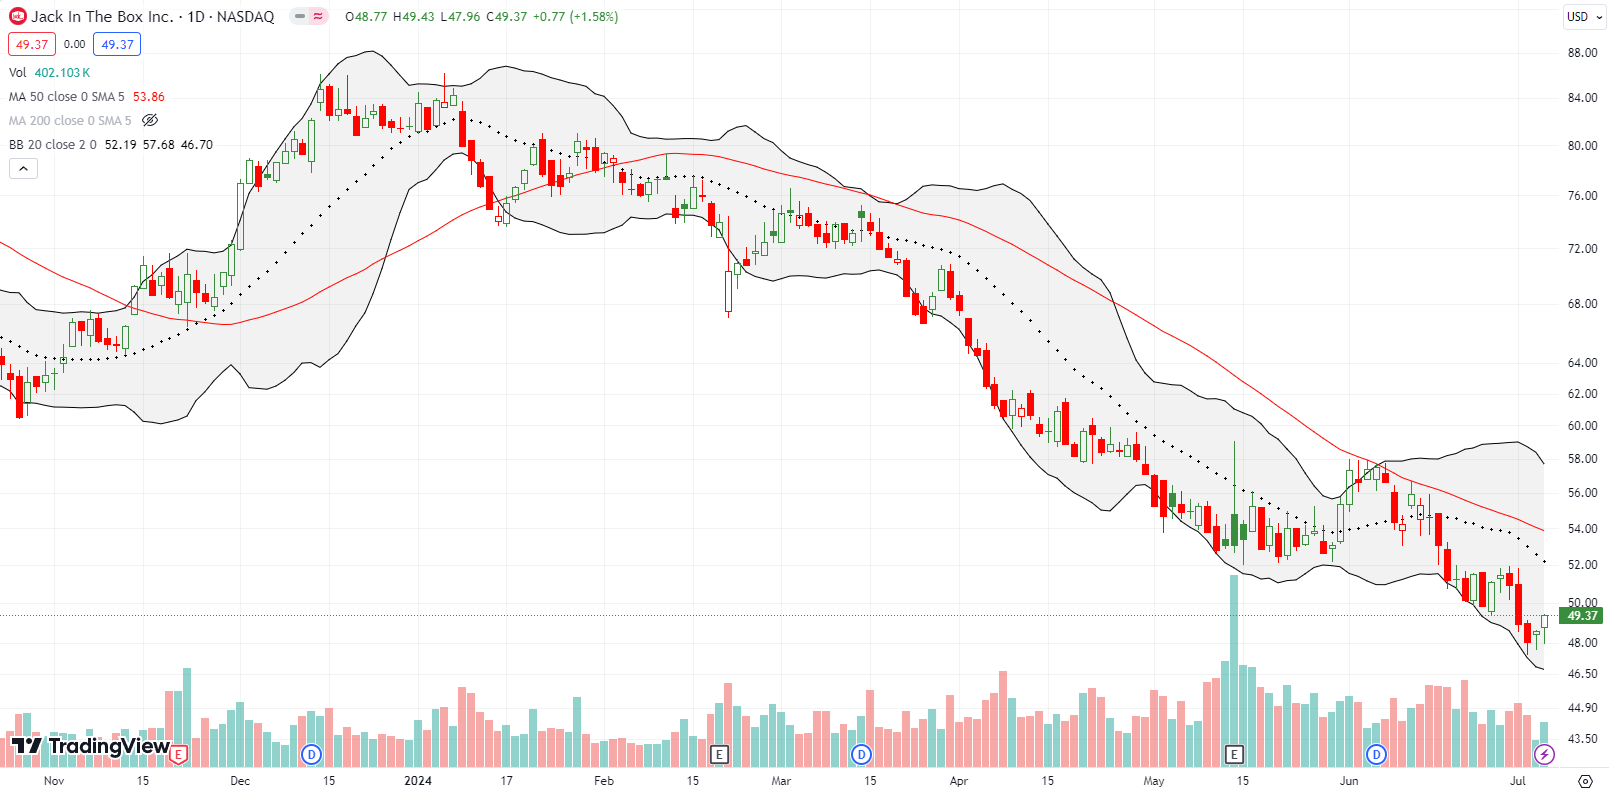
Jack In the Box Inc (JACK) is one of many struggling fast food (and fast casual) restaurants. JACK tepidly bounced off a 4 year, 3 month low in a move that looks designed to eventually test the downtrending 50DMA. I started buying put options anyway. I should have jumped in at the failed test of 50DMA resistance in early June.
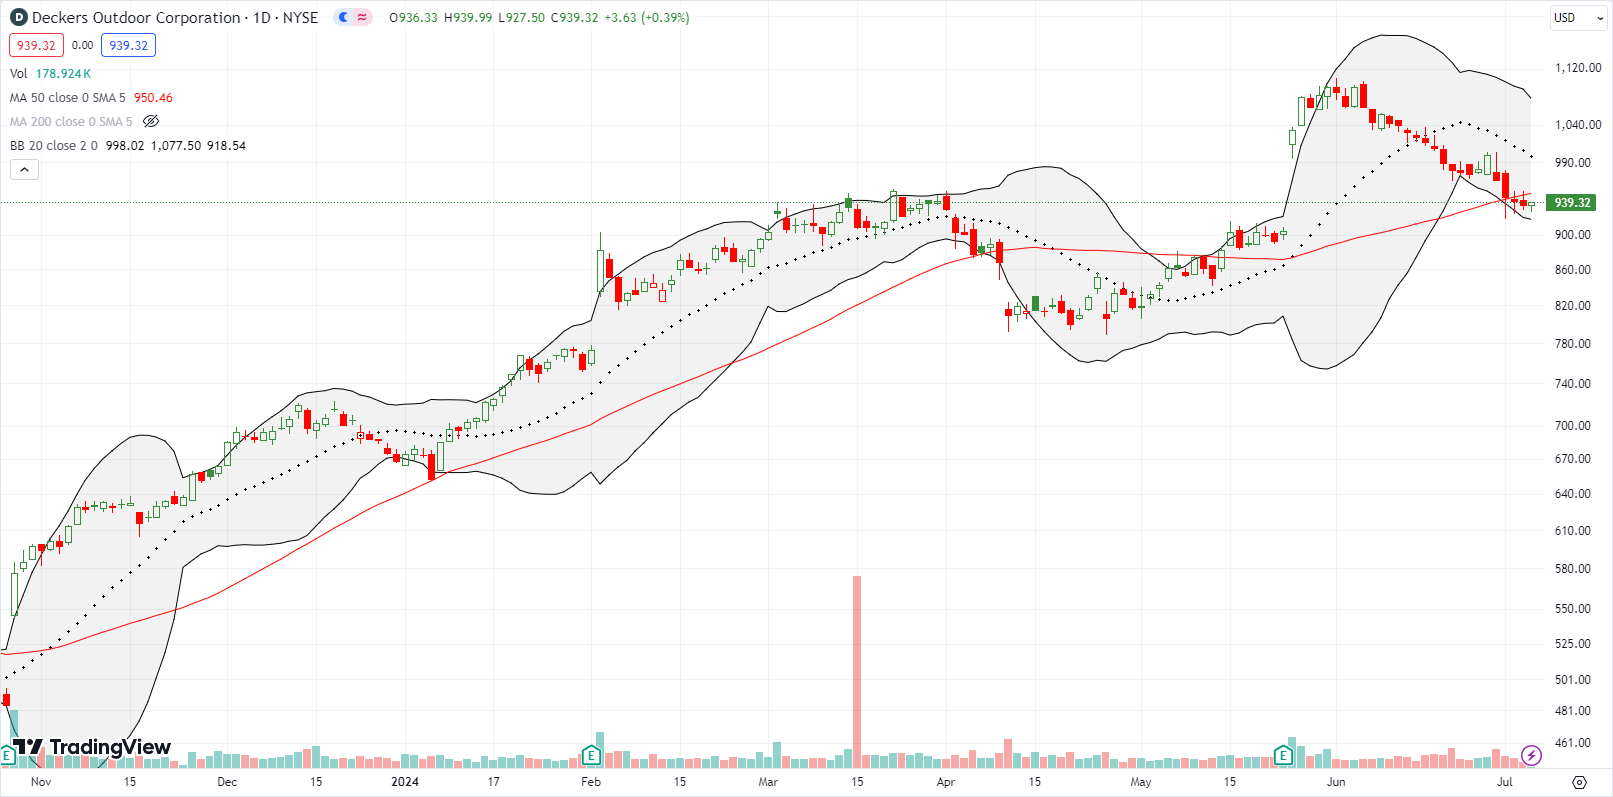
Deckers Outdoor Corporation (DECK) has steadily marched lower for a month from its all-time high. DECK barely confirmed a 50DMA breakdown with a full reversal of its post-earnings gains in view. Something tells me the stock will get re-energized soon in this market of relentless uptrends.
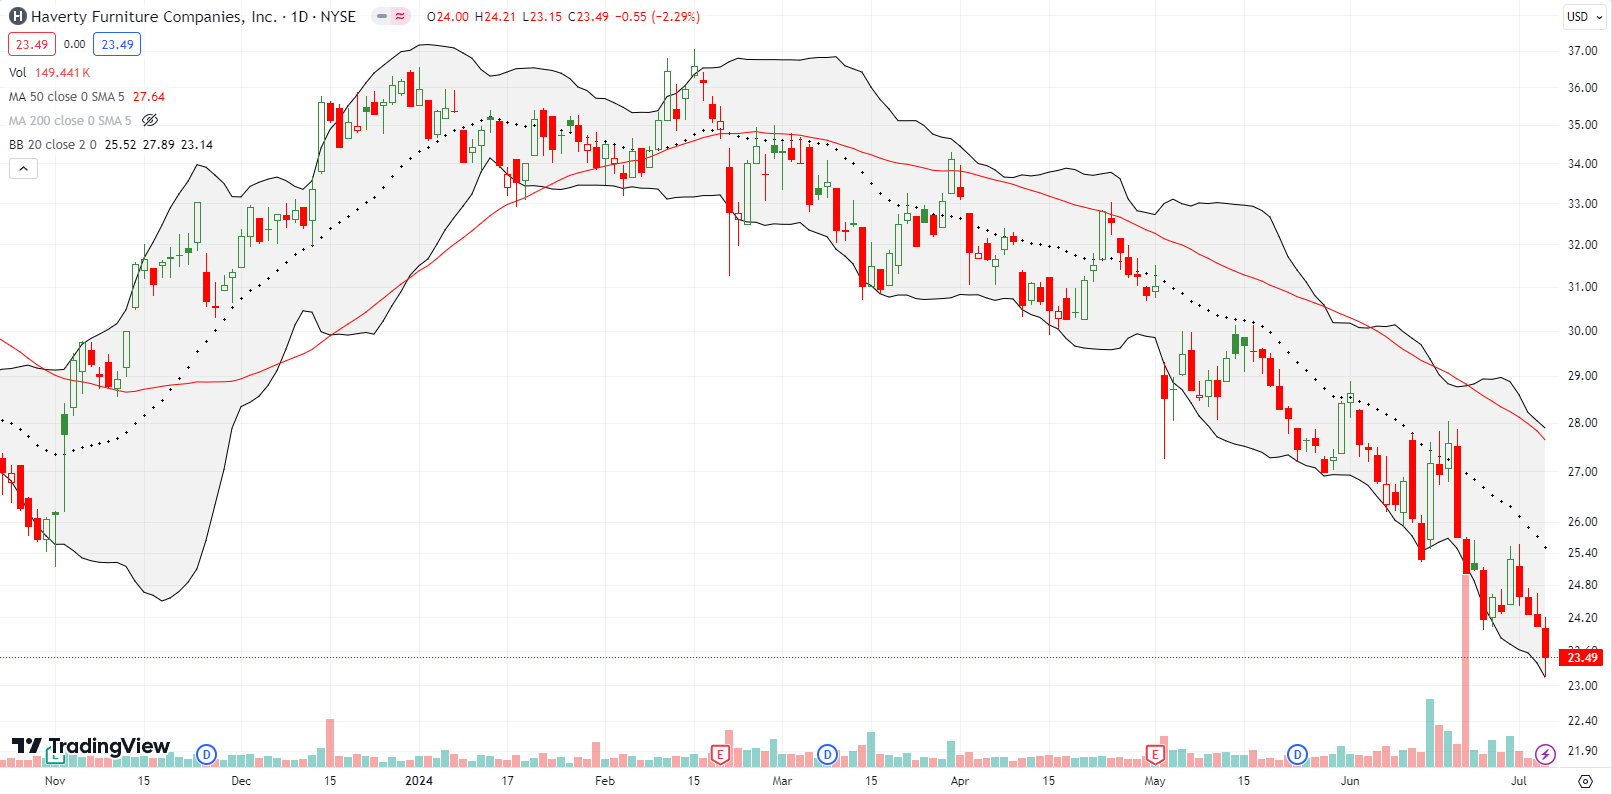
Haverty Furniture Companies, Inc (HVT) has suffered a relentless downtrend. HVT closed the week at a 2-year low. July, 2022 marked a bottom from a major pullback from an all-time high in June, 2021. So if HVT continues to sell from here, it will suffer a major breakdown which could unleash fresh downward selling pressure. I do not want to chase HVT lower, but I am watching for some kind of sign of a new bottoming process.
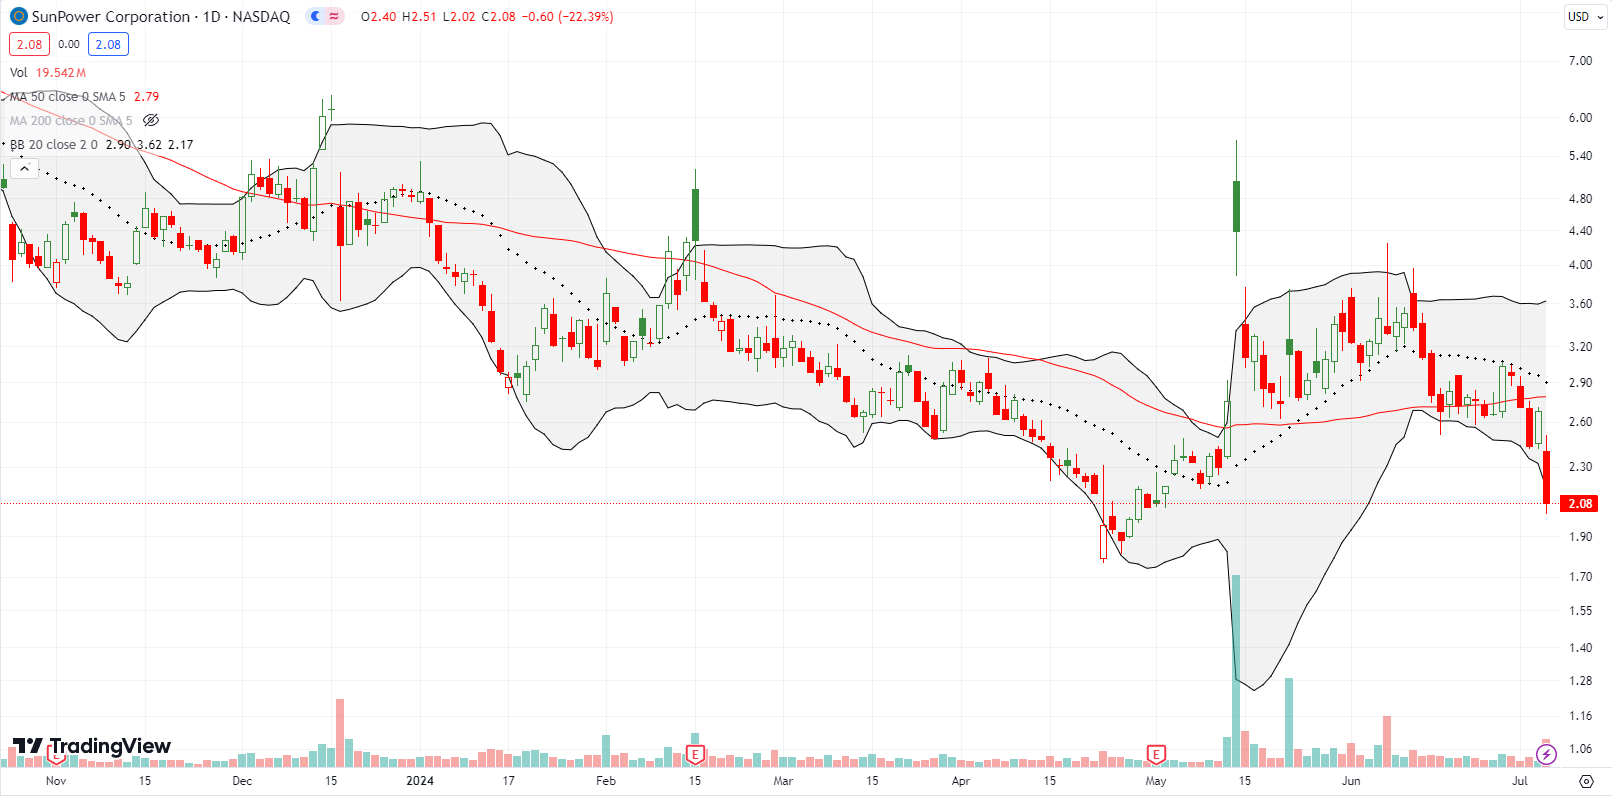
SunPower Corporation (SPWR) is one of the many long-suffering solar stocks I talked about last week. SPWR closed the week with a 22.4% plunge on news of a potential accounting scandal. Ernst & Young resigned as the company’s accounting firm on June 27th (ironically, a day where the stock surged 13.9% in an attempt to hold 50DMA support). In a related SEC filing, SPWR also disclosed that the SEC issued a subpoena on February 28th.
The delay in disclosing the SEC subpoena and the timeline of the news flow confuse me. The report date for the SEC filing is June 27th with a filing date of July 3, yet the news hit the wires two days after the filing date. SPWR jumped 10.3% on July 3rd.
Be careful out there!
Footnotes
Subscribe for free to get email notifications of future posts!
“Above the 50” (AT50) uses the percentage of stocks trading above their respective 50-day moving averages (DMAs) to measure breadth in the stock market. Breadth defines the distribution of participation in a rally or sell-off. As a result, AT50 identifies extremes in market sentiment that are likely to reverse. Above the 50 is my alternative name for “MMFI” which is a symbol TradingView.com and other chart vendors use for this breadth indicator. Learn more about AT50 on my Market Breadth Resource Page. AT200, or MMTH, measures the percentage of stocks trading above their respective 200DMAs.
Active AT50 (MMFI) periods: Day #154 over 20%, Day #53 over 30% (overperiod), Day #1 under 40% (underperiod ending 4 days over 40%), Day #23 under 50%, Day #32 under 60%, Day #121 under 70%
Source for charts unless otherwise noted: TradingView.com
Full disclosure: long QQQ calendar call spread, long SPY put and put spread, long JACK put, long INTC calls, long IWM calls
FOLLOW Dr. Duru’s commentary on financial markets via StockTwits, Twitter, and even Instagram!
*Charting notes: Stock prices are not adjusted for dividends. Candlestick charts use hollow bodies: open candles indicate a close higher than the open, filled candles indicate an open higher than the close.


Is intel going to be a buy now or still wait for some stability in price? How long do you think we can hold the stock for reasonable gains
I assume you are talking about shares. IF, and that is a big IF, I am correct that Intel is printing a bottoming pattern, then long-term investors should be able to hold INTC for quite some time. The great thing about this current pattern is that the stop-loss point is easy to identify and very distinct. Let’s say below $29.50 is when I would sell shares and take the loss and then wait for another day.
Thanks Dr Duru. Looks like Intel is already up these last two days. Is it still a sell before earnings kind of pattern now and then buy after earnings
Amazingly strong price performance! While the stock looks over-stretched, this strength makes me comfortable buying and holding shares. I will continue to trade call options between earnings. I promptly took profits on the call options. Now I can only hope for a dip for buying stock (and maybe more call options)!
FYI – I bought shares of INTC this morning. I am taking advantage of Friday’s 5%+ plunge. This is a long-term holding. I am assuming the recent lows will hold and I like the uptrending 20 and 50DMAs so far.
Those lows collapsed after earnings today. Very ugly. Now I am wondering whether INTC won’t find a solid bottom until its lows of the Great Financial Crisis in 2008 around $12.50. Ouch. Regardless, INTC continues to be a broken stock. I am going to go back to my original trade that has been working: buying and selling calls between earnings.