Stock Market Commentary
The annual Jackson Hole confab of central bankers starts this coming Thursday. Almost like technical poetry, the S&P 500 and the NASDAQ are back to the highs directly preceding Jackson Hole 2022. Depending on your perspective, this Jackson Hole redux either represents a bullish confirmation of the market’s resilience after 18 months of monetary tightening, or it represents a year of futility trying to fight the Fed. Since the stock market is selling off going into Jackson Hole 2023, the bears have the edge.
Since the pandemic, Jackson Hole has been a big deal. In 2020, Fed Chair Jerome Powell’s dovish talk lit a fire under an overbought stock market. The Fed used the opportunity to announce a change in its monetary policy framework which in turn planted the seeds for the inflation problem the Fed now fights. At Jackson Hole 2021, Powell reassured markets that inflation was nowhere to be seen and policy would thus remain accommodative for a good time to come. That gaffe lit a fresh fire under the stock market going into the all-time high in January, 2022. At Jackson Hole 2022, Powell hawkishly scolded financial markets which were stubbornly clinging to images of a friendly Fed despite an aggressive campaign of monetary tightening. Markets sold off sharply until bottoming two months later.
This year’s drama could go either way. The Jackson Hole redux means that the stock market is primed for major support….or major resistance. The ball is in the Fed’s court.
The Stock Market Indices
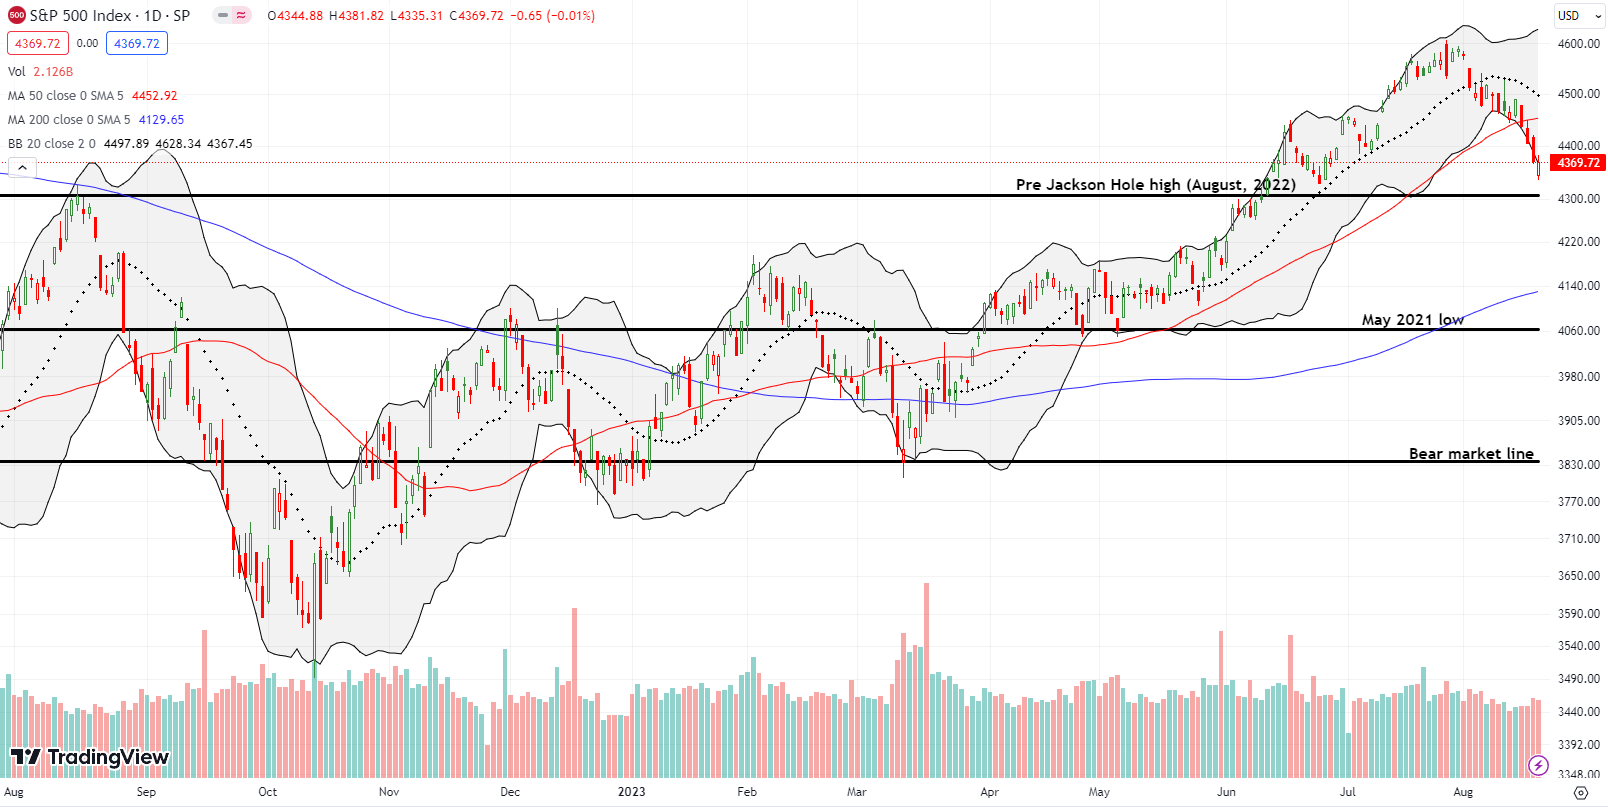
The S&P 500 (SPY) is on a 4-day losing streak with Friday closing at a fractional loss. Perhaps more importantly, the selling pressure has been so intense that the index has followed its lower Bollinger Band (BB) downward for two weeks. The S&P 500 is in bearish territory with a confirmed breakdown below its 50-day moving average (DMA). The 4.8% drawdown for the month is much greater than the median and the average maximum drawdown for this first of three of the stock market’s most dangerous months. Finally, all the gains from July are gone. Thus from so many angles, the S&P 500 looks over-stretched to the downside.
The wobbly S&P 500 trades just above the high that directly preceded last year’s Jackson Hole confab. There is almost a poetry in the index being right back where it all started. If you are bullish, this Jackson Hole redux is a buy-the-dip opportunity that looked out of reach as the index incredibly zipped higher and higher for the summer. If you are bearish, this Jackson Hole redux looks like a setup for a major disappointment.
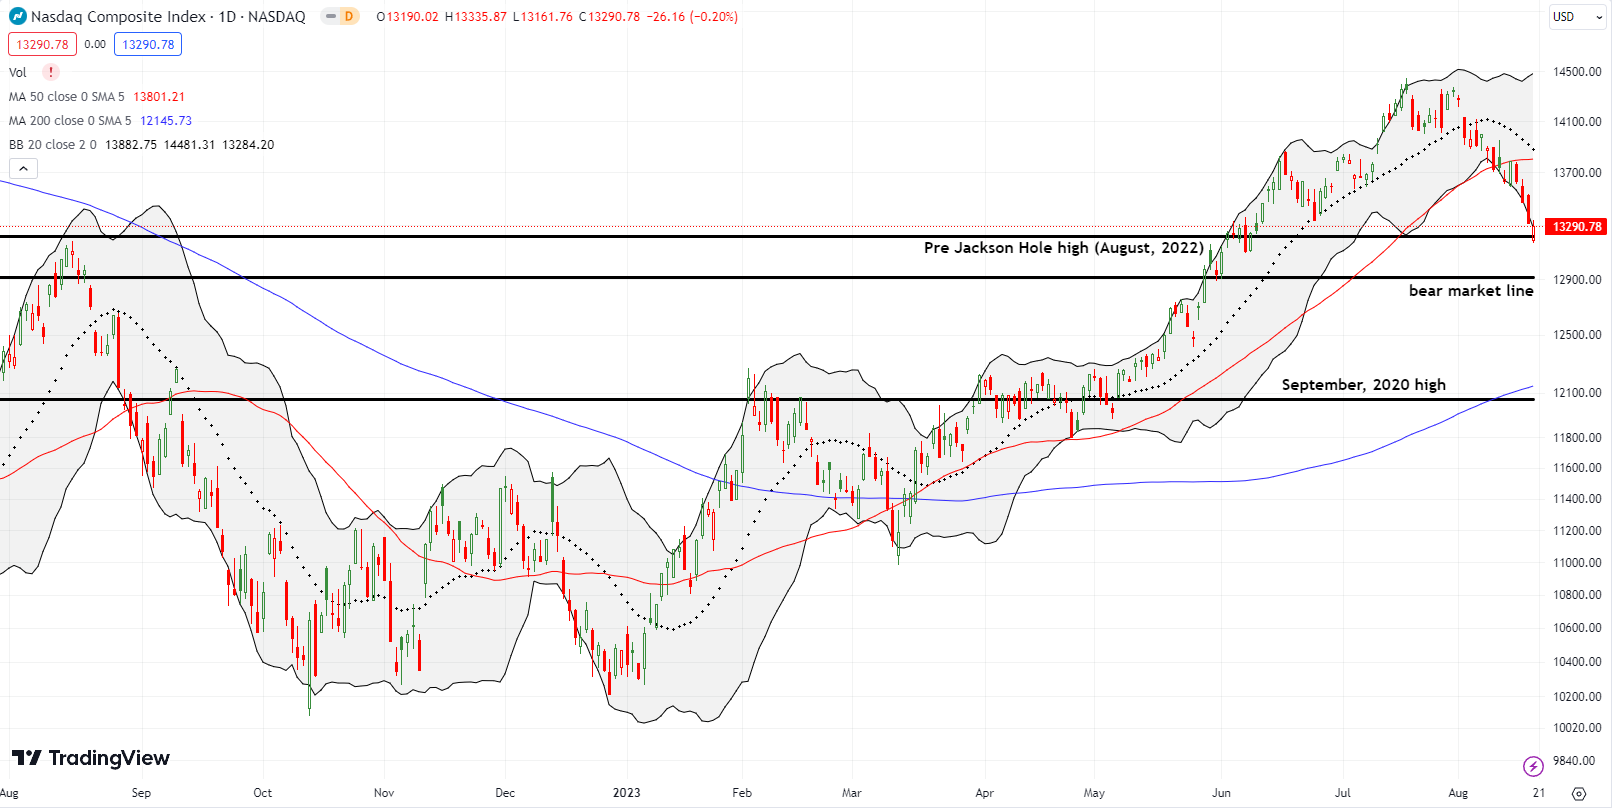
The NASDAQ (COMPQ) has already experienced its full Jackson Hole redux. On Friday, the tech laden index dropped right to its high right before last year’s Jackson Hole. Buyers sensed the significance of the moment and stepped in from there. Still, they lacked the strength to completely close the gap, and the NASDAQ ended the day with a fractional loss. Like the S&P 500, the NASDAQ has hugged its lower BB for much of the month. The NASDAQ is down 7.4%. A “garden variety” pullback is 10% lower than the last high. Such a pullback would take the NASDAQ right back to its bear market line. Given market breadth would likely be oversold by then, the bear market line could be a major (short-term) buying opportunity in the works.
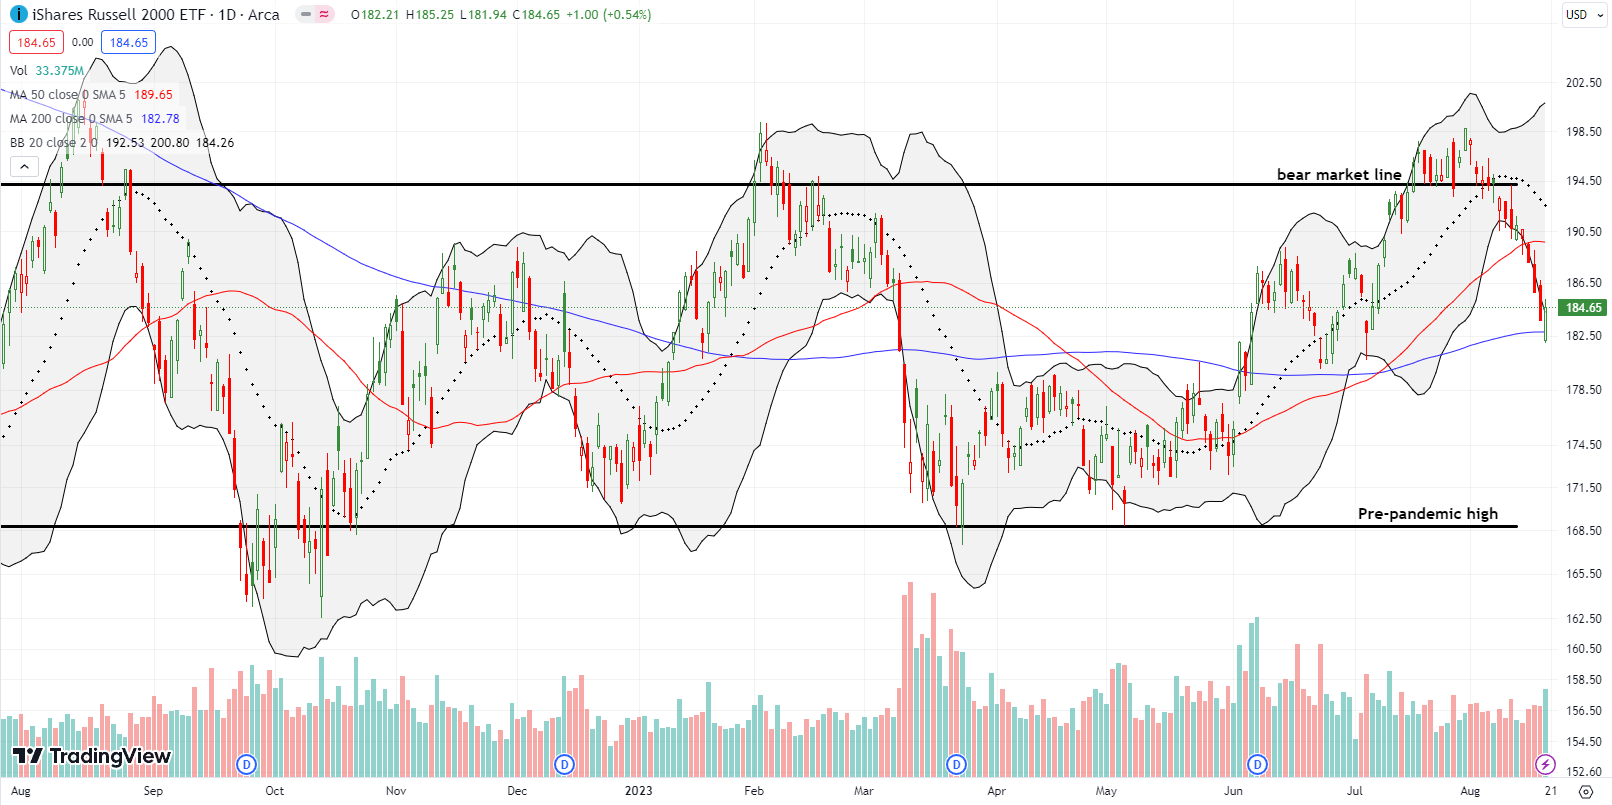
The iShares Russell 2000 ETF (IWM) has slid even faster down its lower BB than the other two major indices. IWM punched through major support at its 200DMA before buyers woke up to the opportunity. Unlike the NASDAQ, IWM managed to escape the day with a gain, 0.5%. After I noticed the rebound off 200DMA support, I jumped into a fresh calendar call spread.
The Short-Term Trading Call with A Jackson Hole Redux
- AT50 (MMFI) = 36.7% of stocks are trading above their respective 50-day moving averages (day #3 overbought)
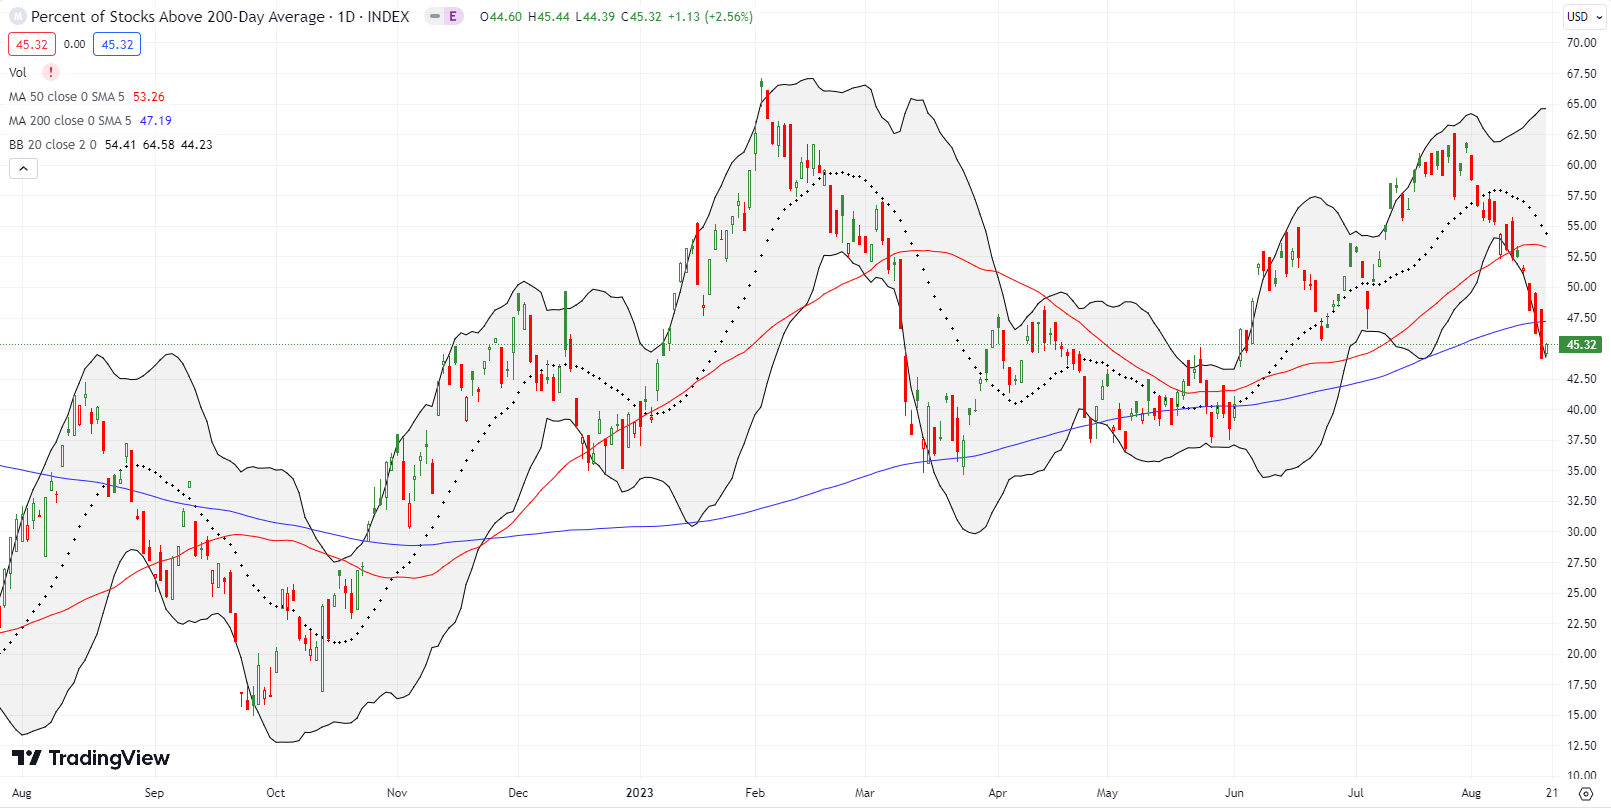
- AT200 (MMTH) = 45.3% of stocks are trading above their respective 200-day moving averages
- Short-term Trading Call: neutral (important bullish caveats below)
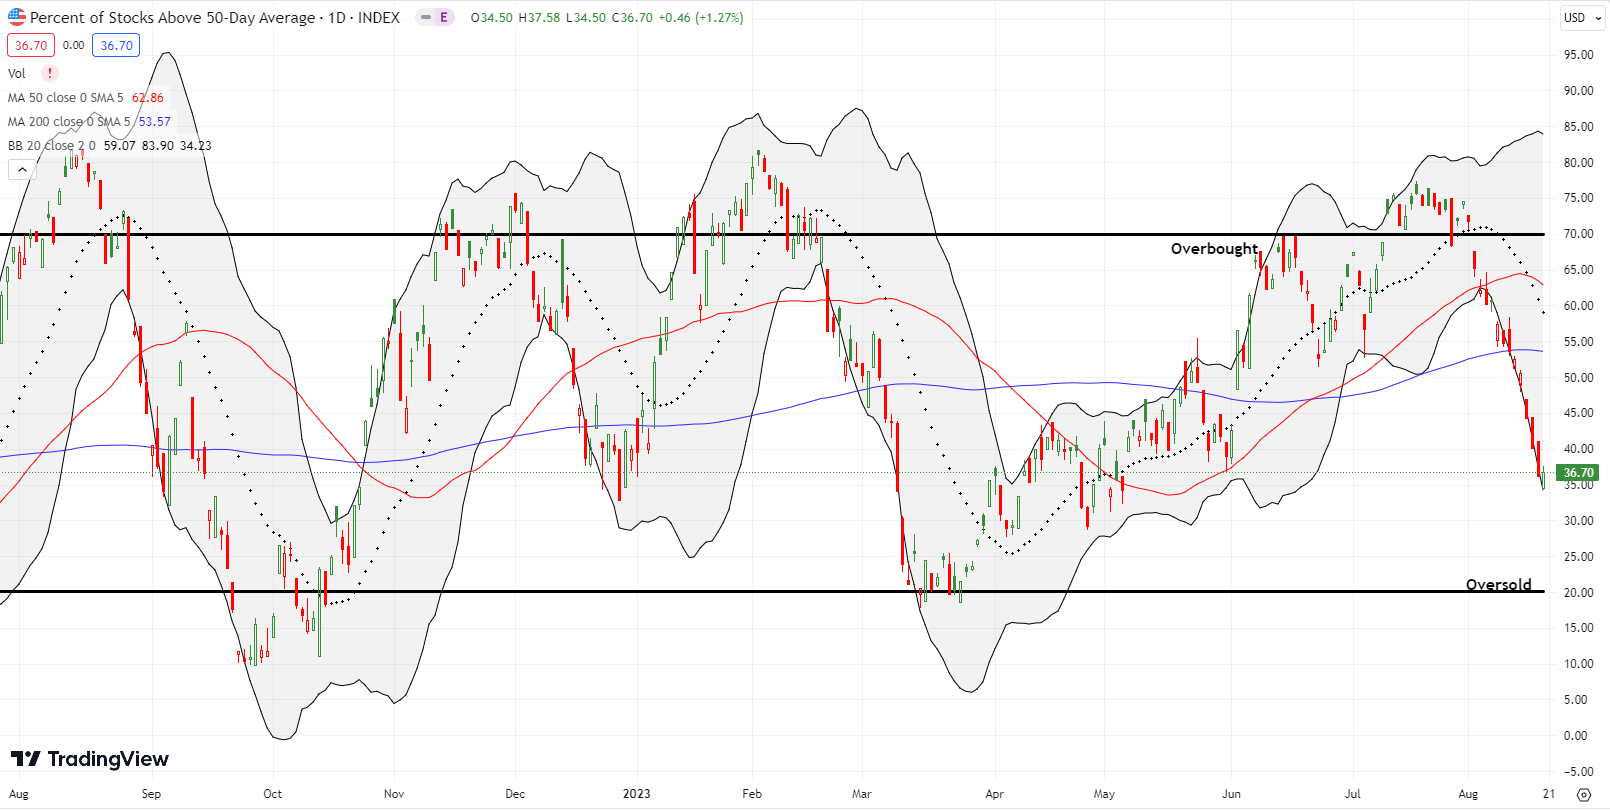
AT50 (MMFI), the percentage of stocks trading above their respective 50-day moving averages (DMAs), closed the week at 36.7%. My favorite technical indicator started the month above the overbought threshold and has declined nearly straight down since then.
When AT50 first dropped out of overbought conditions in dramatic fashion on July 27th, I did not flip bearish per the AT50 trading rules. Instead, I went neutral in deference to the prevailing uptrend in the indices. My ability to continue finding strong bullish setups in individual stocks validated my decision. AT50 even rebounded for one more overbought period before the current pullback picked up speed.
I finally focused more on bearish positions (put options) after the S&P 500 broke down below 50DMA support last Tuesday. The switch proved fruitful. Still, I am staying neutral because the pullback has been so steep and swift that sentiment is getting (short-term) extreme. At 36.7%, AT50 is in “close enough” to oversold territory. If the current pace of selling continues, AT50 could easily drop into official oversold territory by the time the Jackson Hole meeting starts on Friday. Fed Chair Jerome Powell would then have a perfect opportunity to juice up markets if such a serving is actually on the menu.
In the meantime, I am backing off the bearish positions and preparing for an oversold bounce. For example, I spent time this weekend looking at stocks that look ready to bounce off 50DMA support.
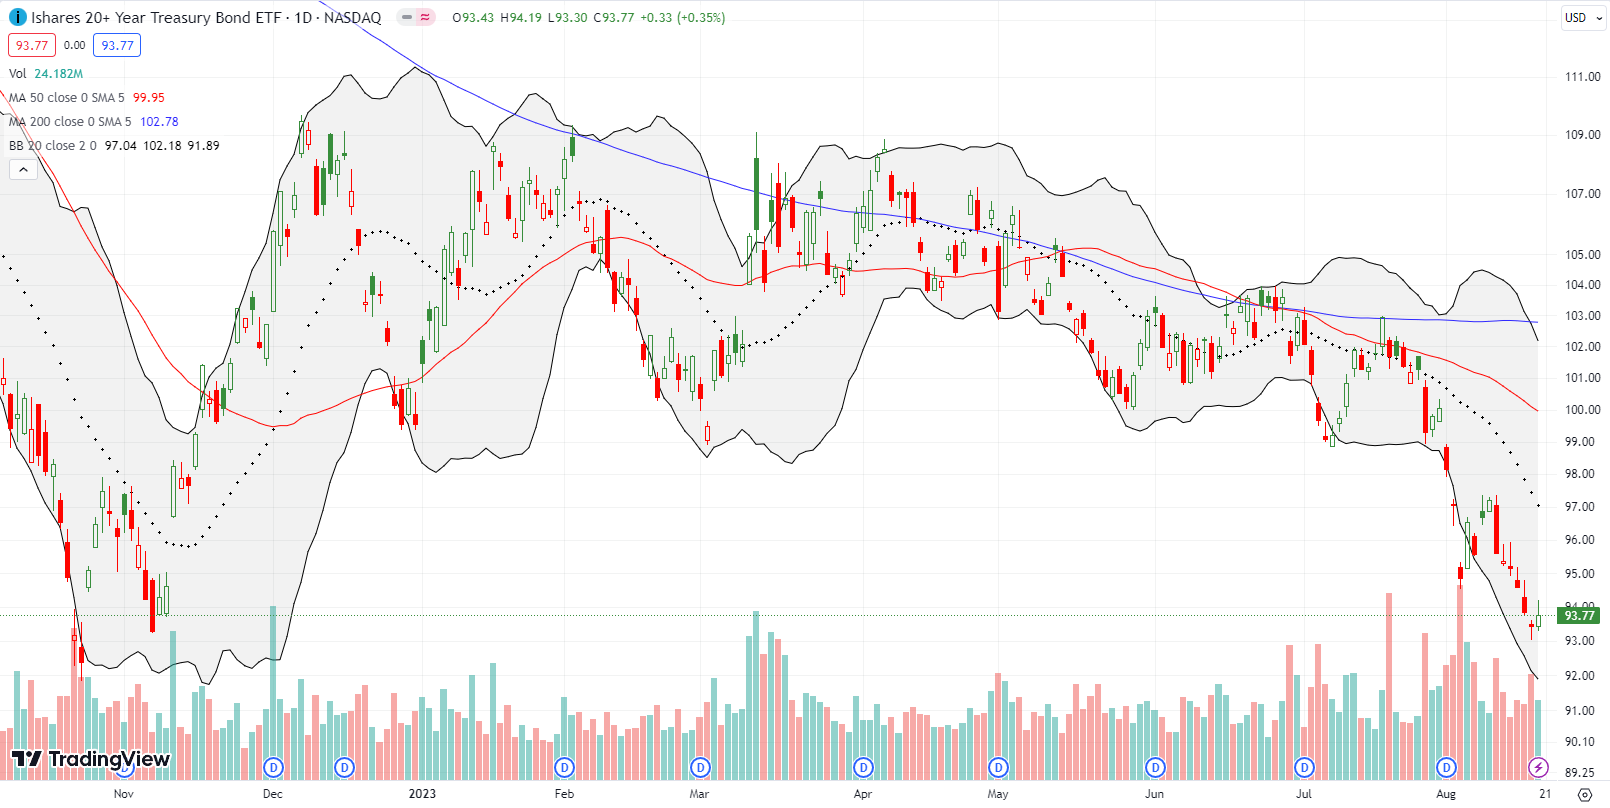
Soaring interest rates are at the center of the latest market drama. In early June, I pointed out how the resolution of the debt ceiling drama opened a need for a massive funding round for the U.S. government. Given the volatility of the iShares 20+ Year Treasury Bond ETF (TLT), my trading plan on this debt dynamic involved fading rallies with put options. That plan worked well although I had to chase the downdraft for one trade. If I had thought more of the likely fallout from higher rates, I might have flipped bearish instead of neutral at the end of July, especially with the most dangerous months of the stock market right around the corner. Also, in retrospect, I should have added shares of ProShares UltraShort 20+ Year Treasury (TBT) to my strategy as a more sustained way to stick to my bearish bond thesis.
These higher rates may finally force the Fed to tone down its hawkishness. Rates are not rising because of inflation or Fed fears. Instead, the U.S. government has to push a lot of debt into the market. All that supply is driving down prices (and increasing yields). When combined with Japan’s struggles to maintain ultra-low bond yields, the massive funding needs of other developed economies, and China’s current economic slowdown, bond markets are more and more nervous these days.
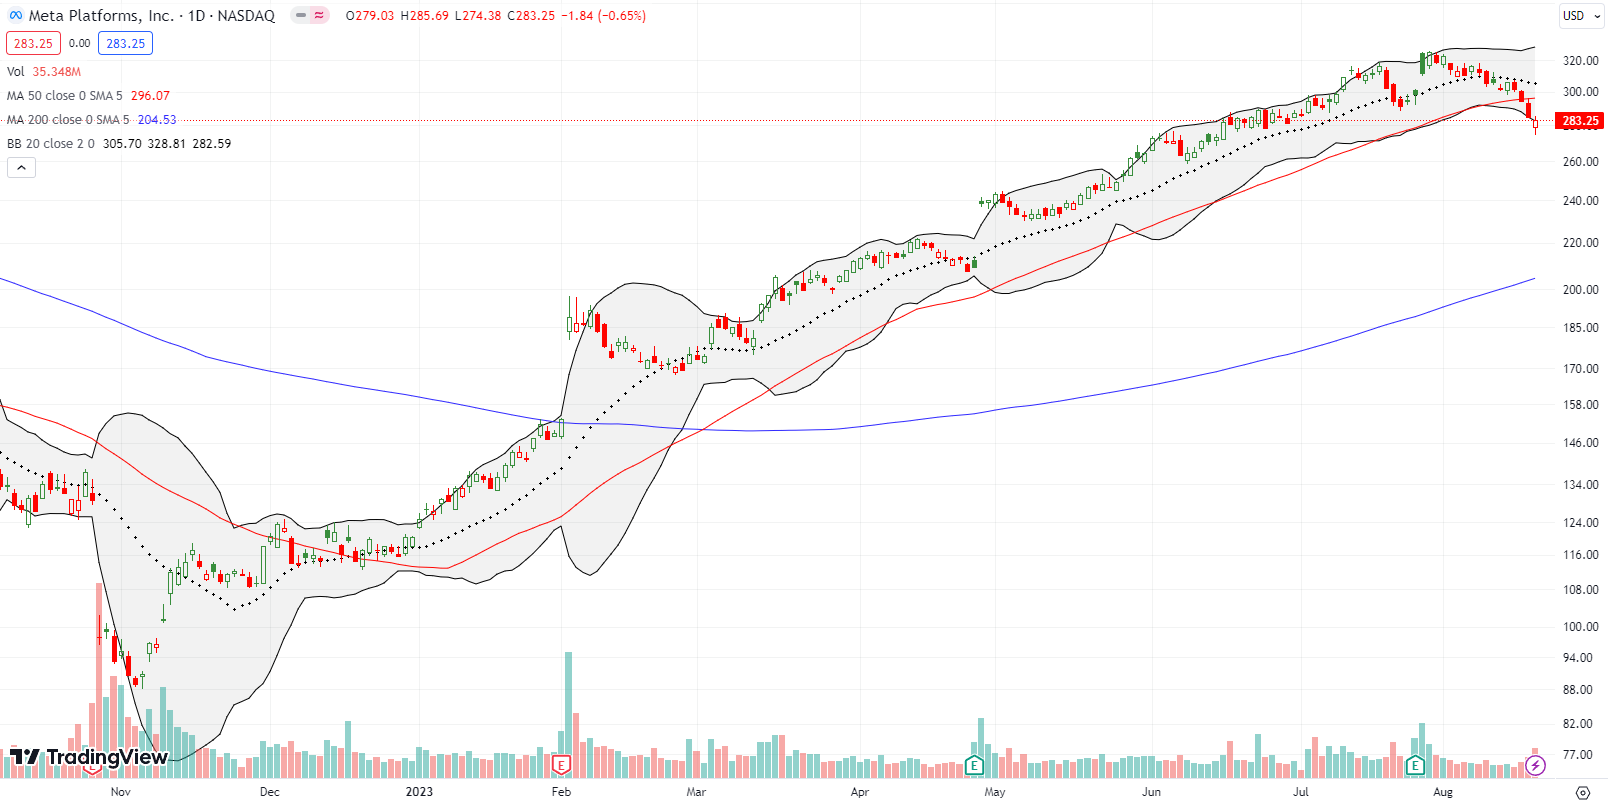
Meta Platforms, Inc (META) was one of my successful bearish positions last week. I jumped into a weekly put spread as soon as META followed up on its 50DMA breakdown (the red line in the chart below). I quickly took profits as META opened Friday below its lower BB. While I think the stock could still have plenty of downward momentum, it looks a bit over-stretched in the immediate term. META last traded below its 50DMA in December, so it has PLENTY of downside potential in a bigger sell-off.
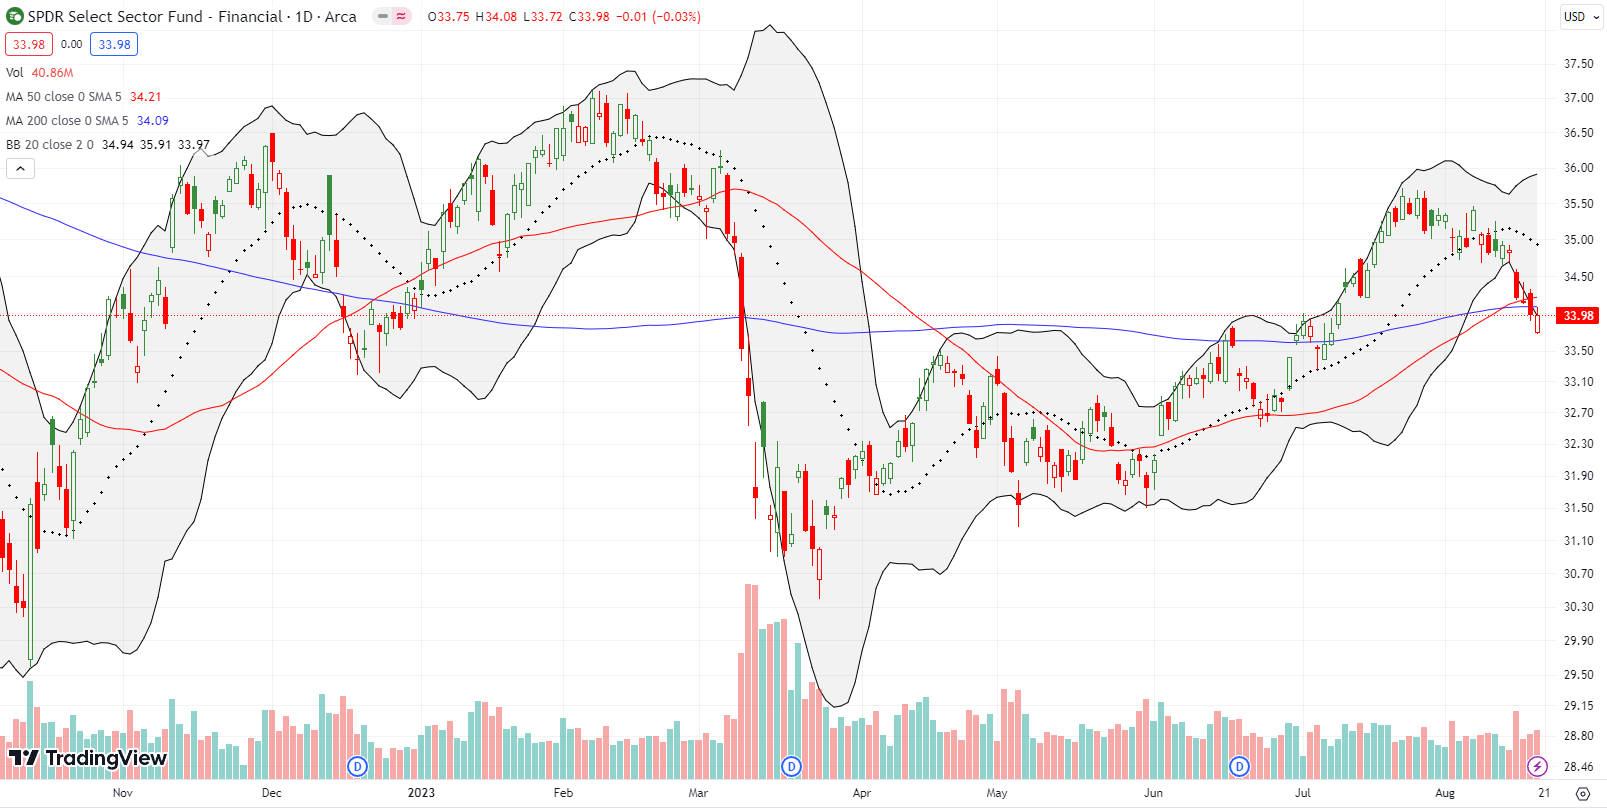
Financials were surprisingly resilient coming into August. Now they too are stumbling. The Financial Select Sector Fund (XLF) made a bearish move with a breakdown below its converged 50DMA and 200DMA. With interest rates spiraling higher and rating agencies downgrading banks and US debt, I am now turning a wary eye toward financial institutions. I am specifically avoiding them even in an oversold trading period.
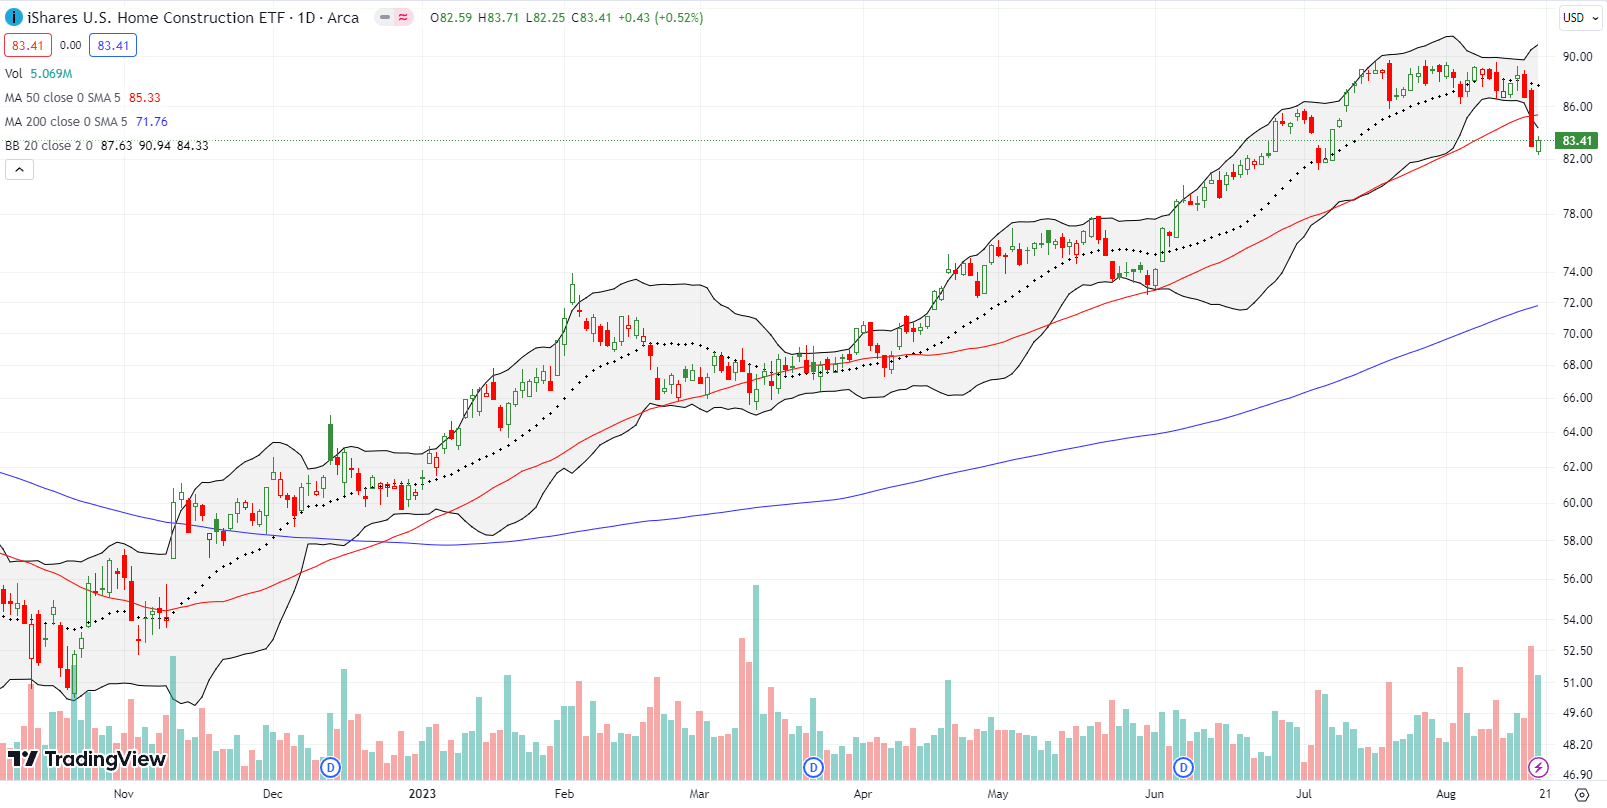
Home builders have remained amazingly resilient all year. Even as the S&P 500 lost all its July gains, the iShares US Home Construction ETF (ITB) mainly churned in place. That resilience ended in one big swoosh on Thursday with a 4.3% pullback. ITB last lost this much in a single day during last October’s lows. Suddenly, a slight summer cooling looks like it could spread into a freeze over housing-related stocks.
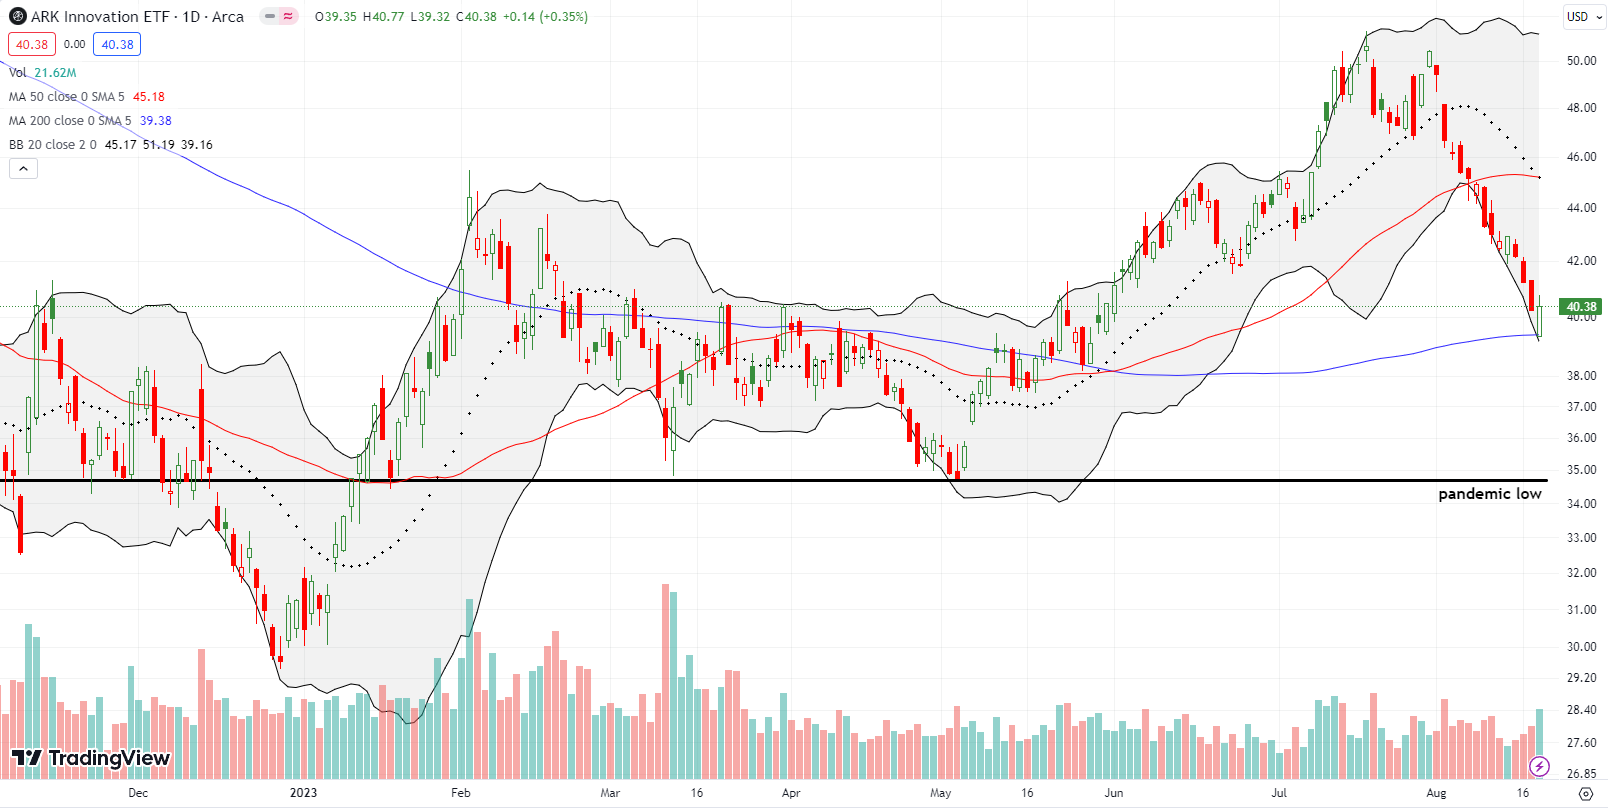
When I last wrote about ARK Innovation ETF (ARKK), I realized I had yet to create a new trading strategy for the market’s most loved and hated vehicle of speculation. A subsequent pullback to 20DMA support (the dashed line) gave me my first opportunity. I opened a covered call position. That call expired worthless, and I shorted a fresh call. ARKK has fallen ever since. I opened a fresh covered call position as ARKK tested 200DMA support (the bluish line).
While ARKK is still up 29.3% year-to-date, the ETF is now in a new bear market with a 20% pullback from its last high. Moreover, ARKK is well below the former high of the year from February, not to mention ARKK is still down a gut-wrenching 74% from its all-time high. In other words, ARKK may be a good short-term trade when speculative fever is alive and well, but it is overall an awful investment. ARKK could easily plunge back to its pandemic low if the general stock market continues to sell off. My strategy counts on ARKK “eventually” regaining steam whenever animal spirits revisit the stock market.
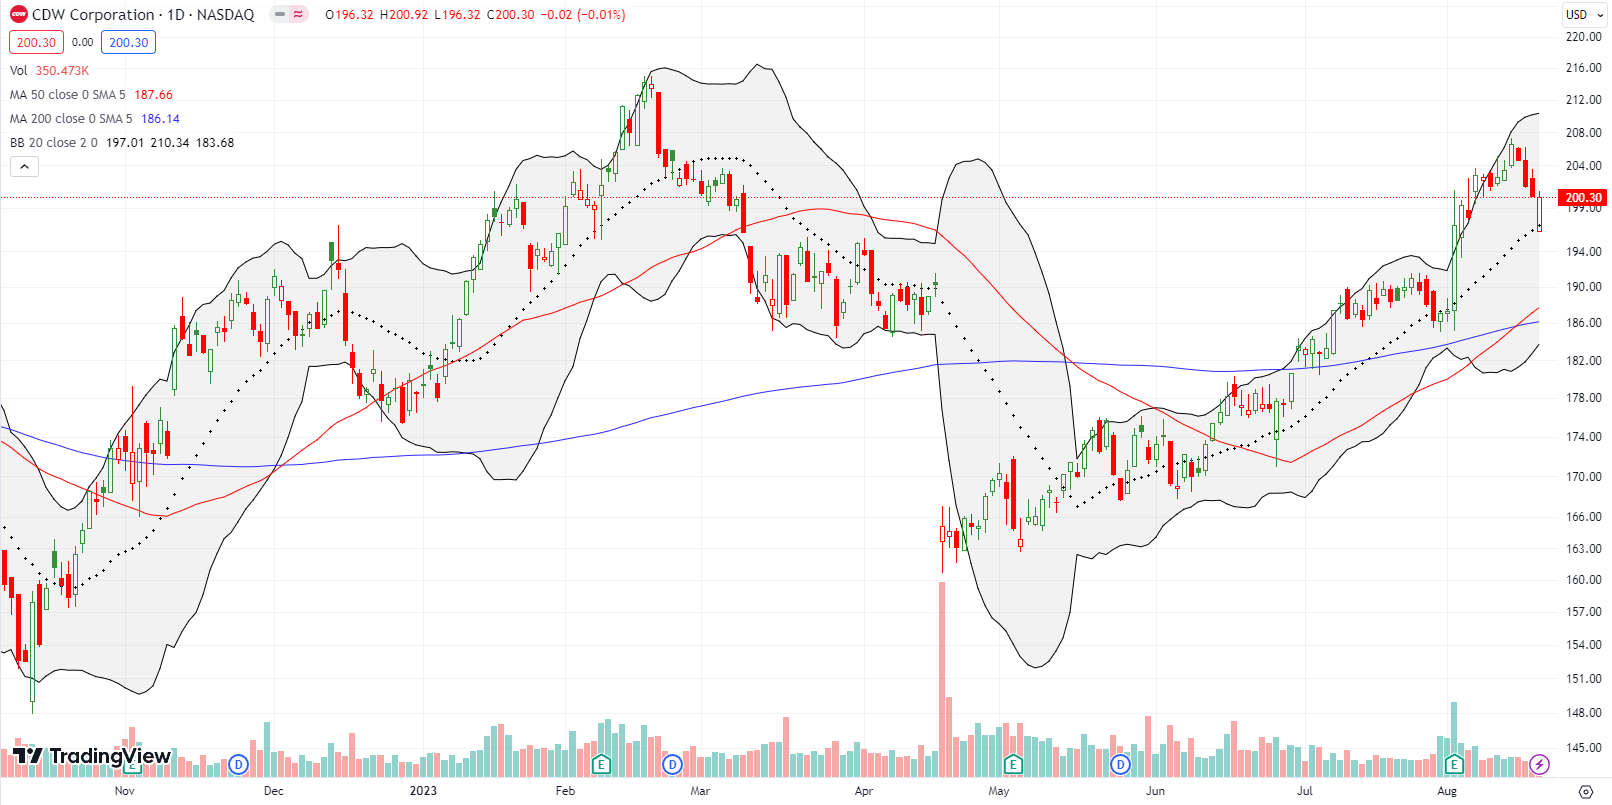
The surprising comeback for CDW Corporation (CDW) finally stalled last week. Still, buyers stepped in at 20DMA support and nearly closed the day’s gap down. This is a stock where the market seems to have no idea what is going on. Since the 13% plunge on an earnings warning raised concerns about enterprise IT spending, CDW never traded lower. CDW closed the gap on a 5.2% post-earnings surge earlier this month. The stock is well out-performing a hobbled market this month.
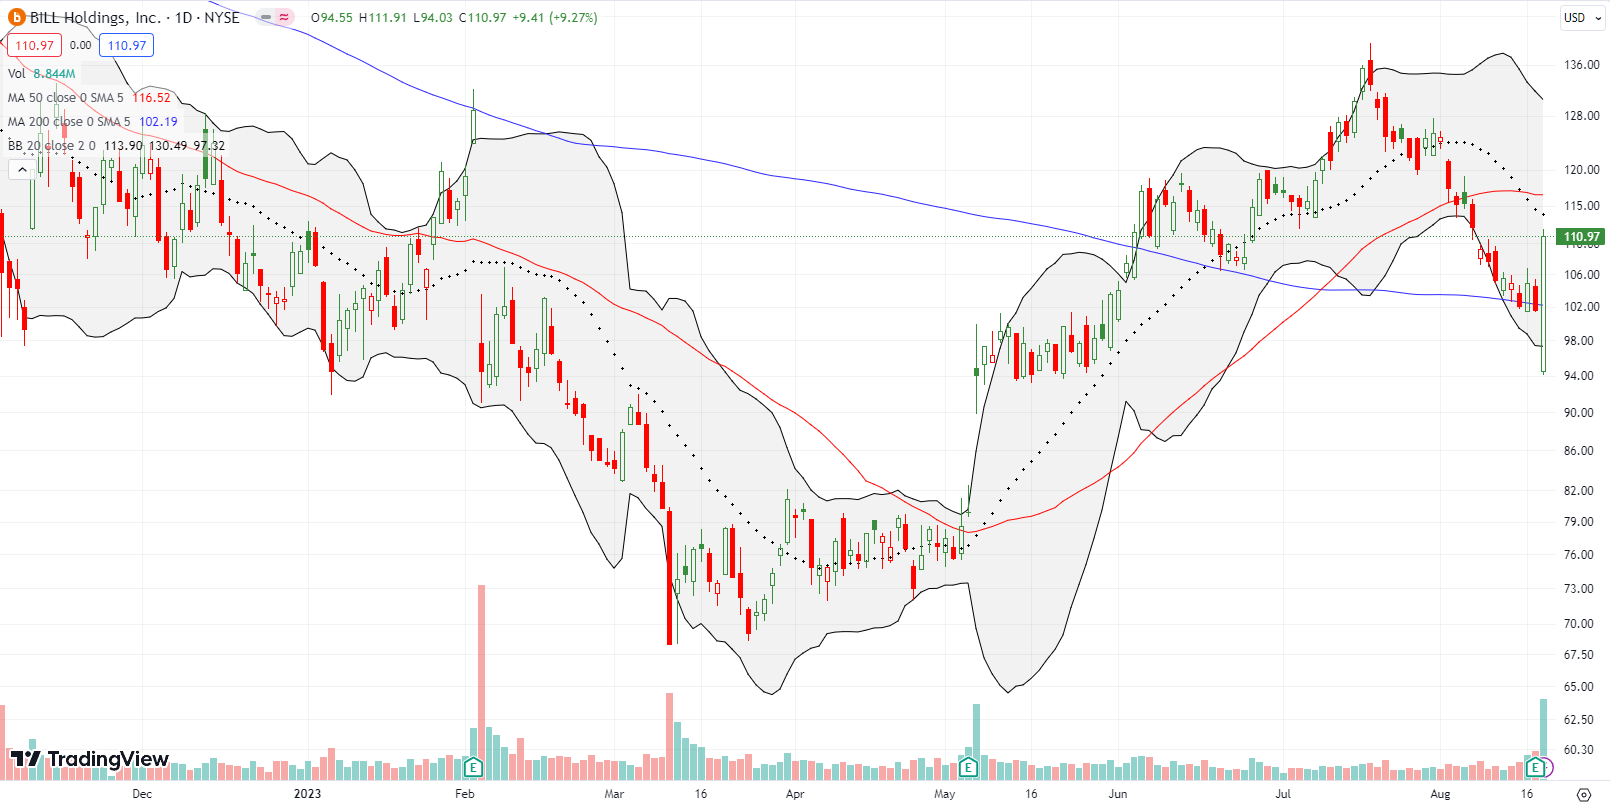
Last week, I saw two dramatic examples of post-earnings turn-arounds. Paycheck processor BILL Holdings (BILL) was down about 9% in the pre-market following its earnings report the previous evening. Buyers stepped into gap and barely looked back. BILL closed with a 9.3% GAIN on the day. The resulting bullish engulfing pattern looks like a bottom especially with the stock holding 200DMA support. Seeing this kind of trading action motivates me to look for rebounds this week.
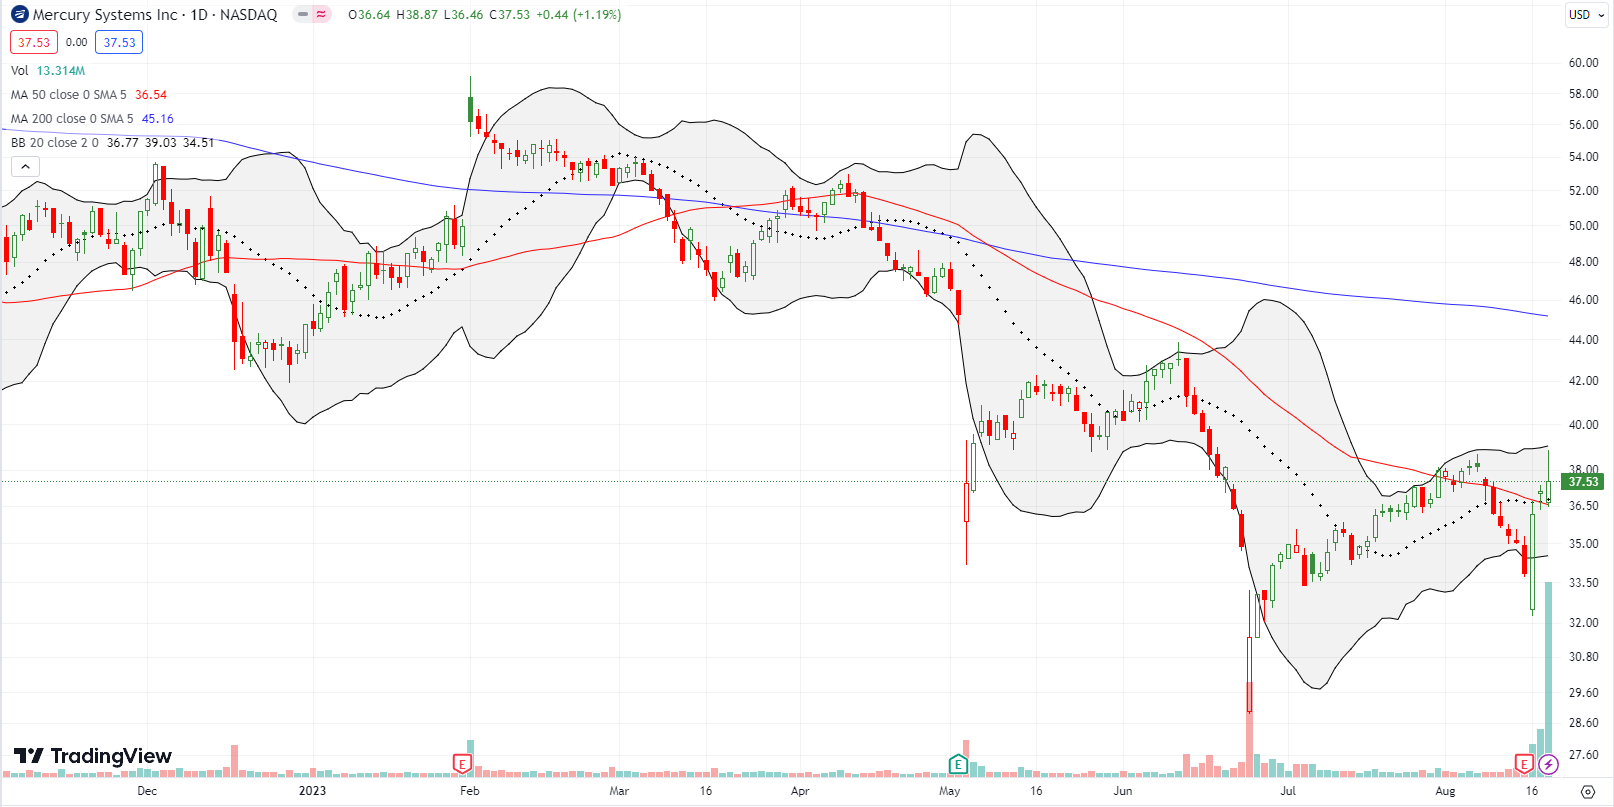
Mercury Systems Inc (MRCY) was down as much as 10% in the after market following its earnings report. It opened the next day down just 5% or so and buyers continued from there. The dust settled on a 6.9% gain and closed right below 50DMA resistance. The buying continued until sellers faded MRCY from resistance at the high of the previous 50DMA breakout. While I have no idea what flipped sentiment on BILL, I suspect trading in MRCY was distorted by a “demotion” from the S&P MidCap 400 to the S&P SmallCap 600. Indexers had to buy and sell shares so maybe the shares needed in the new index are greater than the ones eliminated in the old index…?
Be careful out there!
Footnotes
Subscribe for free to get email notifications of future posts!
“Above the 50” (AT50) uses the percentage of stocks trading above their respective 50-day moving averages (DMAs) to measure breadth in the stock market. Breadth defines the distribution of participation in a rally or sell-off. As a result, AT50 identifies extremes in market sentiment that are likely to reverse. Above the 50 is my alternative name for “MMFI” which is a symbol TradingView.com and other chart vendors use for this breadth indicator. Learn more about AT50 on my Market Breadth Resource Page. AT200, or MMTH, measures the percentage of stocks trading above their respective 200DMAs.
Active AT50 periods: Day #99 over 20%, Day #73 over 30% (overperiod), Day #2 under 40% (underperiod), Day #56 over 50%, Day #9 under 60%, Day #13 under 70%
Source for charts unless otherwise noted: TradingView.com
Full disclosure: long ARKK shares and short a call option, long ITB, long IWM call spread
FOLLOW Dr. Duru’s commentary on financial markets via StockTwits, Twitter, and even Instagram!
*Charting notes: Stock prices are not adjusted for dividends. Candlestick charts use hollow bodies: open candles indicate a close higher than the open, filled candles indicate an open higher than the close.


1 thought on “Jackson Hole Redux: Stock Indices Are Back Where They Started – The Market Breadth”