Stock Market Commentary:
Flying on the wings of an AI (artificial intelligence) gold rush, the NASDAQ may have delivered the swan song for its bear market. The latest rush of buying, sent the NASDAQ above its bear market line for the first time since last August. The path to this breakthrough was fraught with yet one more setback as debt ceiling drama temporarily frightened traders and stories of a new COVID wave in China triggered flashbacks. Yet there were little signs of worry by the end of the week. With continued momentum the swan song of the bear market could transform into the melodies of a summer of loving stocks.
The Stock Market Indices
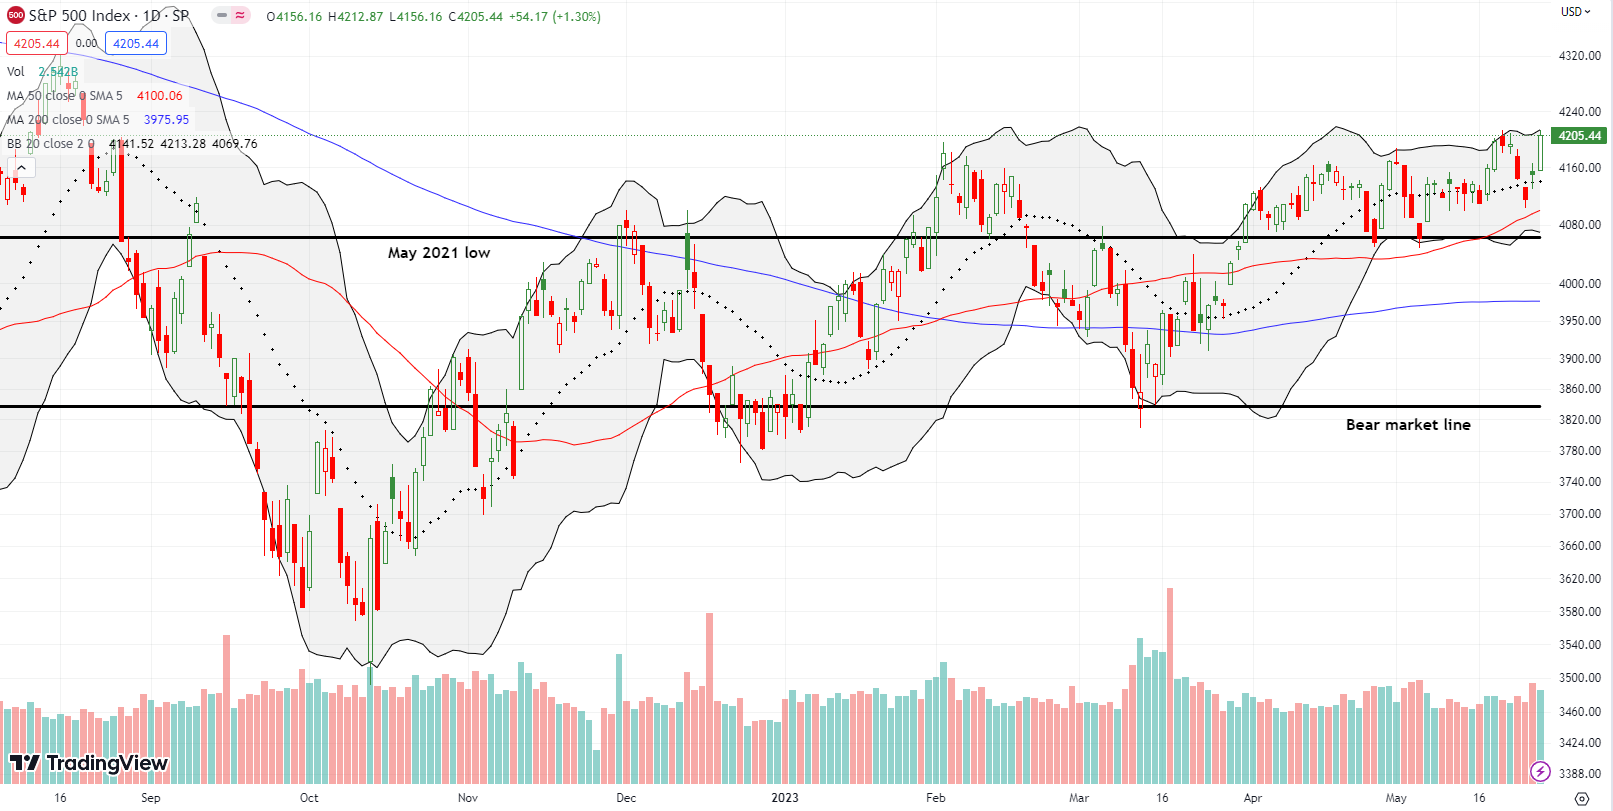
The S&P 500 (SPY) gained 1.3% and closed at a 9-month high. The index has finally reversed all its losses from Powell’s Jackson Hole slam, albeit marginally. This breakout is also the index’s second attempt to hold a new high for the year. Even if sellers push the S&P 500 back again, it seems to me the bullish writing is on the wall. The path of least resistance is higher.
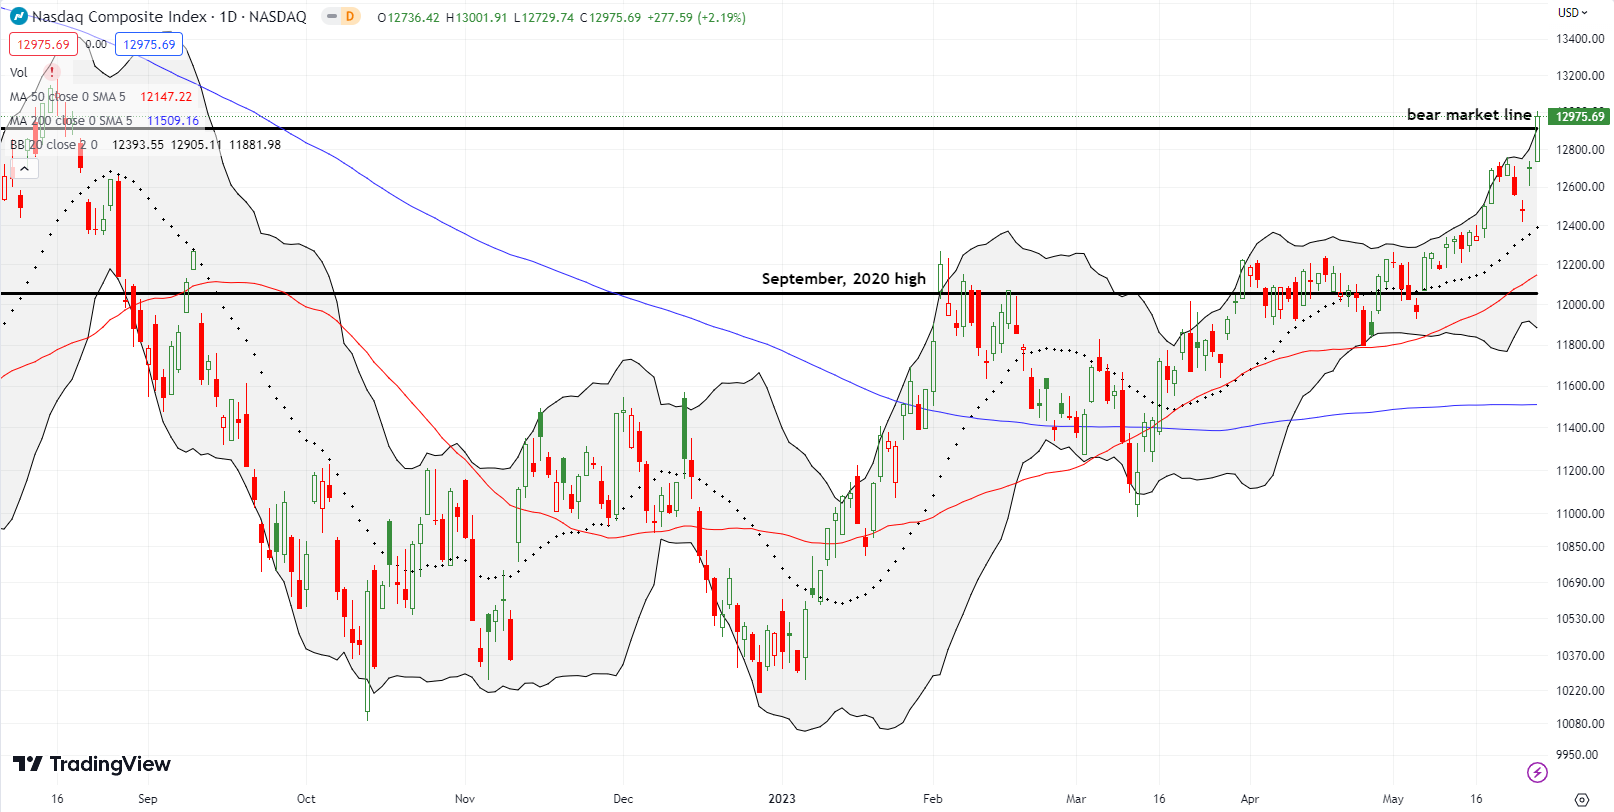
The NASDAQ (COMPQ) promptly pulled back from the previous week’s breakout. I was waiting for a test of uptrending support at the 20-day moving average (DMA) (the dashed line in the chart below), but buyers had plans other than waiting. On Thursday, the NASDAQ gapped higher for a 1.7% gain thanks to the fresh gold rush into AI-related trades. The week ended with follow-through buying and a swan song. The NASDAQ gained 2.2%, planted a 9-month high, and brought its bear market to an end. Buyers now look ready to test the August, 2022 high at 13,132. If buyers shatter that resistance level, I will brace for the song a new bull market…a prospect that seems surreal given all the political and economic headwinds in front of us.
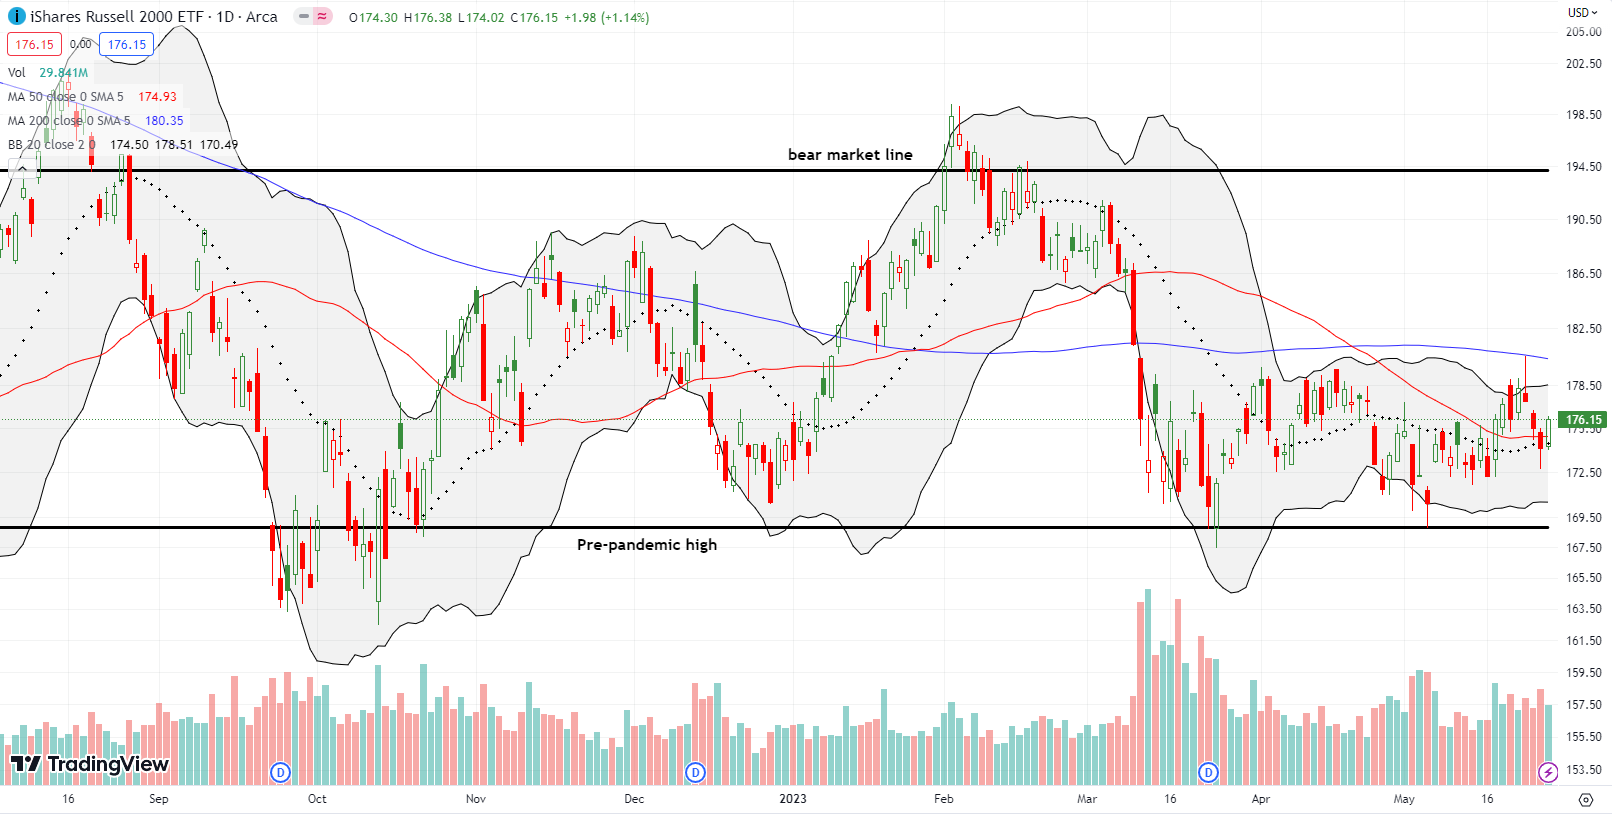
The iShares Russell 2000 ETF (IWM) pulled back for three days after perfectly failing at 200DMA resistance. The ETF of small caps even broke down below 50DMA (the red line) and 20DMA support on Thursday. The buying pressure on Friday in the stock market was enough to nudge IWM for a 1.1% gain. IWM also recovered the 20DMA and 50DMA for support. IWM’s growing under-performance is a prime driver of a divergence in market breadth.
Stock Market Volatility
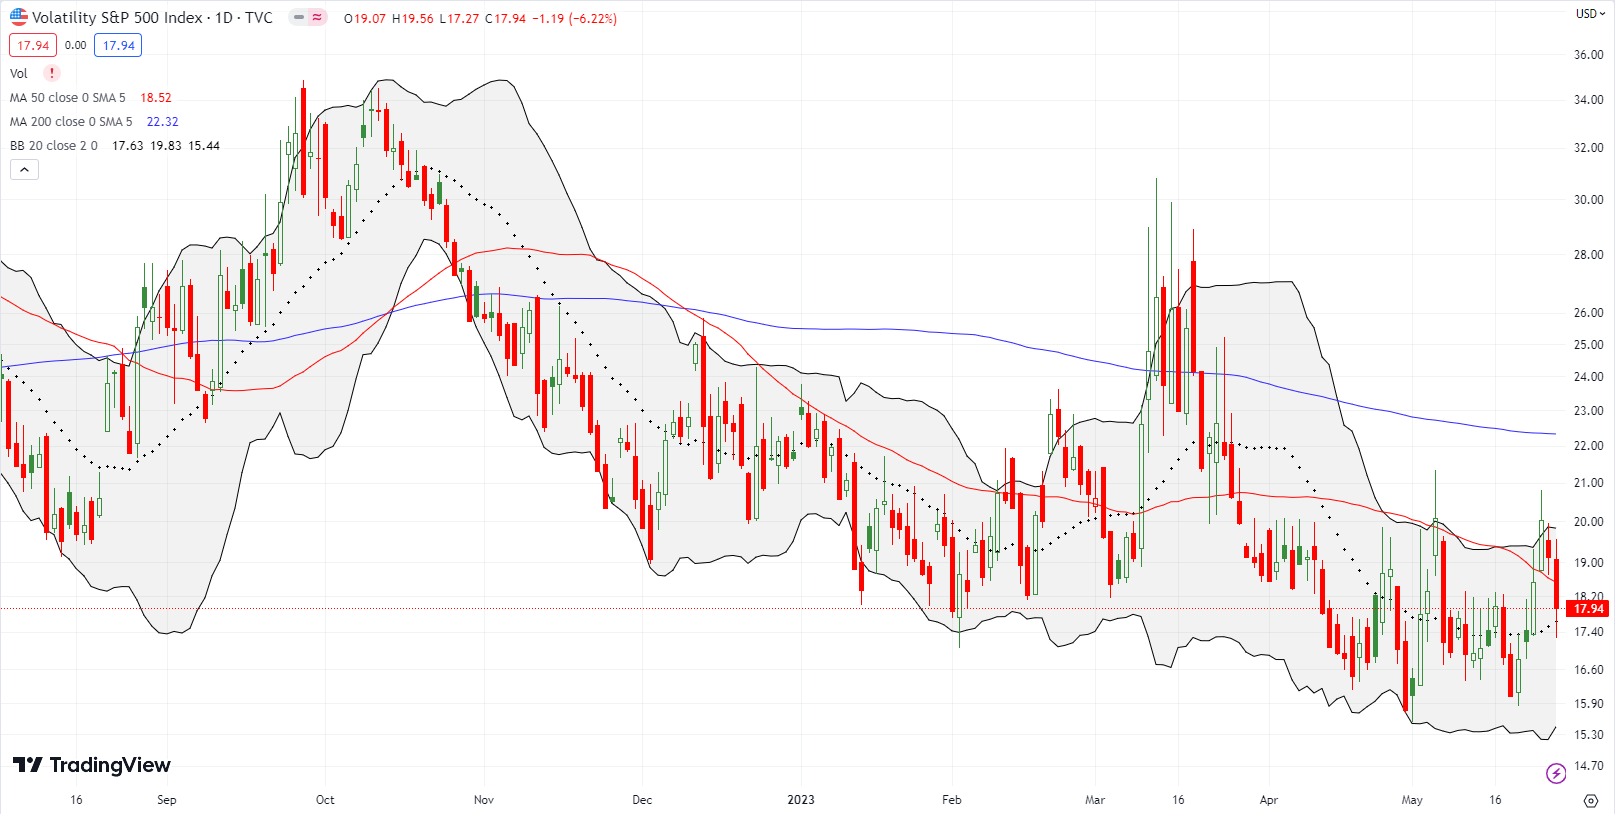
The volatility index (VIX) continued its wake-up call from the previous week and managed to gain 3 more days in a row. However, Wednesday’s fade back to the critical 20 level was an ominous end of the momentum. Faders pushed the VIX for the next two days. I was one day late in jumping on the bandwagon with a fresh put spread on the iPath Series B S&P 500 VIX Short-Term Futures ETN (VXX).
The Short-Term Trading Call With A Bear Market Swan Song
- AT50 (MMFI) = 47.6% of stocks are trading above their respective 50-day moving averages
- AT200 (MMTH) = 42.0% of stocks are trading above their respective 200-day moving averages
- Short-term Trading Call: cautiously bullish
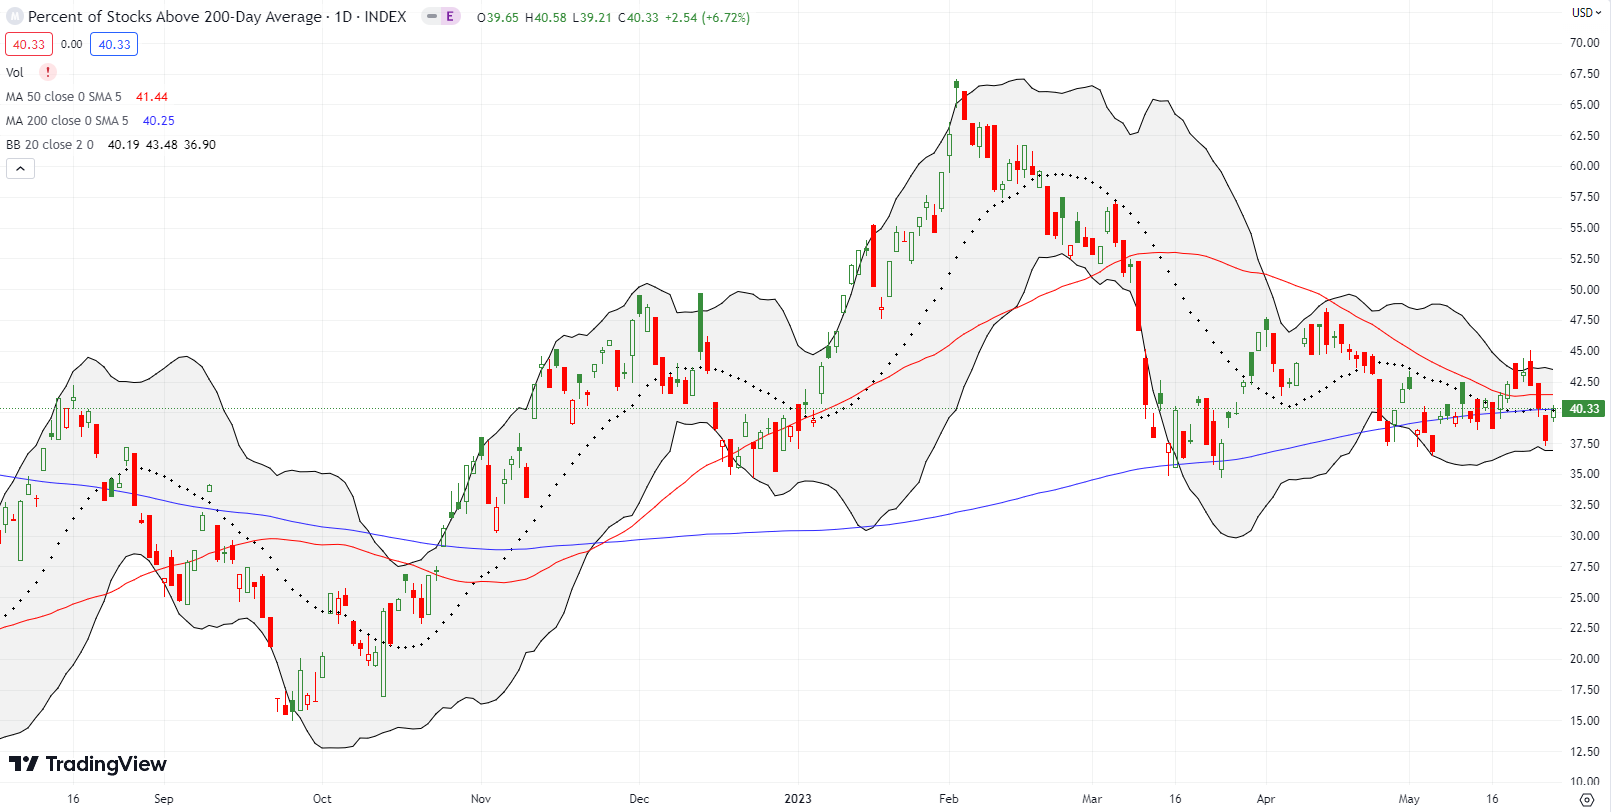
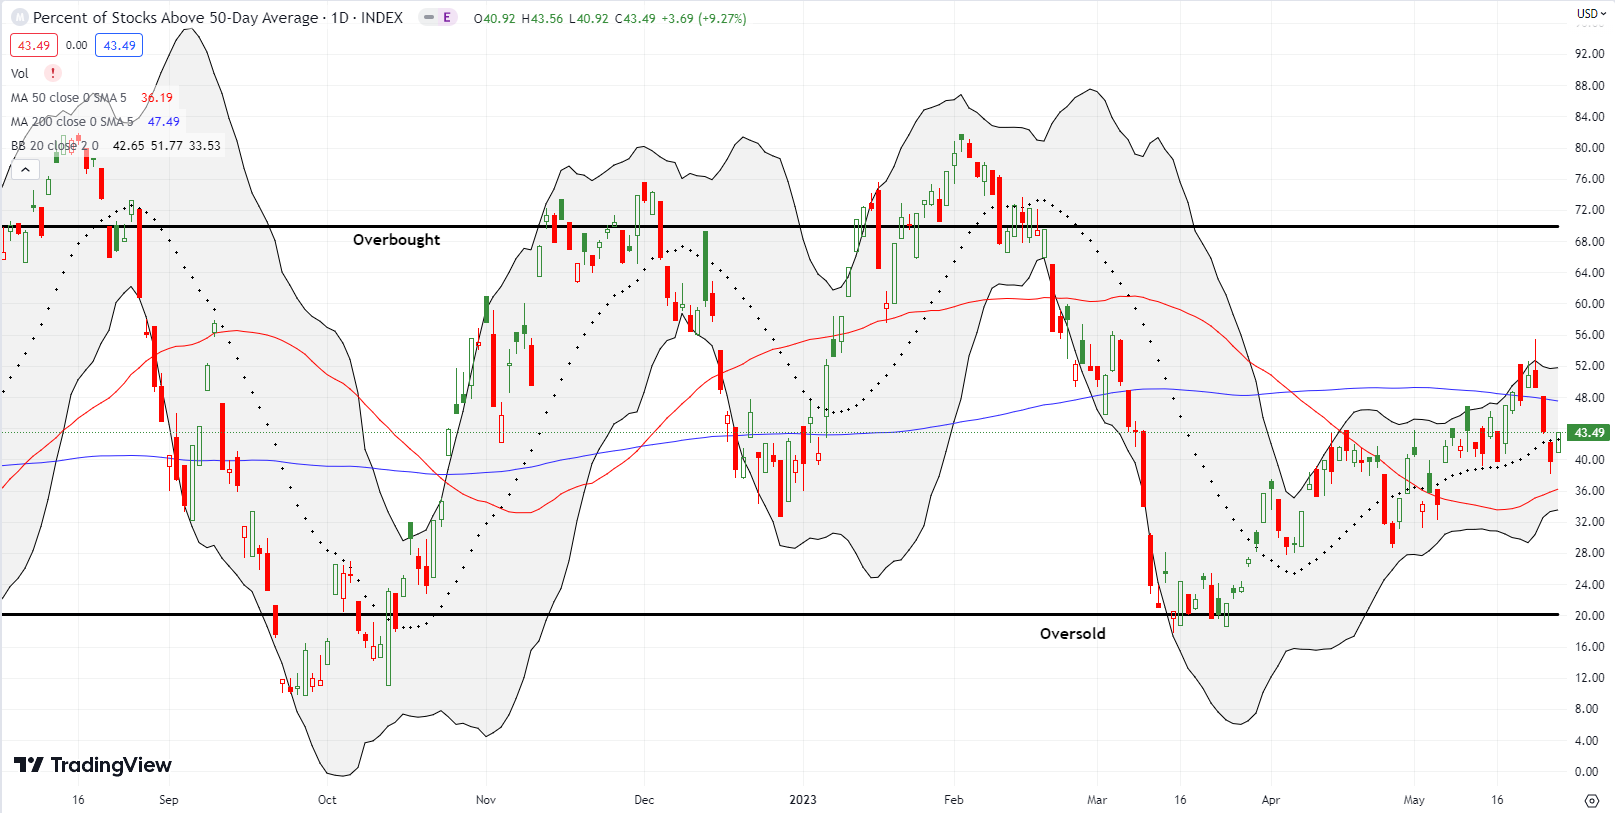
AT50 (MMFI), the percentage of stocks trading above their respective 50DMAs, followed IWM lower for the middle three days of the week. My favorite technical indicator jumped on Friday for a close at 47.6%. The increasing lag behind the other major indices, especially the NASDAQ, means a potential bearish divergence is opening up. For now, I am not worried because both the S&P 500 and the NASDAQ are in breakout territory. I will get worried if the next tests of important overhead resistance occur with AT50 continuing to lag. AT200, the percentage of stocks trading above their respective 200DMAs, looks worse than AT50. That indicator of longer-term market breadth spent all of May stuck in a trading range.
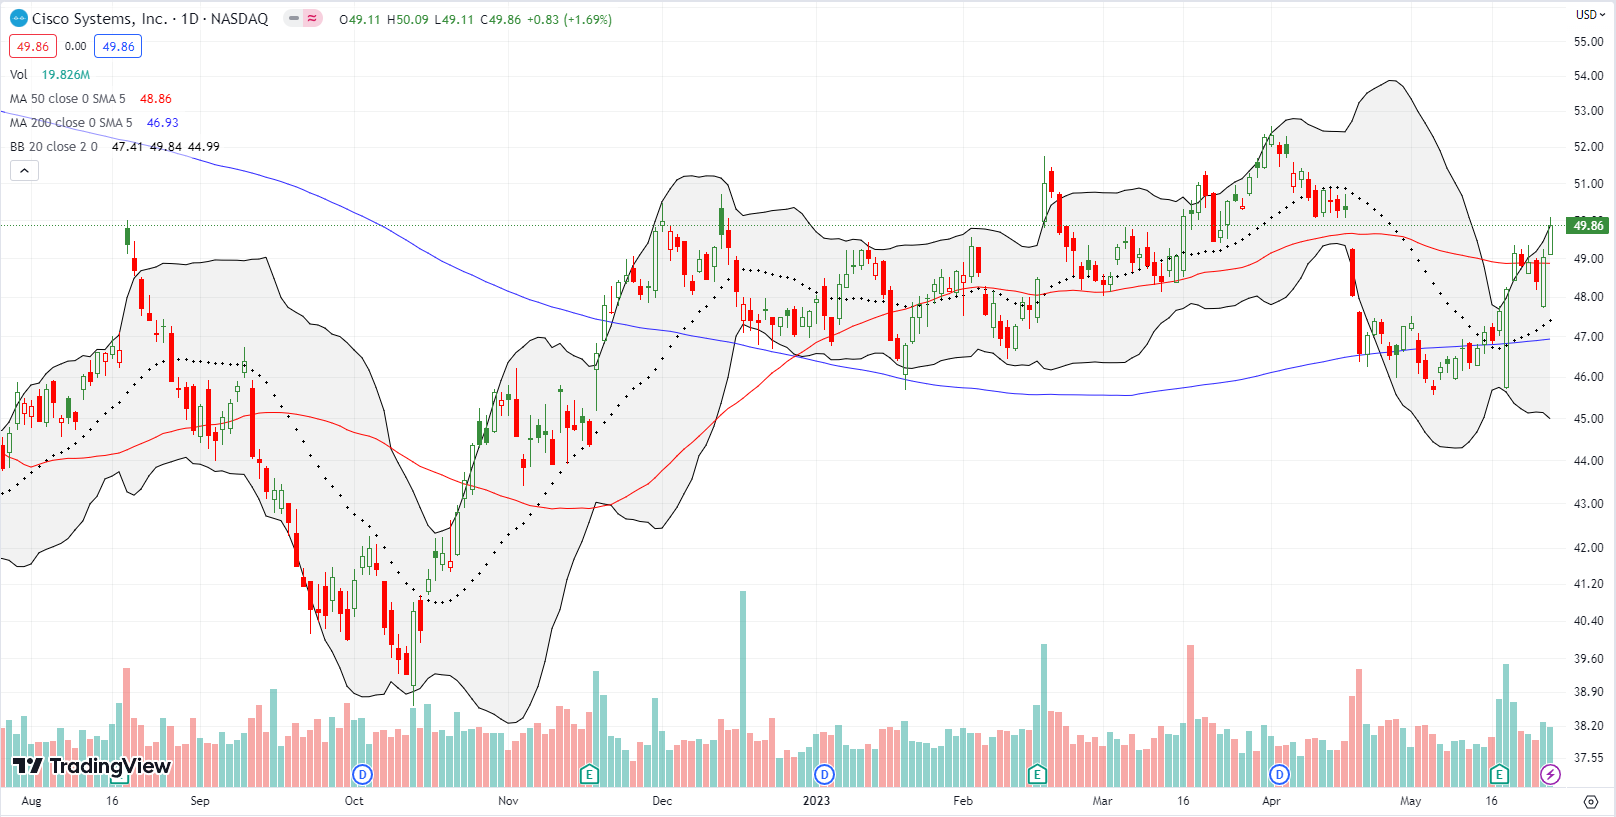
I pointed to Cisco Systems, Inc (CSCO) a week ago as a buy on a breakout. Friday delivered the desired breakout with a confirmed push above the 50DMA. I was too slow with my purchase, so I am now eagerly awaiting a fresh opportunity in the coming week. The good folks at CNBC’s Options Action also took note of CSCO on Friday….
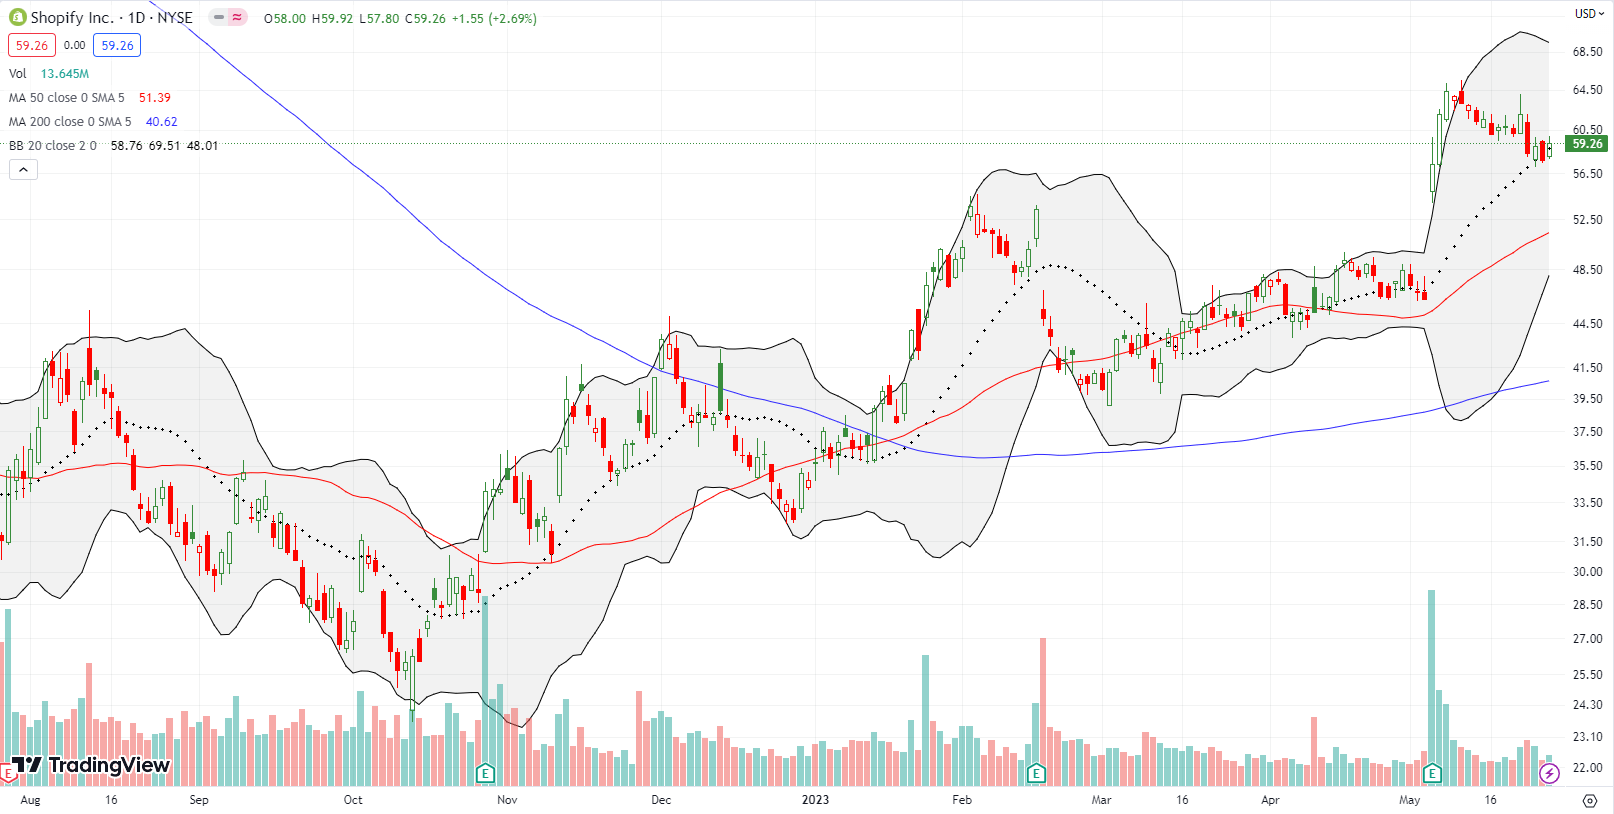
Shopify, Inc (SHOP) has been on my radar all year. The stock has to its credit a convincing bearish to bullish reversal. My latest trade is a June 60/65 call spread after SHOP tested uptrending 20DMA support. Note the convincing 23.8% post-earnings surge earlier in May.
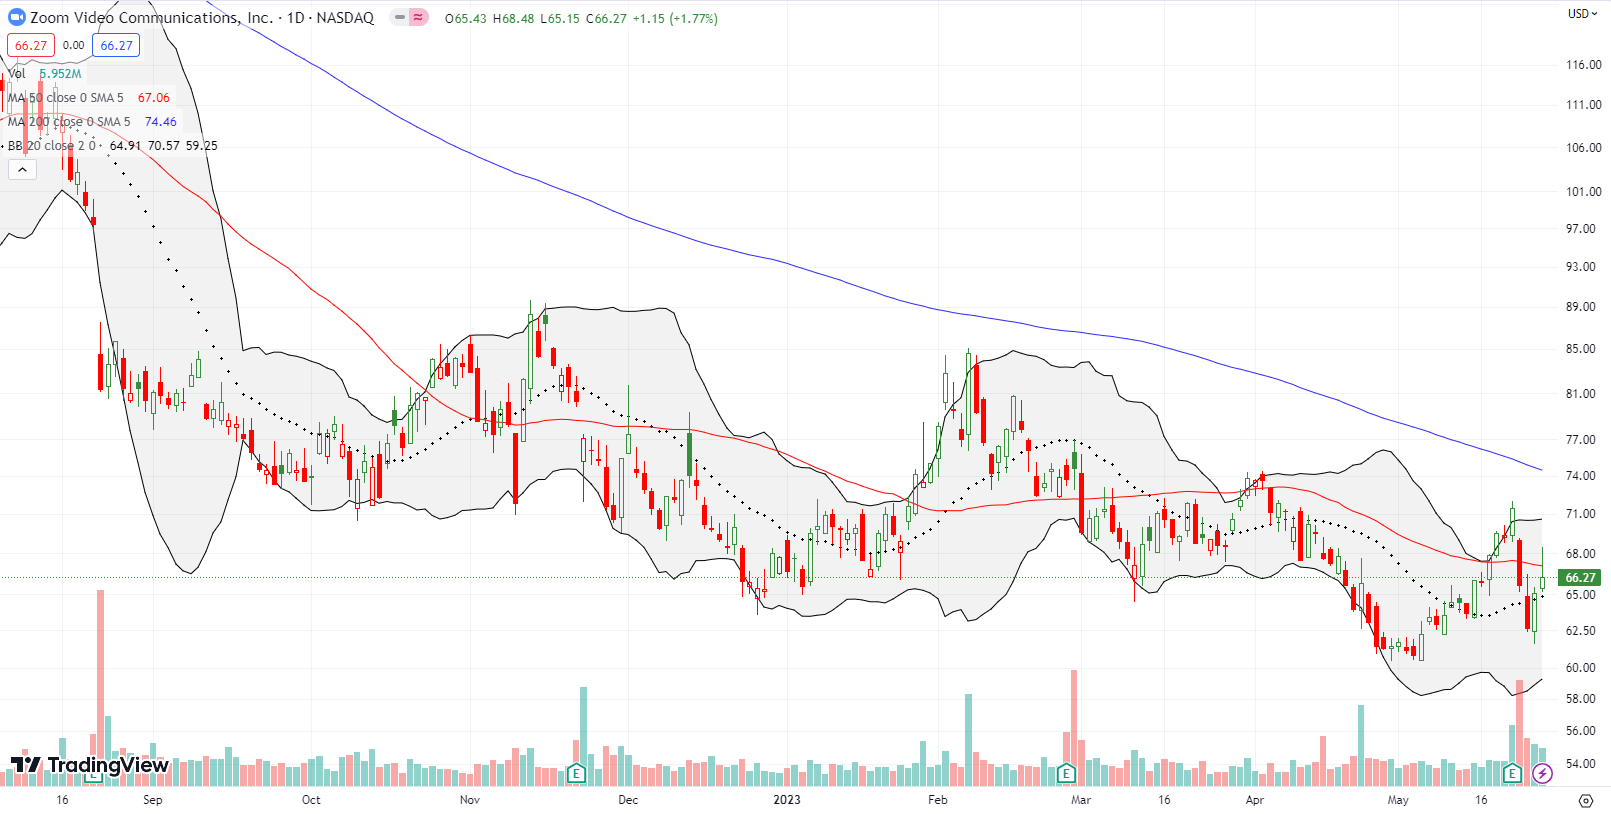
I have long been bearish on Zoom Video Communications, Inc (ZM). Last week, I finally flipped bullish. My change in heart came after the stock fell 8.1% post-earnings despite the company increasing guidance. My contrarian spirit roused further after reading a critical Yahoo Finance article that observed ZM’s weakness despite numerous references to AI. Zoom has been using AI long before the word became part of a mania. So the aspersion seemed misplaced. Moreover, an analyst downgraded ZM from under-perform, and the average price target is $77. ZM. Taken together these events look like an important juncture where sellers finally exhaust themselves of reasons to dump more ZM.
ZM may have limited upside in the short-term, but the downside could be even more limited. I went after ZM on Friday with a July/June 65/70 calendar call spread. I will extend the trade with a new short call if the short June 70 call expires worthless
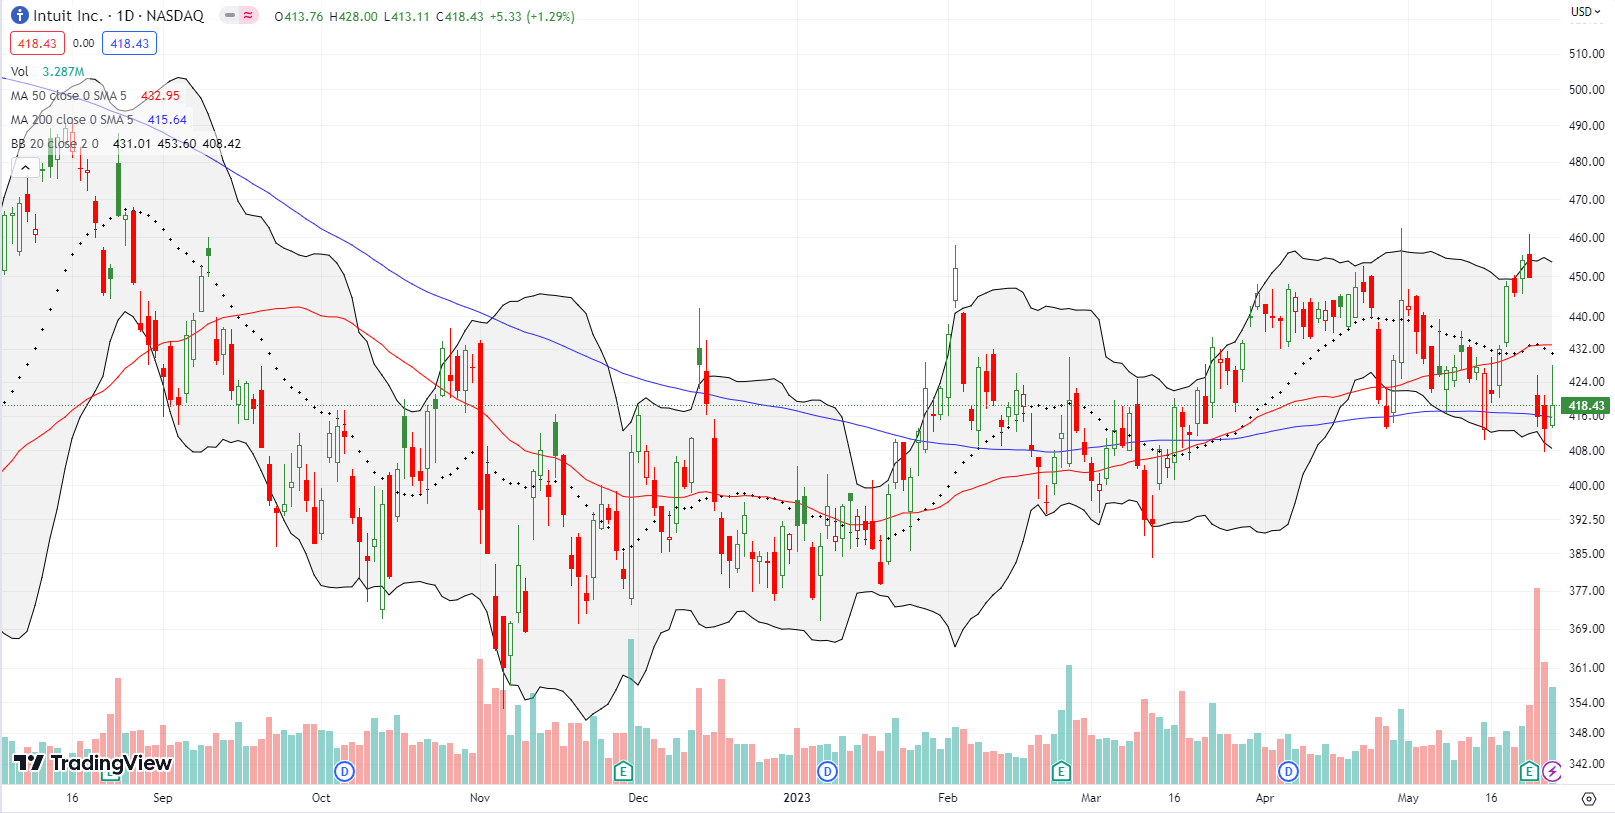
I made the bullish case for Intuit, Inc (INTU) a year ago. The stock had a strong run soon after that piece, but next it spent most of the past year churning in a (frustrating) range. I finally took profits two weeks ago after reading news about potential IRS plans for its own tax-filing system. Contrarians bought into the news and sent INTU right back to the top of the most recent range. INTU promptly disappointed these brave buyers with a 7.5% post-earnings loss.
A government-run tax-filing system is overdue as an alternative option. Hopefully this is the first step towards major overhauls which include reducing the filing burden where the IRS already collects financial data from other sources like employers and brokers. Needless to say, I am not likely to buy INTU again!
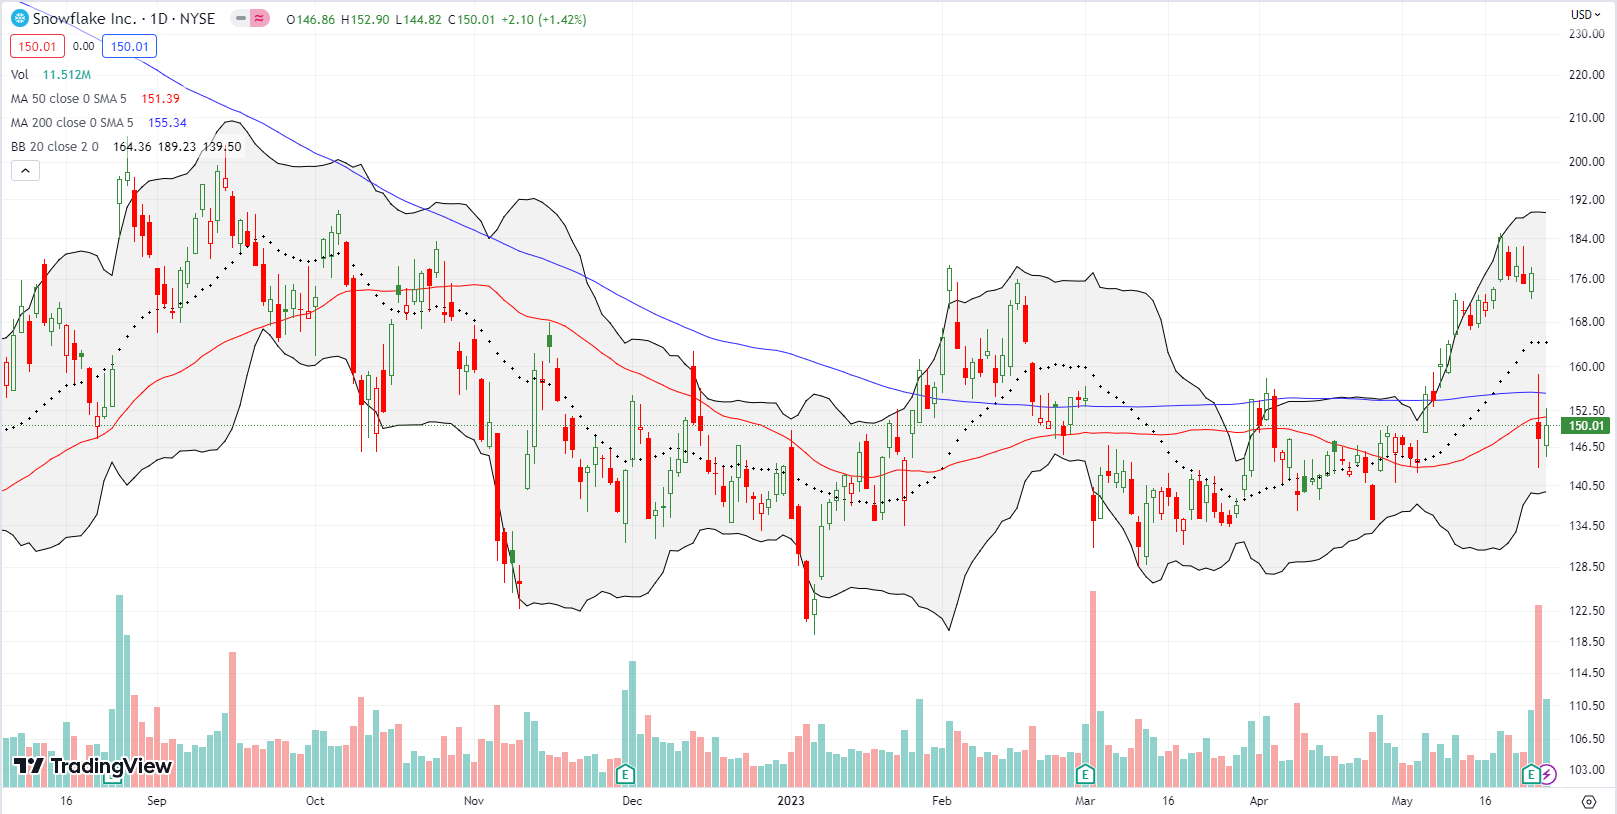
In my prior “Market Breadth” I admired the breakout on Snowflake Inc (SNOW) but warned about the coming earnings wildcard. SNOW fully disappointed. A 16.5% post-earnings loss plunged the stock right back into the middle of the previous trading range. Given the increasingly bullish tone of the market, especially for tech, I will watch SNOW for the next sign of life, like a close above its 200DMA.
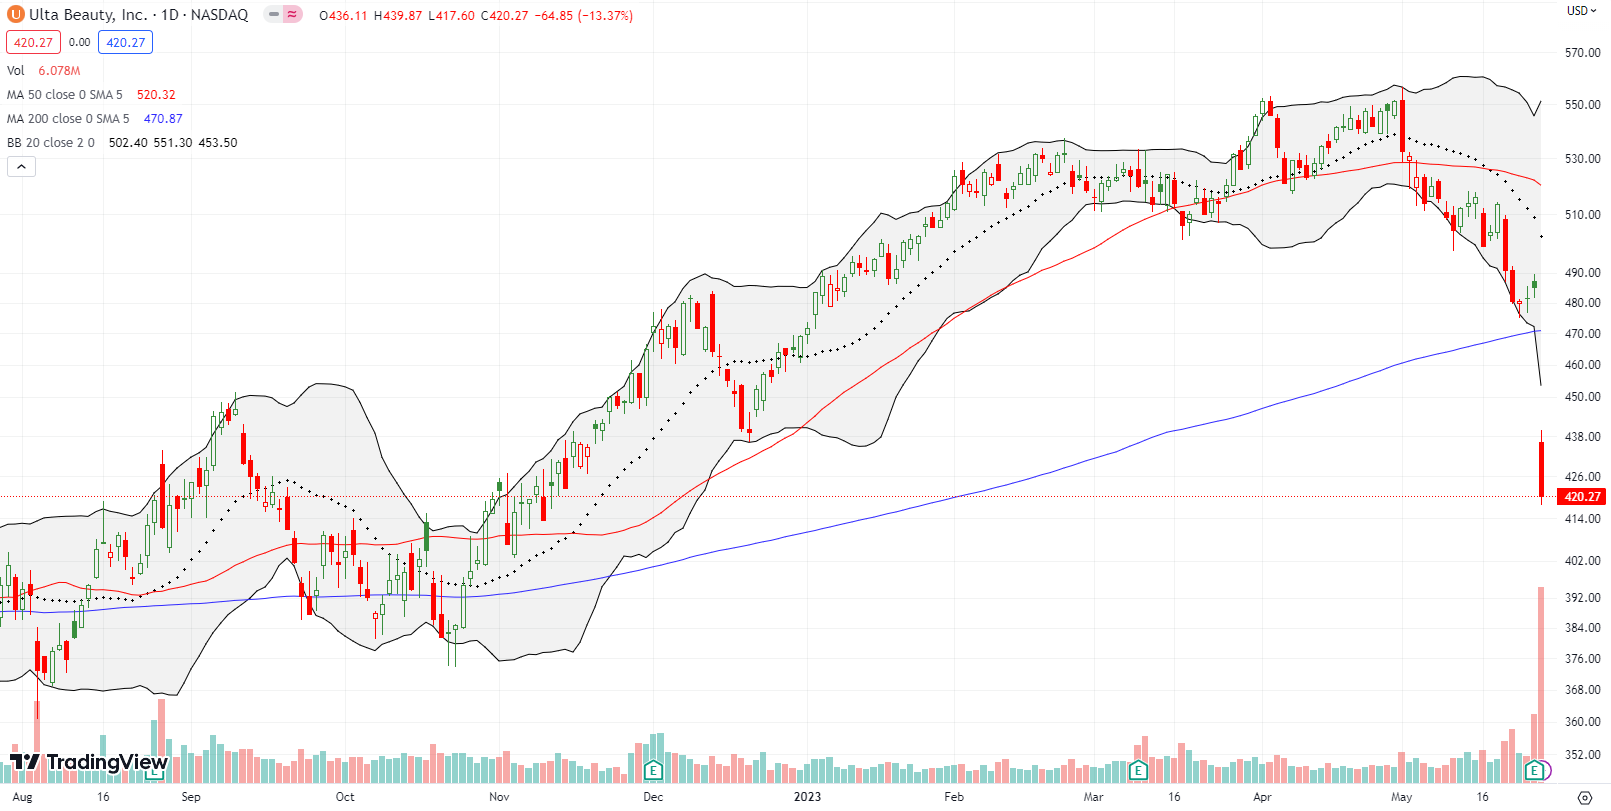
Also in my previous “Market Breadth” I threw up a warning flag on the sudden fall from all-time highs for Ulta Beauty, Inc (ULTA). Based on the 13.4% post-earnings breakdown, it now looks like someone “got the drop” on bad news ahead of time. I have no interest in looking for a buying point here.
Be careful out there!
Footnotes
Subscribe for free to get email notifications of future posts!
“Above the 50” (AT50) uses the percentage of stocks trading above their respective 50-day moving averages (DMAs) to measure breadth in the stock market. Breadth defines the distribution of participation in a rally or sell-off. As a result, AT50 identifies extremes in market sentiment that are likely to reverse. Above the 50 is my alternative name for “MMFI” which is a symbol TradingView.com and other chart vendors use for this breadth indicator. Learn more about AT50 on my Market Breadth Resource Page. AT200, or MMTH, measures the percentage of stocks trading above their respective 200DMAs.
Active AT50 (MMFI) periods: Day #40 over 20%, Day #14 over 30%, Day #11 over 40%, Day #4 under 50%, Day #63 under 60%, Day #65 under 70%
Source for charts unless otherwise noted: TradingView.com
Full disclosure: long QQQ put spread, long VXX put and call spreads, long ZM calendar call spread, long SHOP call spread
FOLLOW Dr. Duru’s commentary on financial markets via StockTwits, Twitter, and even Instagram!
*Charting notes: Stock prices are not adjusted for dividends. Candlestick charts use hollow bodies: open candles indicate a close higher than the open, filled candles indicate an open higher than the close.


Insight/2023/05.2023/05.26.2023_Earnings%20Insight/01-number-of-s%26p-500-companies-citing-ai-on-earnings-calls-10-year.png?width=1842&height=1062&name=01-number-of-s%26p-500-companies-citing-ai-on-earnings-calls-10-year.png)
