Stock Market Commentary:
On cue, the stock market groaned at fresh signs of economic strength, this time from another strong jobs report. The recession Wall Street wants is on hold yet again. The bullish intent that charged out of the wake of the Federal Reserve’s last statement on monetary policy made a sharp u-turn. The jobs report took the shine off the post-Fed high as the major indices gapped down at the open. A spirited rebound that reversed losses was in turn reversed. So can the speculative furor which has so far defined 2023 continue while good economic news threatens to keep inflation higher for longer than current expectations or desires? All ears and eyes should return to Fedspeak in the coming days and weeks.
Four months ago I rhetorically asked how many months it takes for a “lagging indicator” to reflect reality. The January jobs report delivered astounding numbers at this late stage of a sharp cycle of monetary tightening. The economy gained 517,000 jobs while the economic consensus expected just half that number. The unemployment rate went down to 3.4%, a new 54-year low. The folks at Marketplace picked apart the numbers and could not find the exceptions that would please the economic doubters. They marveled at how today’s economy defies traditional models. Moreover, initial claims for unemployment went down last week and still hover just above the pandemic era lows. Whenever the next recession happens, I will back on this period and marvel at just how wrong so many experts were month-after-month on this new economy. No wonder the Federal Reserve is in “risk management” mode.
Perhaps if the economy can defy expectations, the stock speculators can continue to do the same with last year’s trash.
The Stock Market Indices
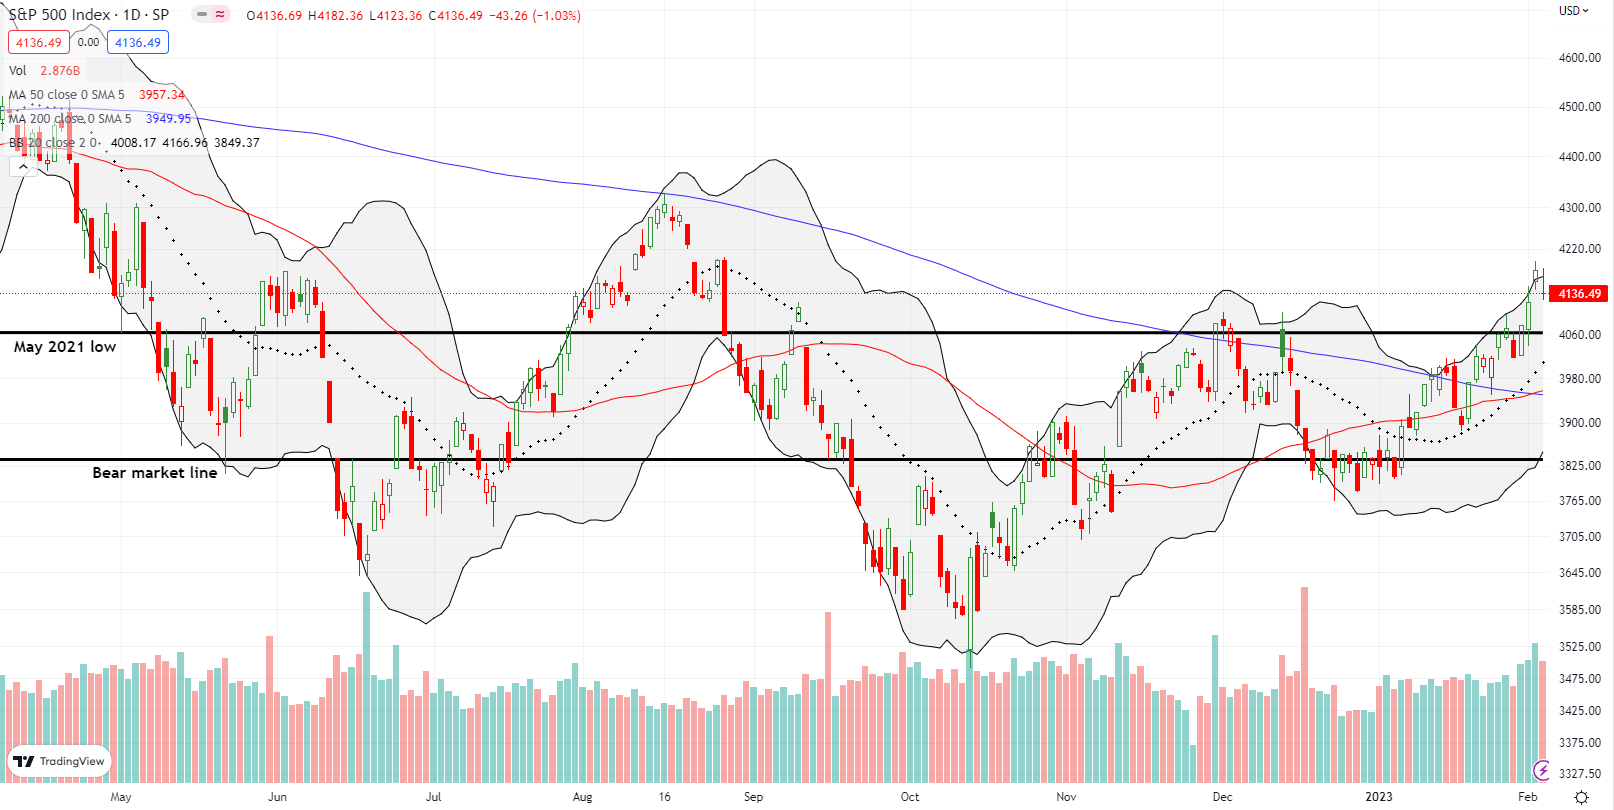
The S&P 500 (SPY) came within a hair of finishing its reversal of losses that started with Jackson Hole last August. At its high of post-Fed shine, the S&P 500 hit 4195.44, just 4 points short of its pre-Jackson Hole close. With the shine off, the S&P 500 gapped down the next day for a 1.0% loss.
The trading action looks toppy. However, a pullback should get firm support starting from the May, 2021 low down to the converged 50-day moving average (DMA) (red line) and the 200DMA (blue line). It is hard to get bearish until/unless these supports break down. I did not make any trades on SPY.
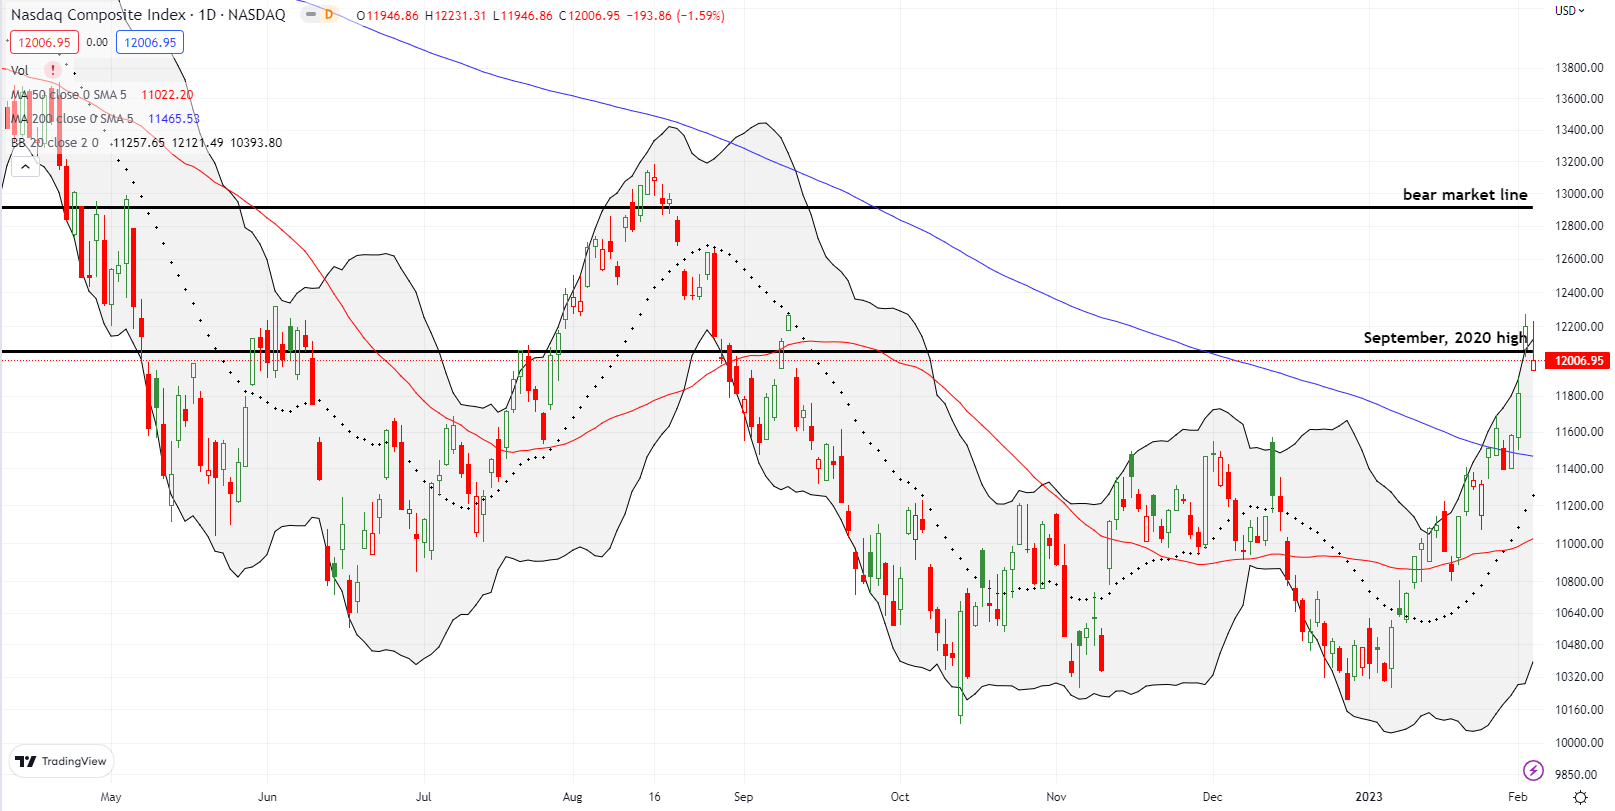
The NASDAQ gapped down and put on a spirited comeback attempt that at one point put the tech-laden index into the green. However, a sustained post-earnings recovery by Apple (AAPL) was insufficient for preventing the tech-laden index from losing 1.6% and closing below support from the September, 2020 high. Given the NASDAQ’s steep ascent to this point, I was willing to speculate on follow-through selling at least back to 200DMA support: I bought a Feb $300/$290 put spread. Note well how support at the 200DMA coincides with presumed support from the November and December highs.
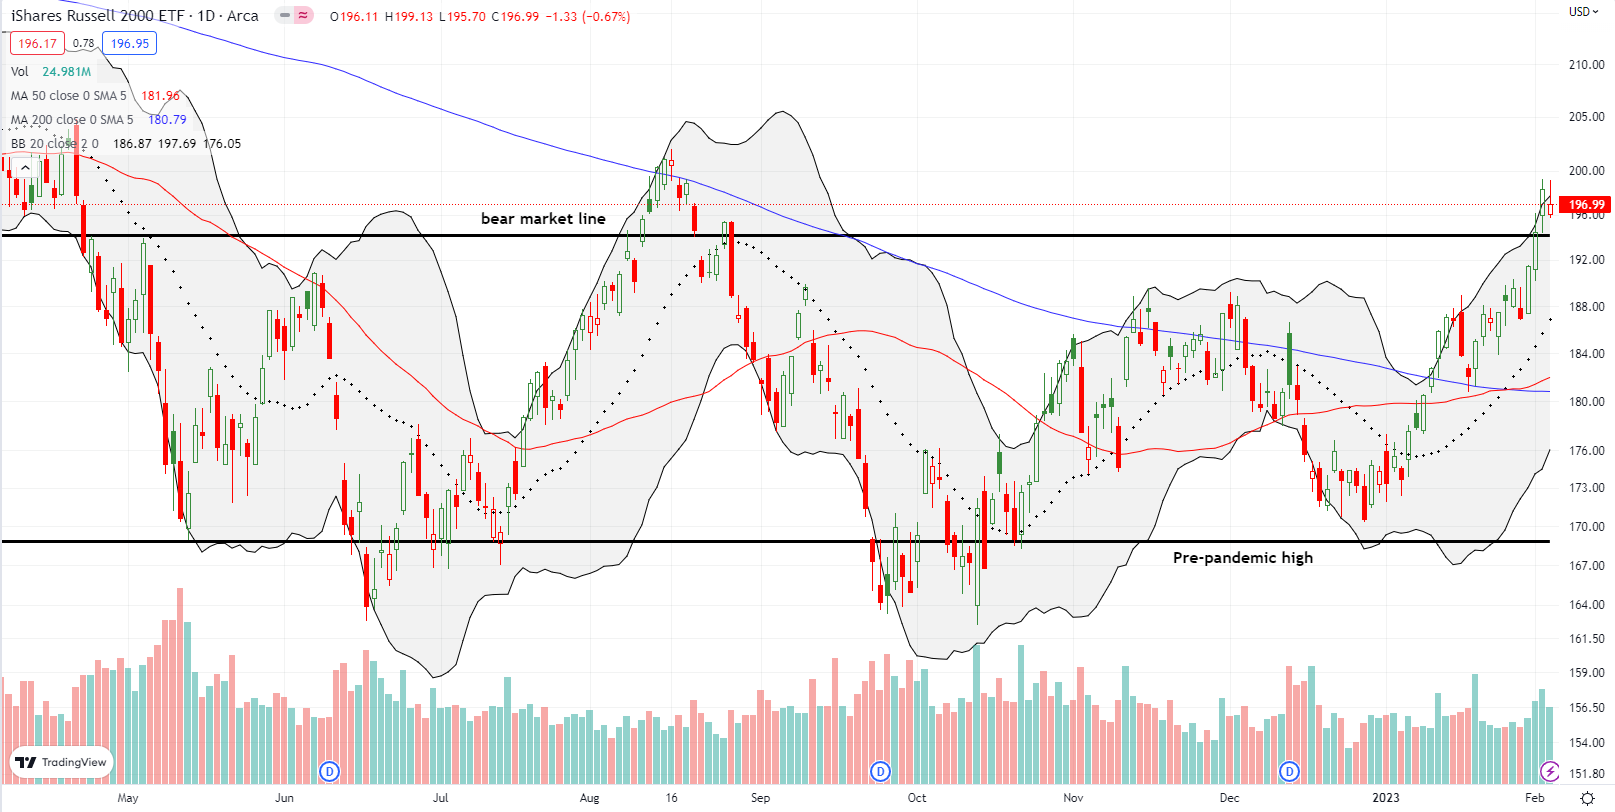
The iShares Russell 2000 ETF (IWM) lost 0.7%. The ETF of small caps may be the first of the indices to test major support. The test of the bear market line will be particularly important given IWM risks confirming failure at resistance from the August high.
Stock Market Volatility
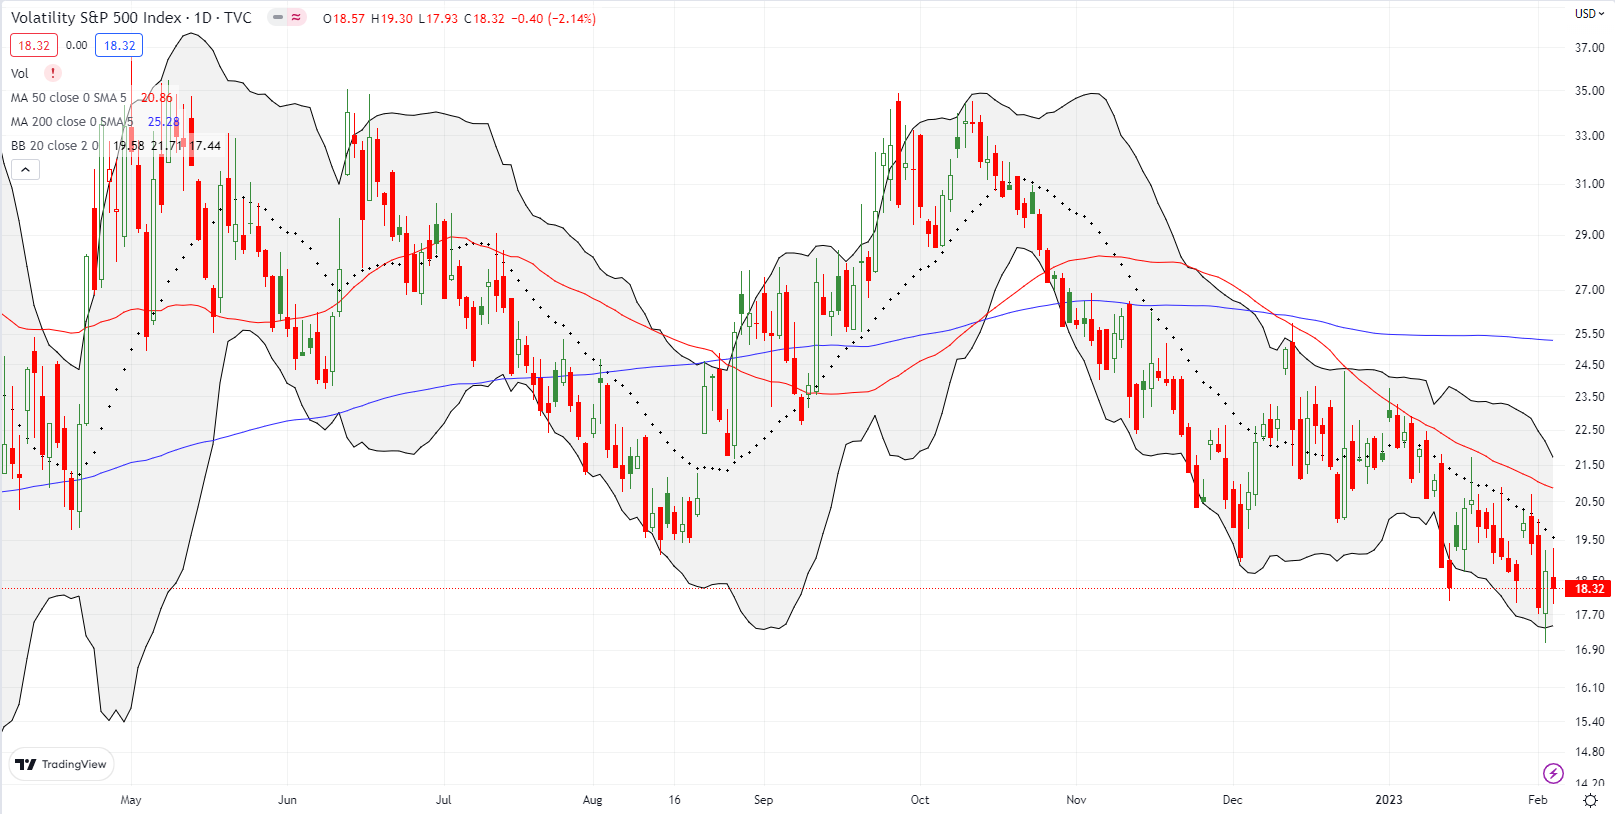
The volatility index (VIX) continues to be quite a mystery. Despite the market’s post-Fed celebration on Thursday, the VIX jumped 4.8%. The selling on Friday was not enough to deter the faders from sending the VIX to a 2.1% loss. Despite the day-to-day confusion, the overall message from the VIX remains the same: the downtrend in volatility and now the close below 20 support a bullish bias to the market.
The Short-Term Trading Call With the Shine Off
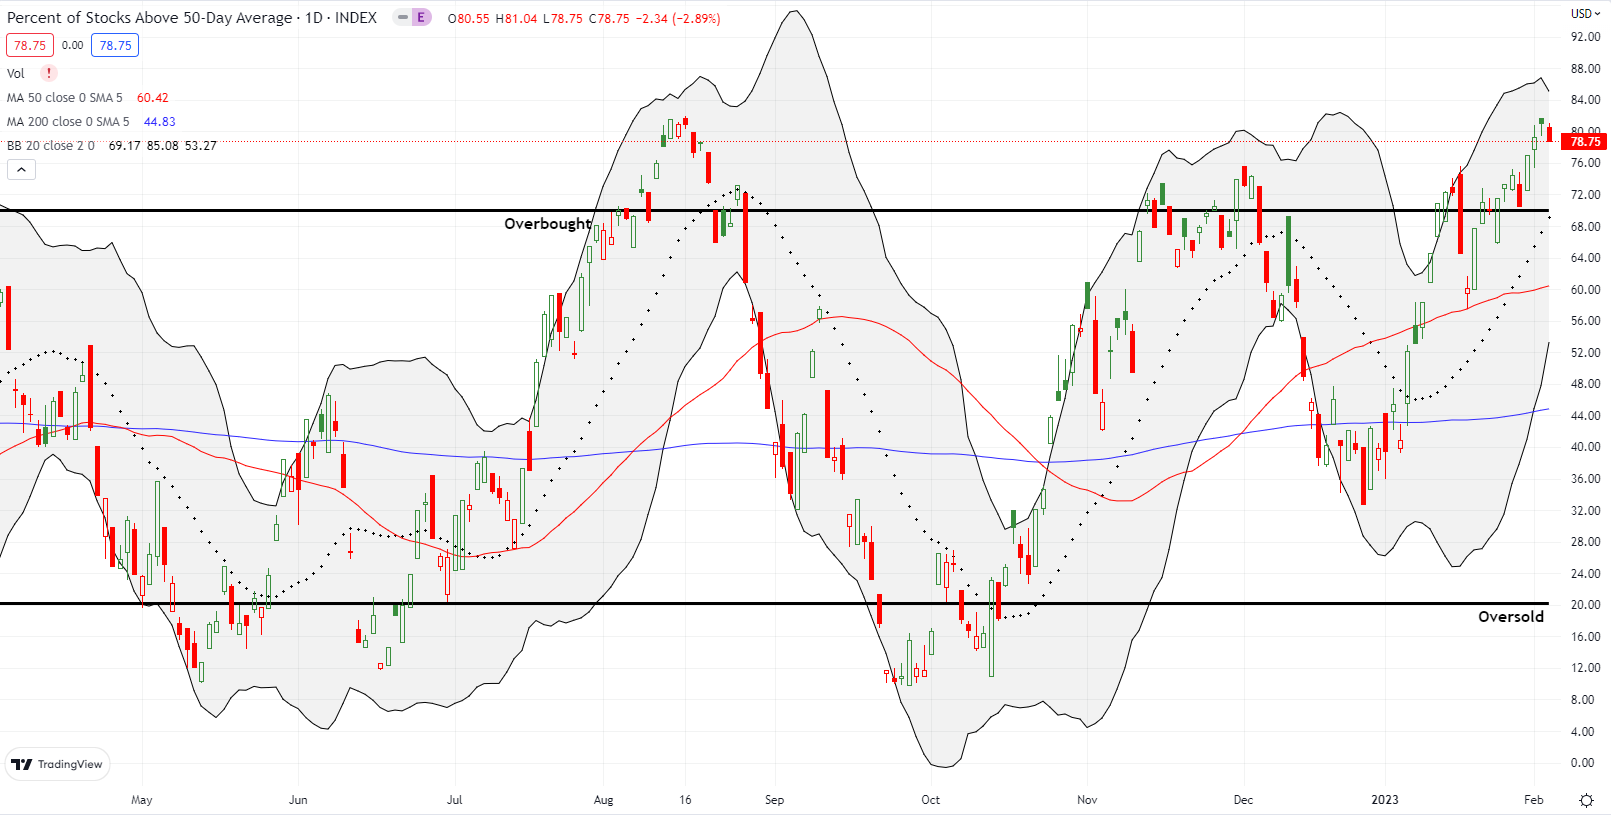
- AT50 (MMFI) = 78.8% of stocks are trading above their respective 50-day moving averages (overbought day #10)
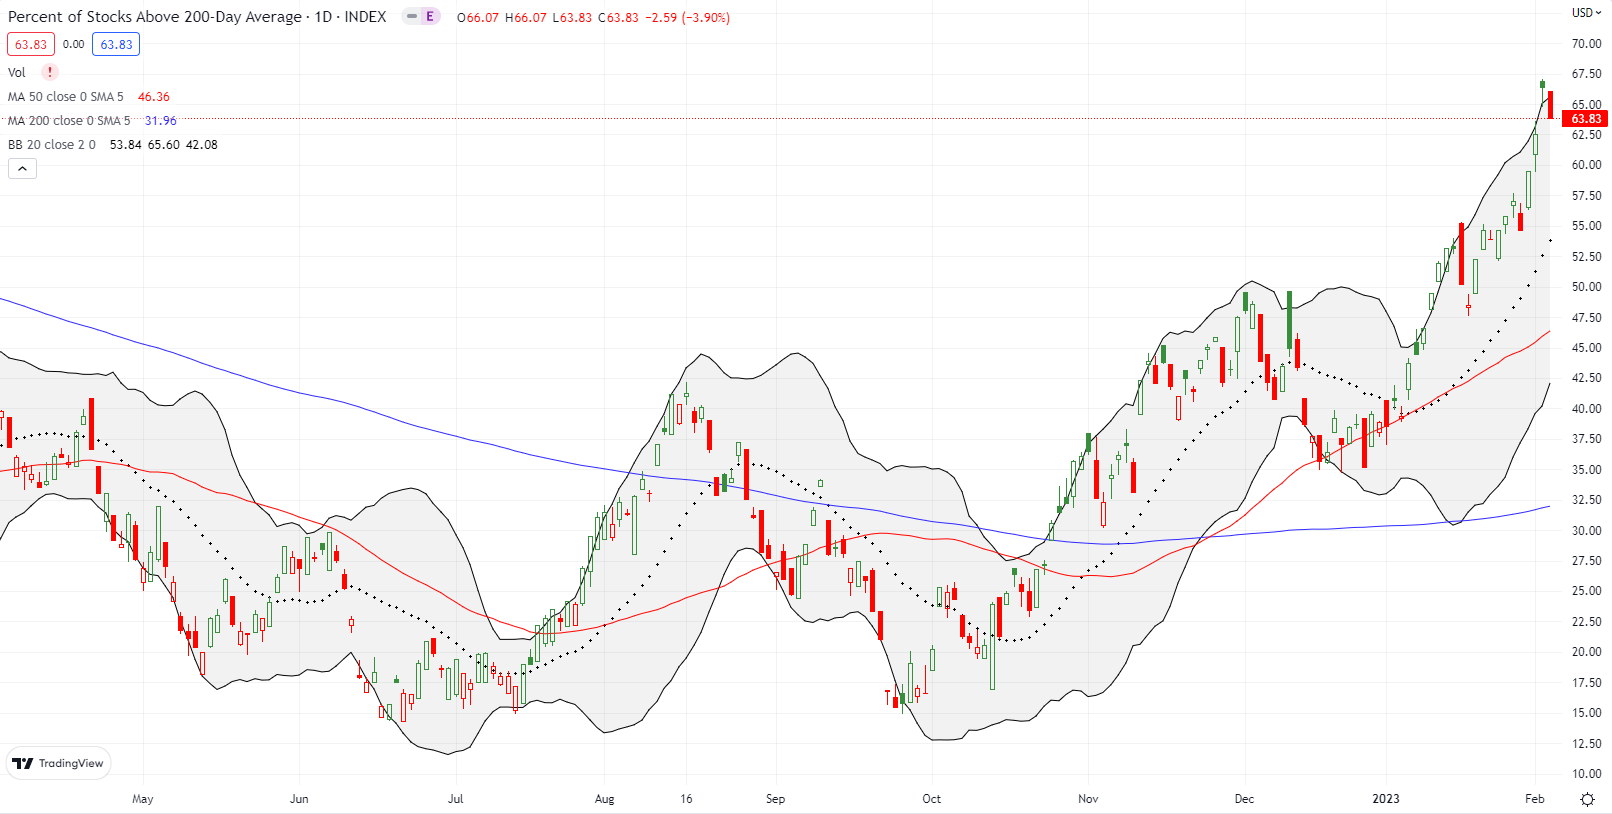
- AT200 (MMTH) = 63.8% of stocks are trading above their respective 200-day moving averages
- Short-term Trading Call: neutral
AT50 (MMFI), the percentage of stocks trading above their respective 50DMAs, closed at 78.8%. At 10 straight trading days overbought, my favorite technical indicator is in extended overbought territory (recall that the last such run was in late 2020). Even with the shine off the post-Fed high, the market has an overall bullish bias. While I am skeptical of the sustainability of the current market euphoria, I have to defer to the technical strength. However, staying short-term neutral is my way of negotiating between the bullish and bearish seeds in the market.
Note that I used recent strength to happily lighten my longer-term portfolio this past week. Most of the selling was taking losses I should have taken last year; some of it was fortuitous profits.
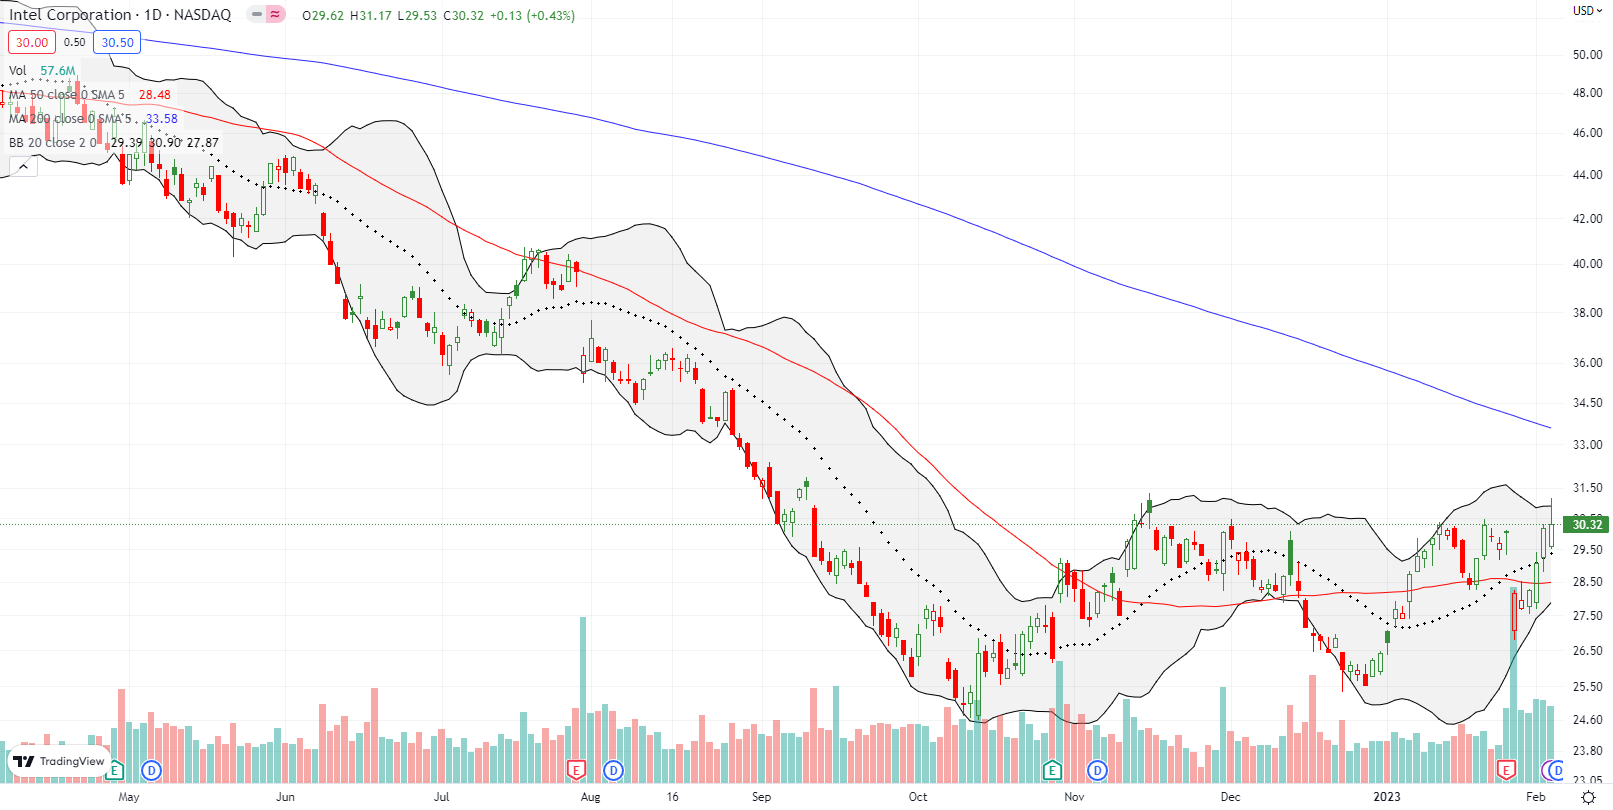
Amazingly, my pre-earnings calendar call spread trade on Intel Corporation (INTC) worked out perfectly. Unfortunately, it was too little too late for me. I used Thursday’s post-Fed shine to salvage some value from the long side of that trade. On Friday, INTC rebounded from its 20DMA and was even up for part of the day. Only perfect timing would have enabled me to lock in the profits that would have come from the surprising rebound.
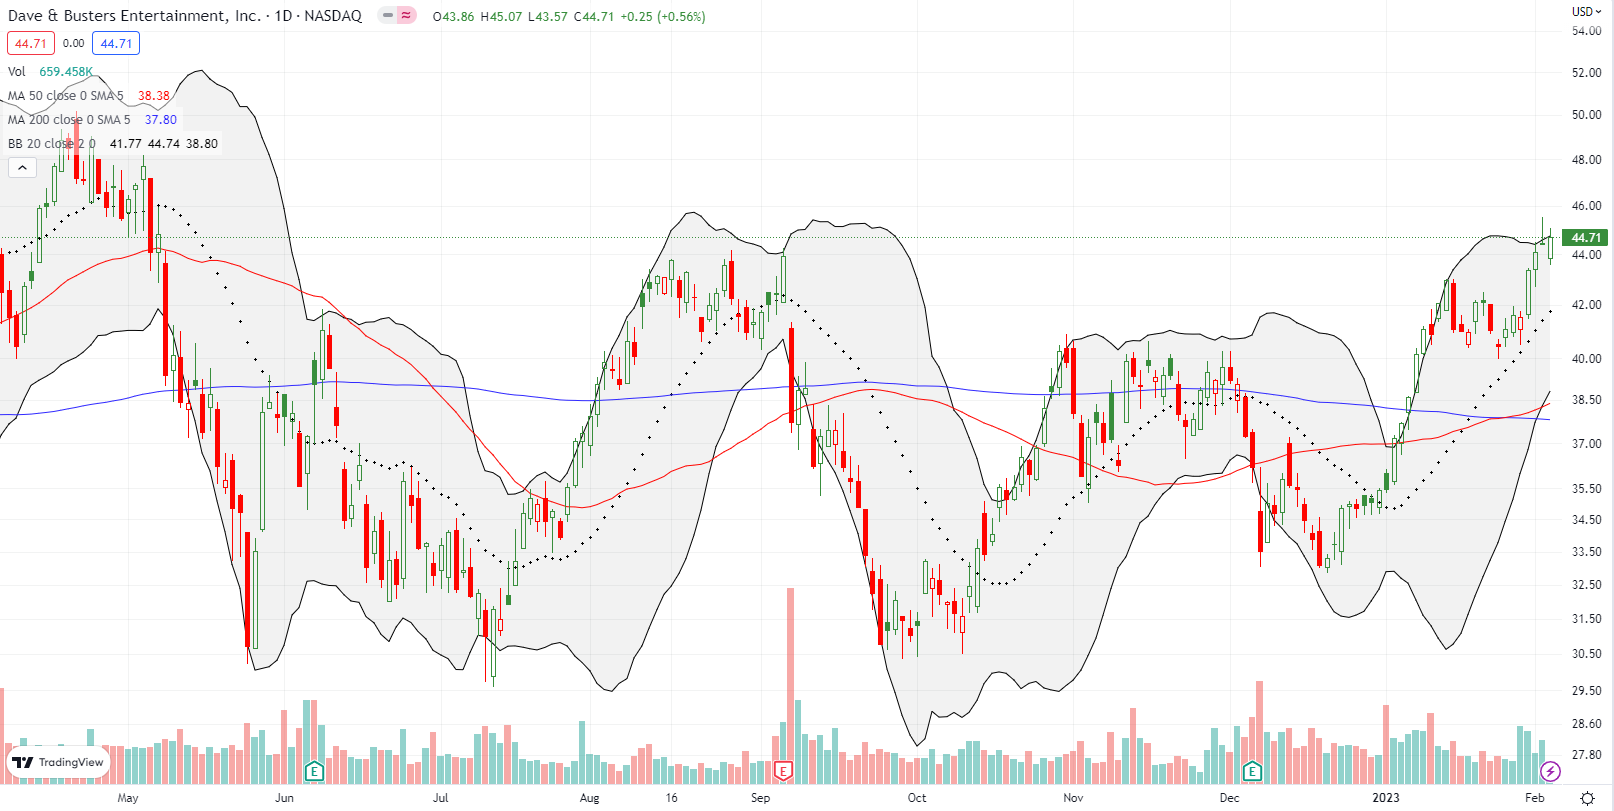
I made the case for Dave & Busters Entertainment , Inc (PLAY) a month ago. PLAY proceeded to ride the market euphoria higher and higher. I finally locked in profits as PLAY poked its head above the August highs. Since the bullish case remains, I may get back in on a dip. As a reminder, I created a low risk, low reward trade, so I did not have much more to gain by waiting for the short call to decay for the next 4 months.
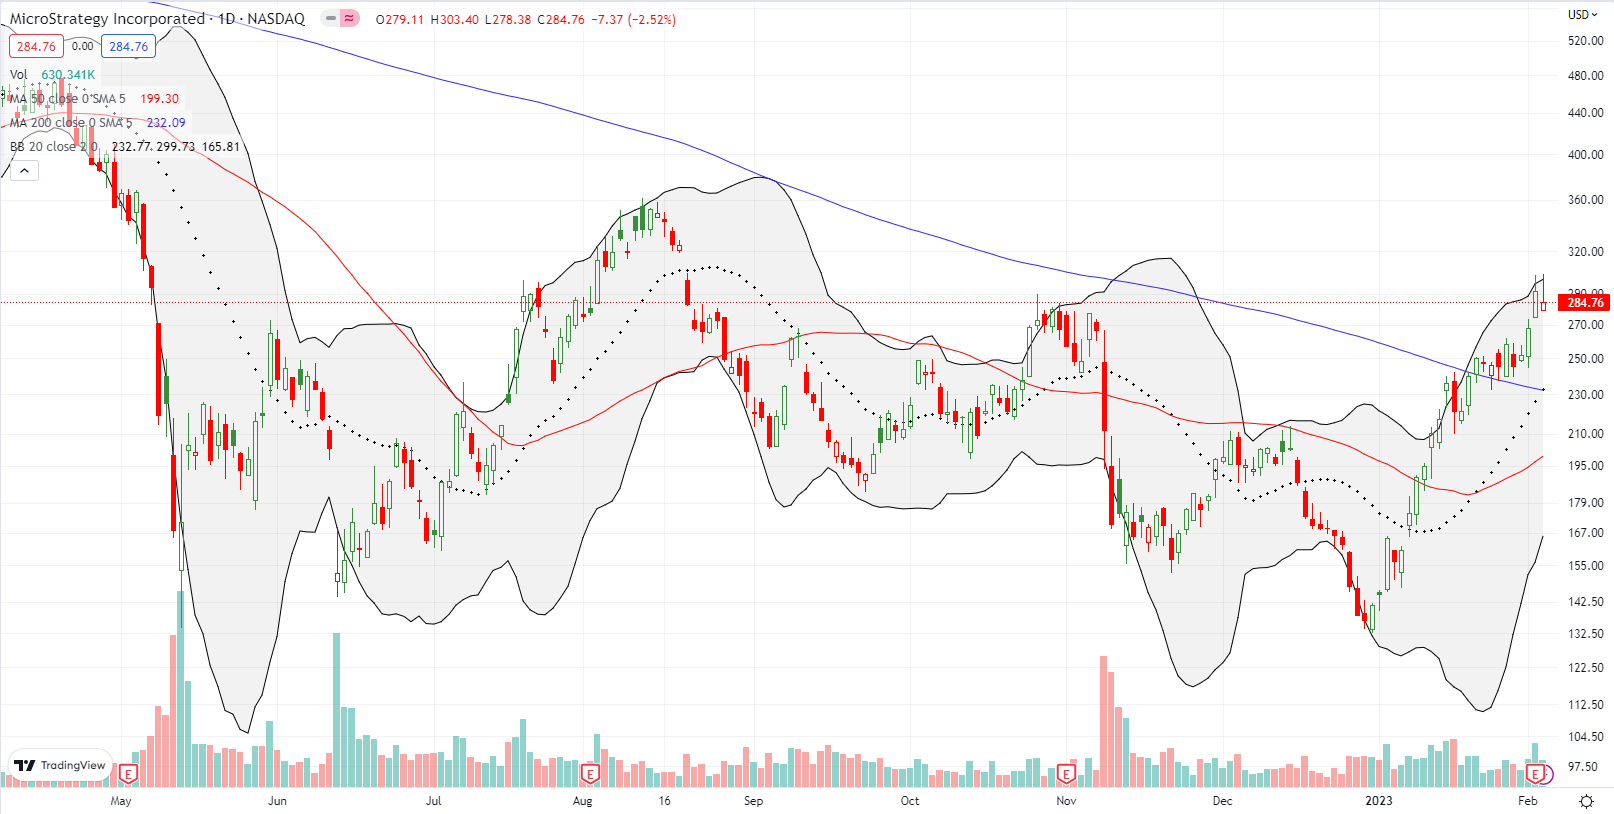
My impatience to jump on MicroStrategy (MSTR) cost me. At the time MSTR stalled at 200DMA resistance, I still had not fully appreciated the market’s bullish intent. Now, MSTR is sitting pretty with a confirmed 200DMA breakout. Even with Friday’s 2.5% pullback, MSTR closed the week at a 6-month high.
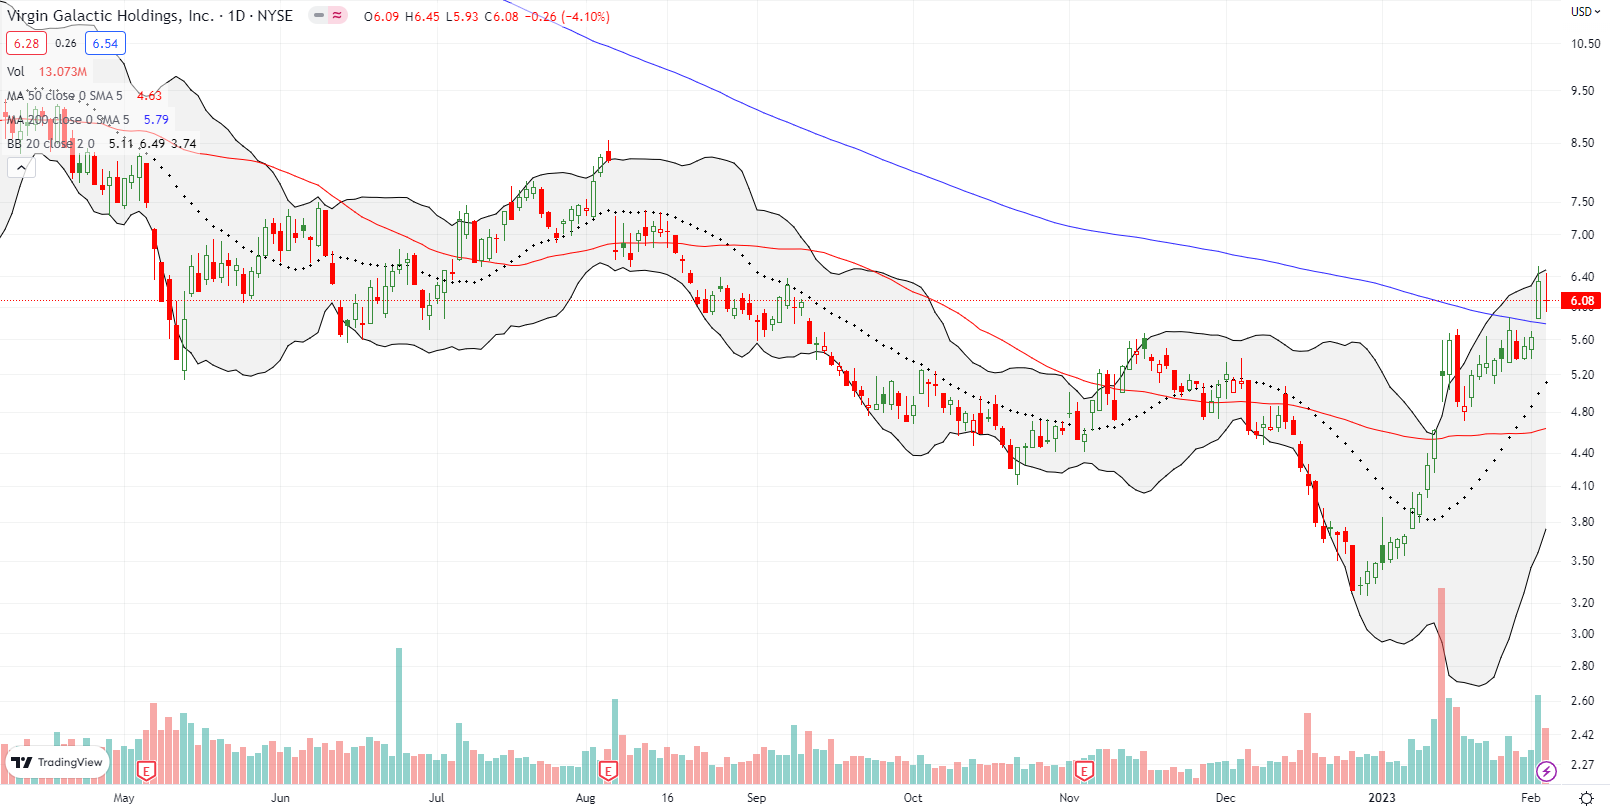
I finally dumped my speculative trade in Virgin Galactic Holdings, Inc (SPCE) in January just below 50DMA resistance. Not only did SPCE manage to launch above that resistance, but also it is now above 200DMA resistance. SPCE is one of those stocks thoroughly trashed in 2022 that is winning back the hearts and minds of speculators. All SPCE had to do was confirm that its commercial spaceline operations remain on schedule for 2Q23. A bearish market would yawn at a reiteration of known news. A short squeeze could also be at work with 19.7% of the float sold short.
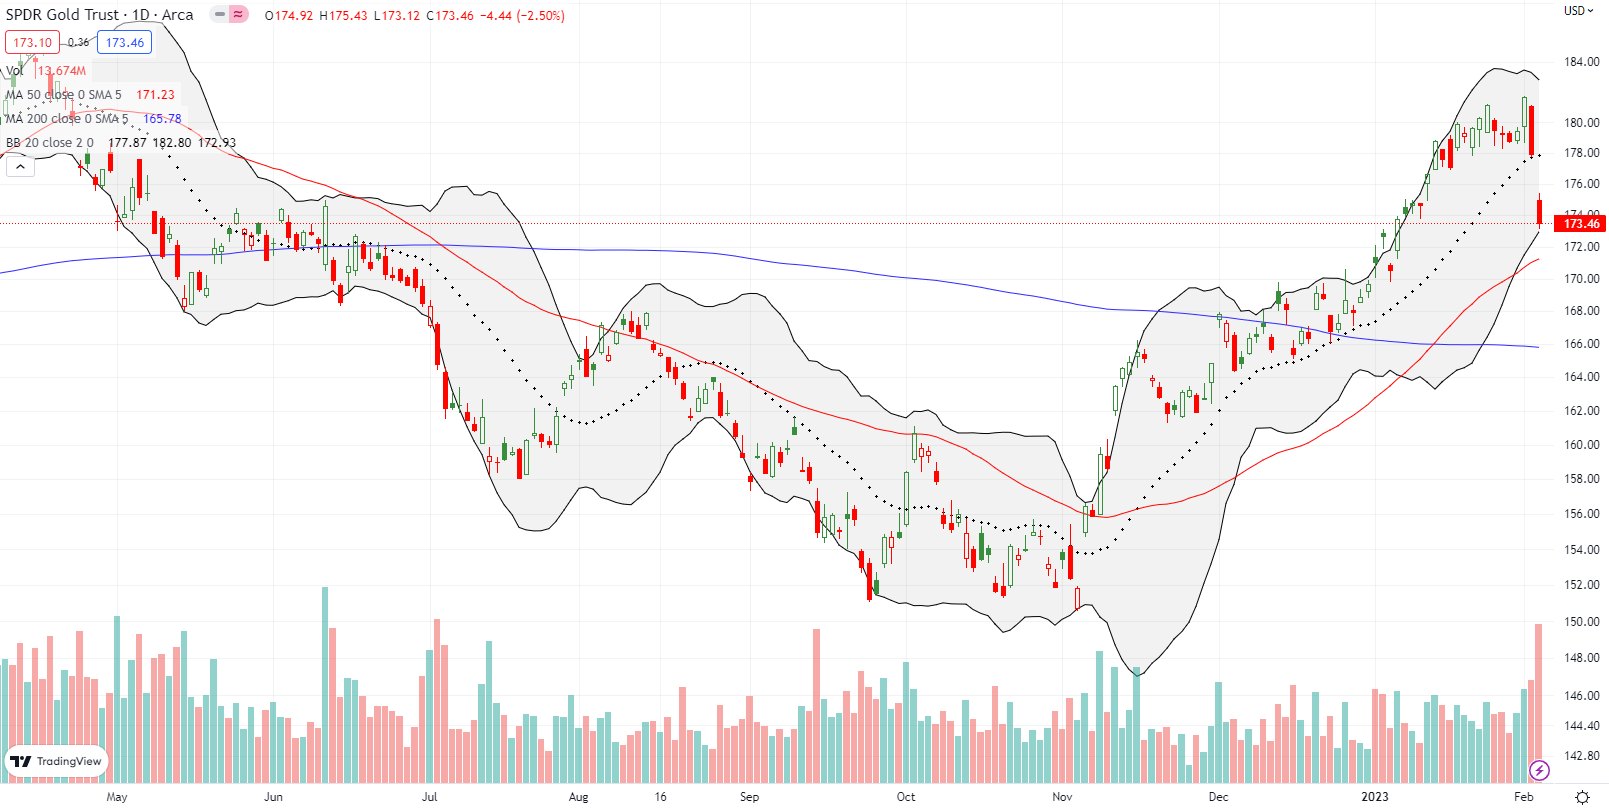
Gold is one of my big surprises. I assumed that a post-Fed shine would similarly shine on gold. That assumption held only on Wednesday. SPDR Gold Trust (GLD) gained 1.3% and closed at a new 10-month high. After that shine, the sellers descended upon gold and other commodities from oil to copper to iron ore even as stocks rallied. The shine off the market greased the skids and sent GLD falling 2.5%. I dutifully reloaded on GLD call options and Sprott Physical Gold Trust (PHYS) shares.
Be careful out there!
Footnotes
Subscribe for free to get email notifications of future posts!
“Above the 50” (AT50) uses the percentage of stocks trading above their respective 50-day moving averages (DMAs) to measure breadth in the stock market. Breadth defines the distribution of participation in a rally or sell-off. As a result, AT50 identifies extremes in market sentiment that are likely to reverse. Above the 50 is my alternative name for “MMFI” which is a symbol TradingView.com and other chart vendors use for this breadth indicator. Learn more about AT50 on my Market Breadth Resource Page. AT200, or MMTH, measures the percentage of stocks trading above their respective 200DMAs.
Active AT50 (MMFI) periods: Day #77 over 20%, Day #73 over 30%, Day #22 over 40%, Day #20 over 50%, Day #17 over 60%, Day #10 over 70% (overbought)
Source for charts unless otherwise noted: TradingView.com
Full disclosure: long QQQ put spread, long PHYS, long GLD call spreads and shares, long MSTR put spread
FOLLOW Dr. Duru’s commentary on financial markets via StockTwits, Twitter, and even Instagram!
*Charting notes: Stock prices are not adjusted for dividends. Candlestick charts use hollow bodies: open candles indicate a close higher than the open, filled candles indicate an open higher than the close.


