Stock Market Commentary:
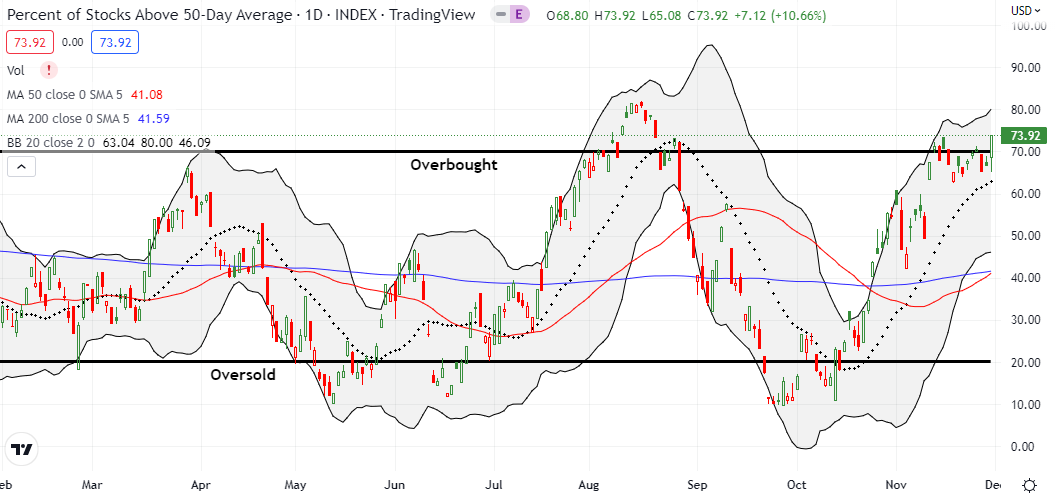
Social unrest from fresh COVID lockdowns in China are already a distant memory for the U.S. stock market. Just as quickly as the stock market bearishly failed once again to hold overbought trading conditions, market breadth flipped the script to surge and rush back to overbought. Buyers and bulls celebrated a speech from Jerome Powell that, to me, seemed as hawkish as ever and contained almost no new information. By ignoring Powell’s fresh inflation-fighting warnings, buyers seemed to focus on the small possibility that the Fed will cut rates sooner than expected next year. Expectations for peak rates remain the same. Accordingly, I am highly skeptical of this rally and very wary. Yet, I will not let the fundamentals get in the way of the technicals in this moment. All over again, the stock market seems ready to ride seasonal tailwinds at least until the Fed’s December 14th release on monetary policy.
The Stock Market Indices
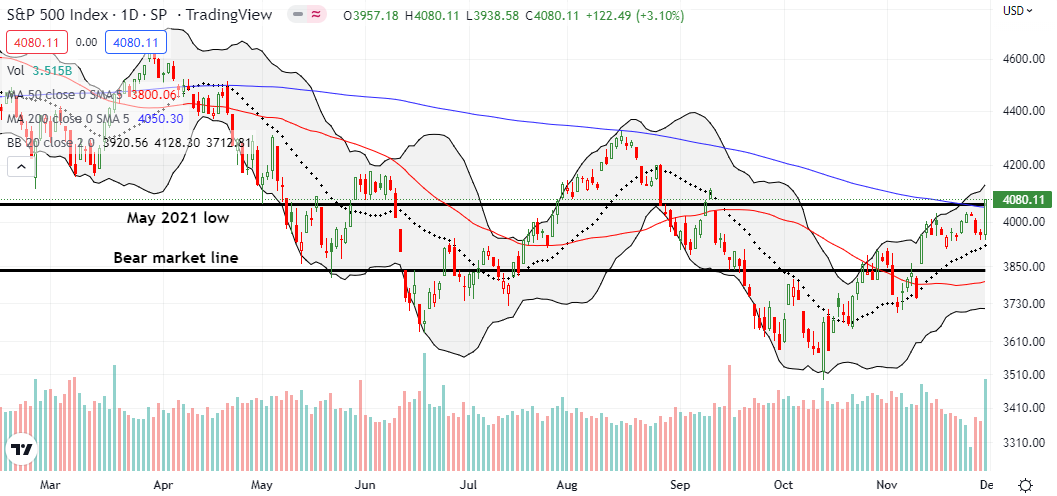
The S&P 500 (SPY) started the day tentatively with a flat open and slight slip to the previous day’s intraday low. Powell’s speech quickly transformed the tenor of trading. Buyers and bulls created a rush back to overhead 200-day moving average (DMA) (the blue line below) resistance. The excitement did not stop there. The dust settled with the S&P 500 closing with a 3.1% gain and a double breakout above the 200DMA and the important May, 2021 low. The 2 1/2 month high also brought the index ever closer to finishing a reversal of the accumulated losses that started from Powell’s terse inflation-fighting warning at Jackson Hole in late August.
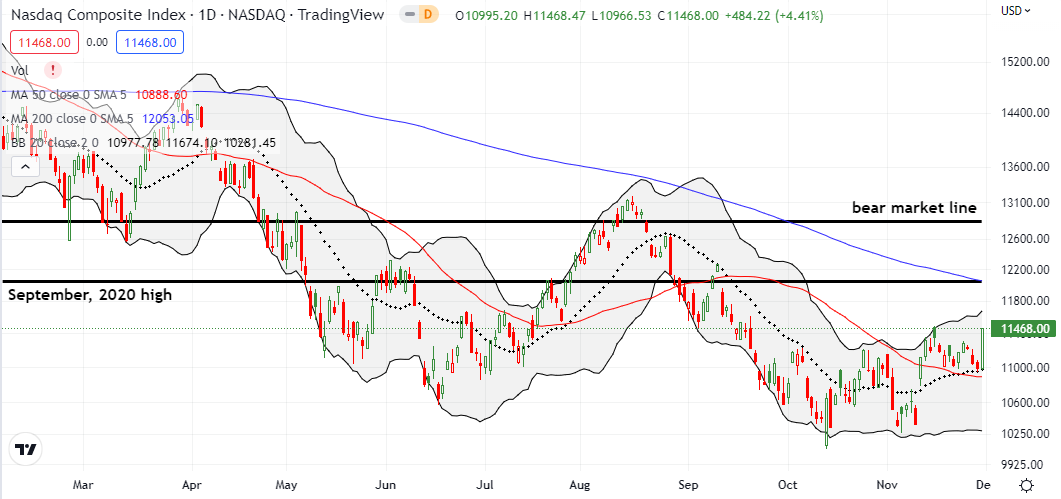
The NASDAQ (COMPQ) out-performed the S&P 500 with a 4.4% surge. The tech-laden index convincingly confirmed 20DMA and 50DMA support with a 2-month high. The NASDAQ once again has an open path to challenging 200DMA resistance for the first time in 8 months. I pressed my luck with my QQQ put spread all the way into the initial reaction to Powell’s speech. As soon as I saw stocks start to move up in response, I salvaged my remaining tiny profit on the position. Given I interpreted Powell’s speech much differently from the market, I did not turn around and buy anything. (In fact, shortly after I finished watching Powell’s session at the Brookings Institution, I went to the gym and did not bother checking the market until after the close!).
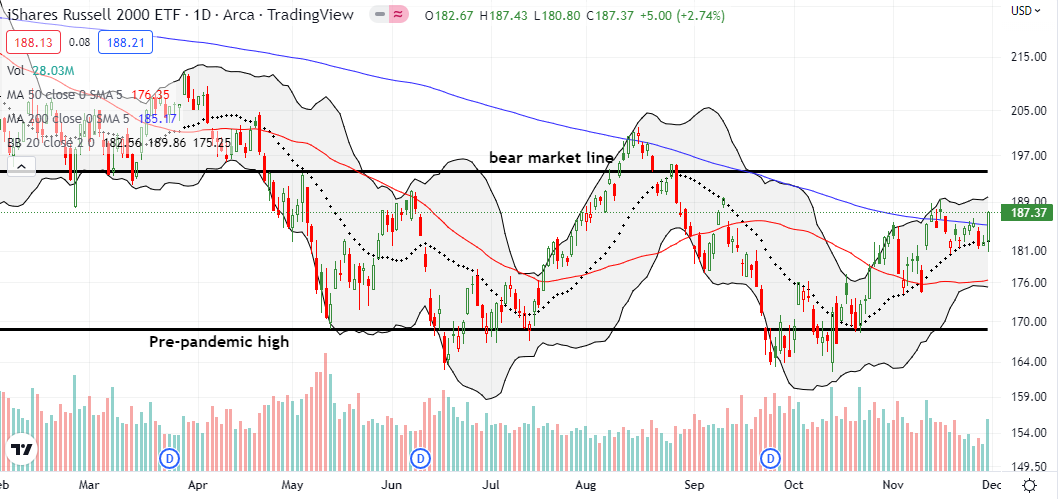
The iShares Russell 2000 ETF (IWM) moved from the edge of confirming 200DMA resistance to a fresh 200DMA breakout. Unlike the S&P 500, the ETF of small caps cleared enough hurdles to reach a new multi-month high. Accordingly, the jury is still out on whether IWM is ready to challenge its bear market line.
Stock Market Volatility
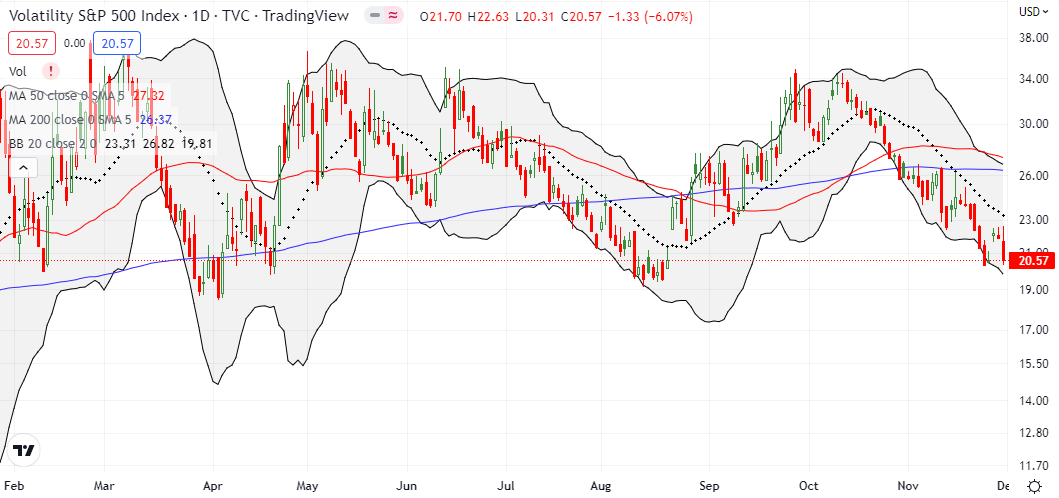
The volatility index (VIX) finally showed some real strength to start this week. However, the day’s 6.1% pullback kept the VIX trapped in its current downtrend. Surprisingly, the key 20 level did not give way. I will be watching these developments even more closely as an indicator of the health of the new overbought period.
The Short-Term Trading Call On A Rush Back
- AT50 (MMFI) = 73.9% of stocks are trading above their respective 50-day moving averages (first overbought day)
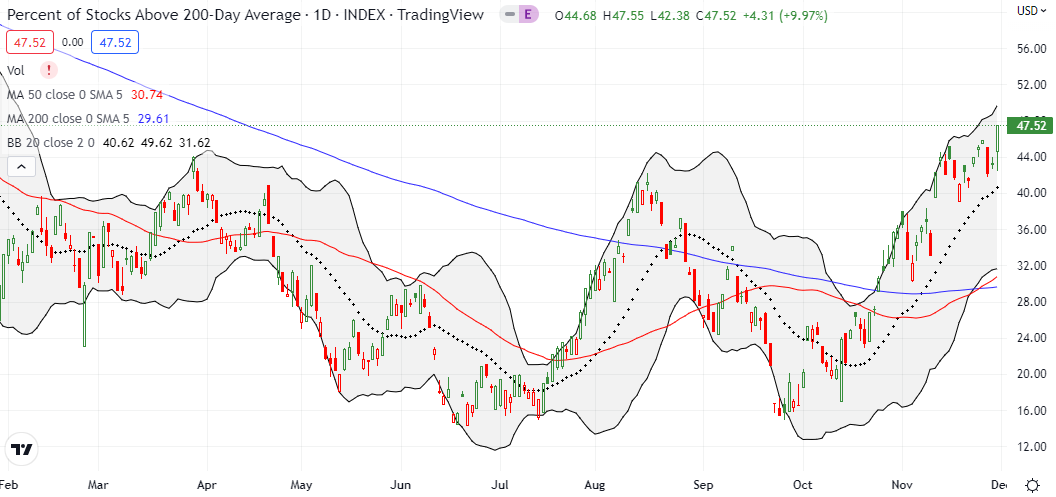
- AT200 (MMTH) = 47.5% of stocks are trading above their respective 200-day moving averages
- Short-term Trading Call: neutral
AT50 (MMFI), the percentage of stocks trading above their respective 50DMAs, rebounded sharply to close at a 3-month high. My favorite technical indicator moved ahead of the S&P 500 in reversing its accumulated losses from Powell’s admonishment at Jackson Hole. The stock market is in its 4th overbought period in under 3 weeks. This churn has caused me to flip my assessment of the stock market more than I like. This time, I upgraded from cautiously bearish to neutral given the strength of the rally. As I have discussed previously, I never change to bullish (or bearish) at the start of an overbought period. As long as the market avoids a convincing breakdown below the overbought threshold of 70%, I will remain neutral. Still, I am skeptical of this rally and unlikely to add to short-term bullish positions. One important exception is my launch of the seasonal trade on home builders.
I enjoyed a return to performance of my handful of call option positions left over from my bullish period when I expected seasonal tailwinds to benefit the market going into year-end. While I escaped whole with my QQQ put spread, I had started to slowly pick at put options (spreads) on individual stocks. Now THOSE positions are partial hedges.
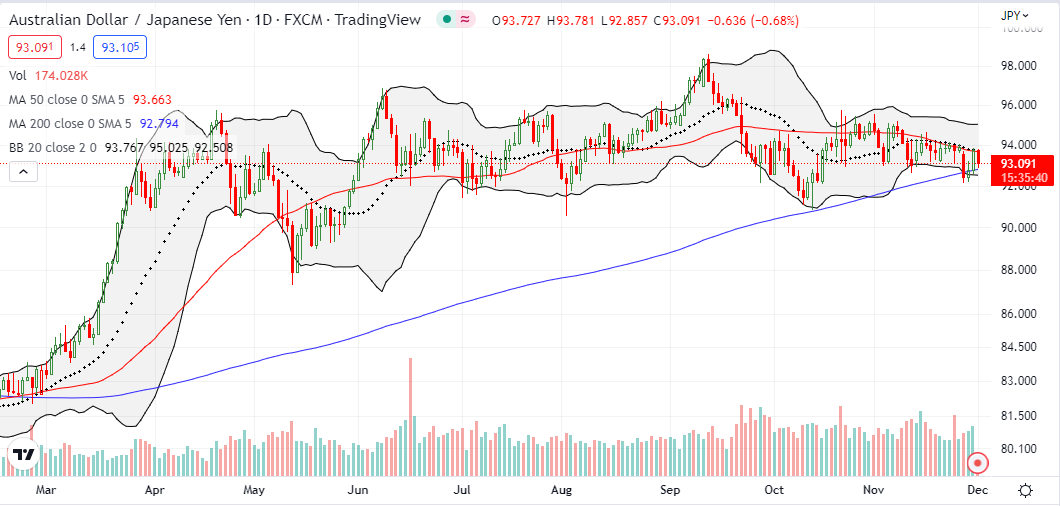
The Australian dollar versus the Japanese yen (AUD/JPY) is still ominously hovering over the stock market. AUD/JPY rallied along with the U.S. stock market but quickly reversed after the close. Accordingly, I am still on watch for a confirmed 200DMA breakdown which will signal poor tidings for the stock market. Conversely, a 50DMA breakout would support a more sustained stay in overbought conditions.
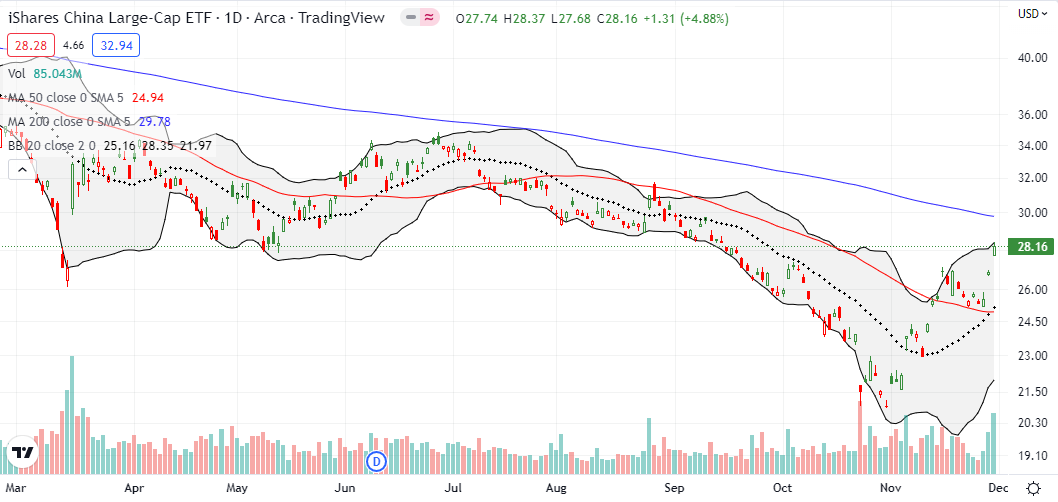
In my previous Market Breadth post, I missed a contrary bullish sign from the trading in Chinese stocks. While U.S. stocks despaired over new COVID lockdowns in China, Chinese stocks held firm on Monday. The iShares China Large-Cap ETF (FXI) held 50DMA support and soared the next day by 5.1%. That was an early sign that the U.S. stock market might itch for any excuse to break out. FXI soared again on the day by 4.9%. Apparently, small hints and changes in COVID policy by the Chinese government have been sufficient to ignite this rush back to Chinese stocks.
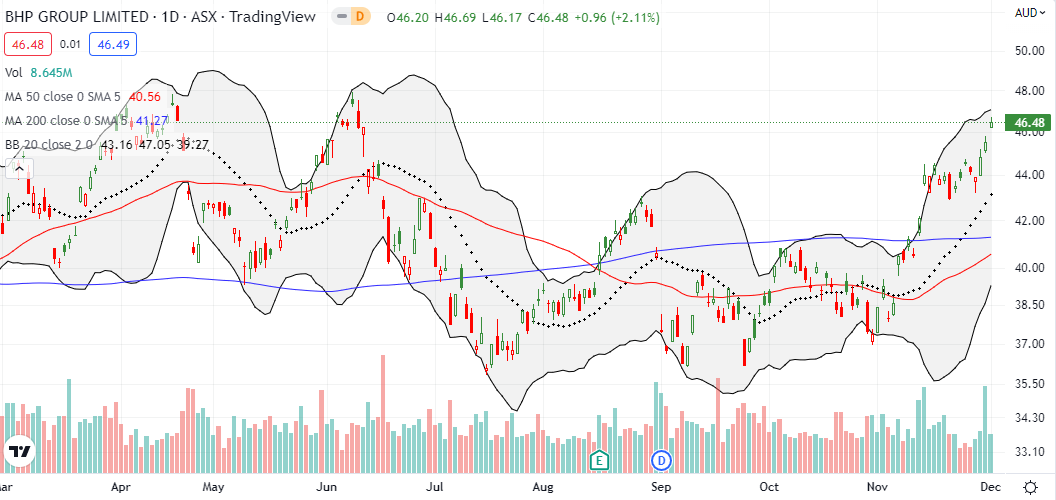
Soaring iron prices were another sign I missed that market conditions in China were moving opposite the dire headlines about social unrest. Diversified commodities producer BHP Group Limited jumped 3.1% on Tuesday and closed Wednesday at prices last seen in early June. I made the case in July to buy weakness in BHP. As with home builders, I make exceptions for commodities plays when it comes to the general technical condition of the stock market. (The chart below is from the Australian Stock Exchange (ASX)).
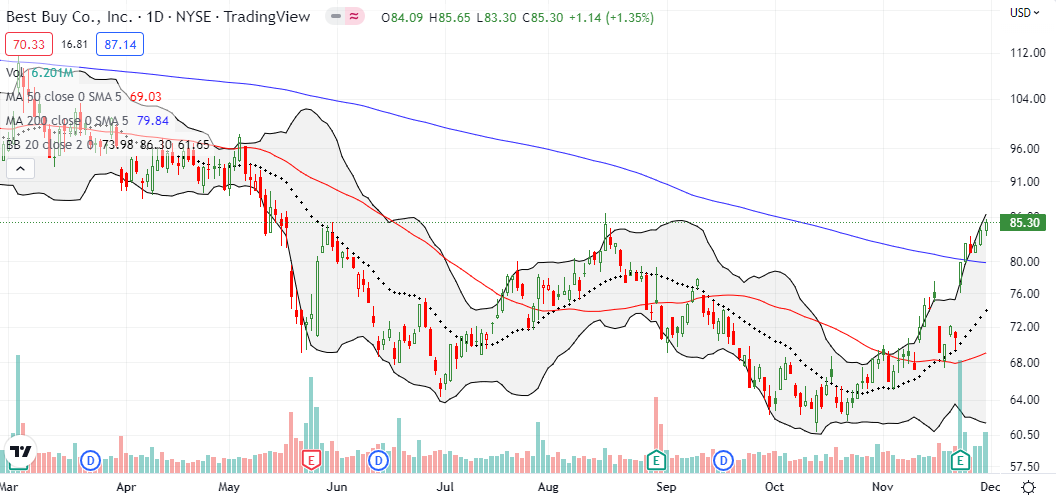
Perhaps no retail stock symbolizes holiday cheer better than electronics purveyor Best Buy (BBY). Despite earnings results that generated analyst skepticism, BBY soared 12.8% after its report. Buyers have barely looked back since. BBY confirmed a bullish 200DMA breakout and closed at a 6-month high. BBY is a buy on the dip from here as long as 200DMA support holds.
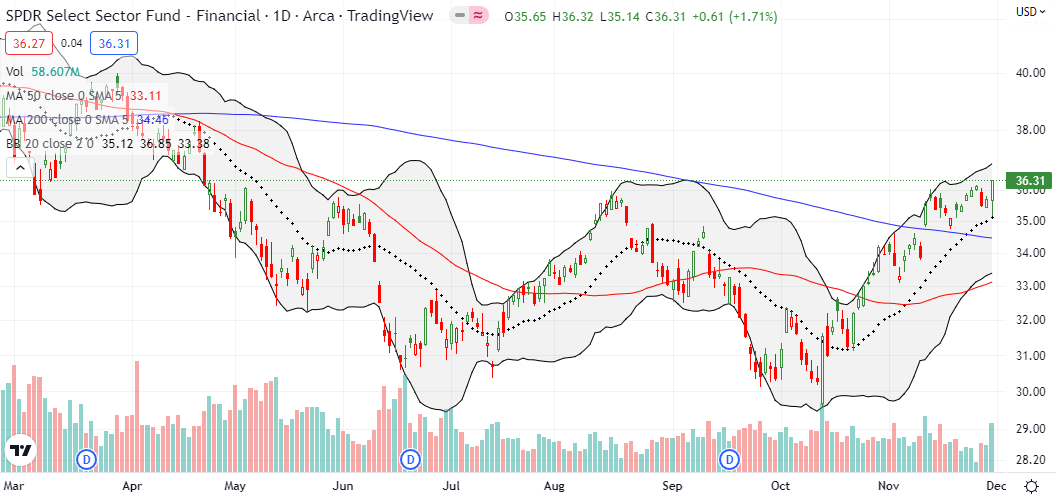
I have not paid attention to financials during the rebound off the October lows. Quietly and surely, the SPDR Select Sector Fund – Financial (XLF) has churned its way higher, guided by an uptrending 20DMA. In a bizarrely abrupt move, XLF touched 20DMA support for the first time in a month and then quickly reversed to a 7-month high. The rally looks ready to resume.
Be careful out there!
Footnotes
“Above the 50” (AT50) uses the percentage of stocks trading above their respective 50-day moving averages (DMAs) to measure breadth in the stock market. Breadth defines the distribution of participation in a rally or sell-off. As a result, AT50 identifies extremes in market sentiment that are likely to reverse. Above the 50 is my alternative name for “MMFI” which is a symbol TradingView.com and other chart vendors use for this breadth indicator. Learn more about AT50 on my Market Breadth Resource Page. AT200, or MMTH, measures the percentage of stocks trading above their respective 200DMAs.
Active AT50 (MMFI) periods: Day #32 over 20%, Day #28 over 30%, Day #26 over 40%, Day #14 over 50%, Day #14 over 60%, Day #1 over 70% (1st overbought day ending 3 days under 70%)
Source for charts unless otherwise noted: TradingView.com
Full disclosure: long IWM calendar call spread, short IWM put spread, long SPY calendar call spread, long BHP, long BBY shares and short a call option
FOLLOW Dr. Duru’s commentary on financial markets via StockTwits, Twitter, and even Instagram!
*Charting notes: Stock prices are not adjusted for dividends. Candlestick charts use hollow bodies: open candles indicate a close higher than the open, filled candles indicate an open higher than the close.


