Stock Market Commentary:
The latest cryptocurrency scandal and implosion distracted the market (and me) from the upside potential of the October CPI (Consumer Price Index) report. Likely contagion, real and psychological, from crashing crypto prices helped drive distraught trading that created technical breakdowns across the major indices. U.S. midterm elections on Tuesday also apparently failed to deliver the results desired by Wall Street (pollsters are blushing yet again). The converging catalysts of pessimism and disappointment locked and loaded the springs of a major bear market rally. Given last month’s CPI shocker precipitated a major bottoming signal, I can understand how a slightly “better than expected” CPI report could generate a tremendous rally (the price for shelter still increased at its highest rate since 1990 according to the BLS).
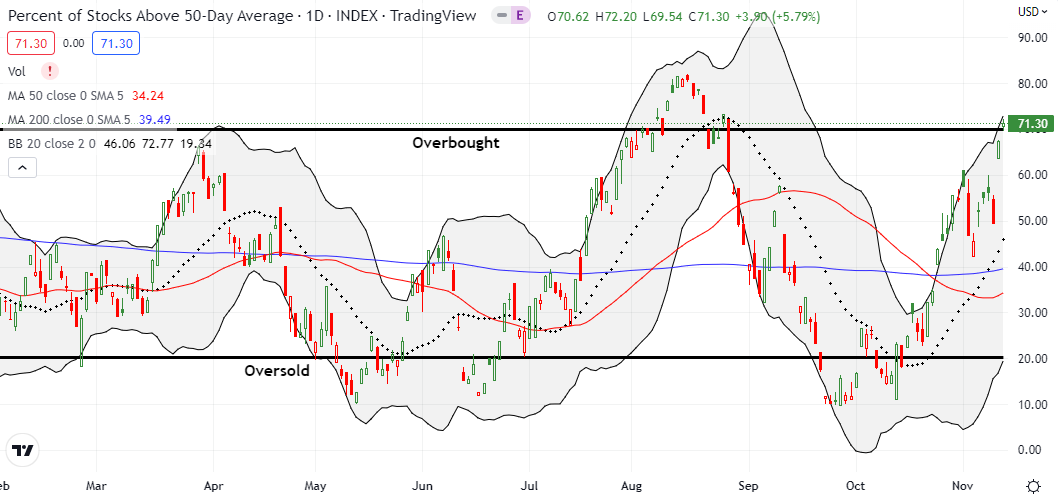
In just two days, the stock market flashed from distraught to overbought trading conditions as market breadth reached its best levels since the stock market’s Jackson Hole induced major peak in August.
The Stock Market Indices
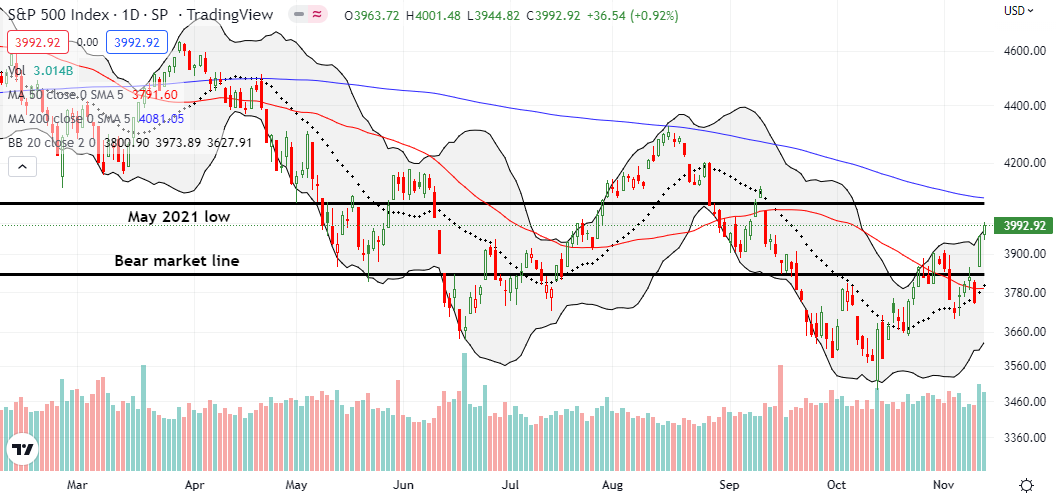
The S&P 500 (SPY) resumed its delayed schedule to challenge overhead resistance at its 200-day moving average (DMA) (the bluish line below). This resistance takes on additional importance given the convergence with the May, 2021 low that served as a pivot for a good part of 2022. The index is bullishly positioned after a successful defense of uptrending 20DMA support (the dotted line below). Even Wednesday’s distraught trading only slightly pierced that support after slicing through 50DMA support. With two strong days of buying on the books, the S&P 500 also confirmed a breakout above the bear market line and the 50DMA (the red line below). Traders, human and bots alike, should stay on high alert given how neatly the S&P 500 failed at 200DMA resistance in August…when the stock market last traded in overbought conditions.
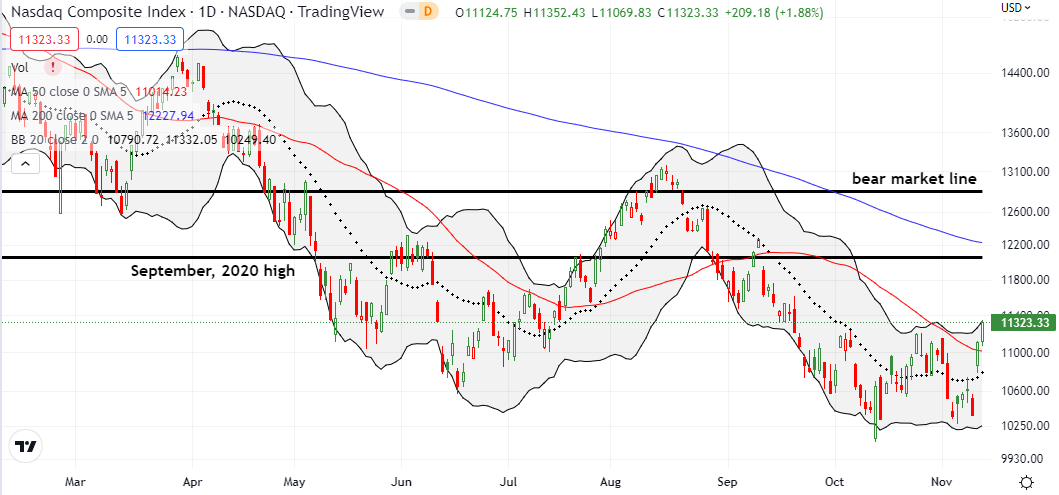
The NASDAQ (COMPQ) has a long way to go to challenge its 200DMA resistance, much less its bear market line. However, the tech-laden index also made a particularly dramatic turnaround from distraught trading levels. On Wednesday, a 2.5% loss took the NASDAQ close to its 28-month closing low. A startling 7.4% gain the next day sliced the NASDAQ right through 50DMA resistance for the first time in two months. Friday’s 1.9% follow-through confirmed the breakout. The NASDAQ is near a 2-month high and has plenty of overhead space until the next “natural” level of resistance. Note how the September, 2020 high and the declining 200DMA are converging near the September, 2022 high.
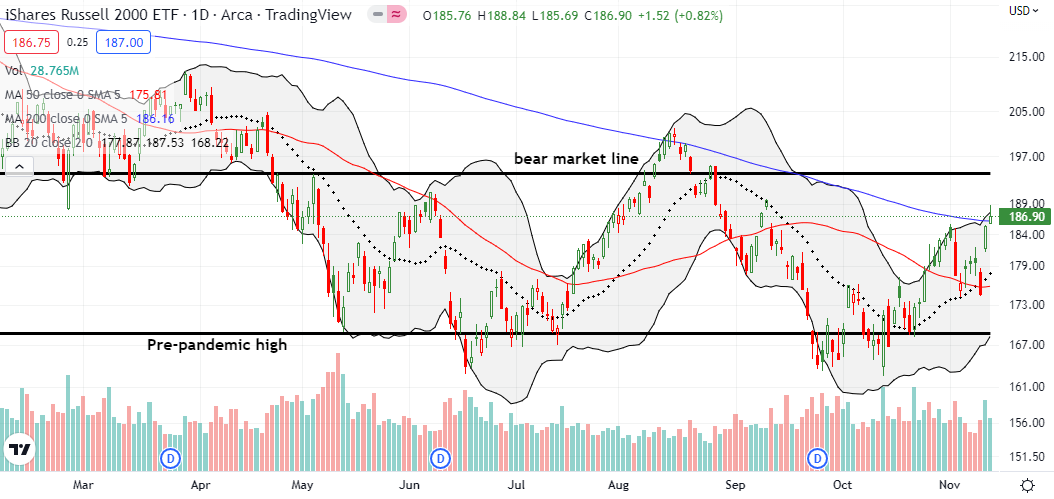
The iShares Russell 2000 ETF (IWM) once again did the major indices one better. IWM flipped from distraught on a 50DMA breakdown to a 200DMA breakout. The ETF of small caps is riding high after a 6.2% gain followed by a 0.9% jump. Only the intraday fade from the September peak casts a cloud over the prospects for a fresh run to the bear market line.
Stock Market Volatility
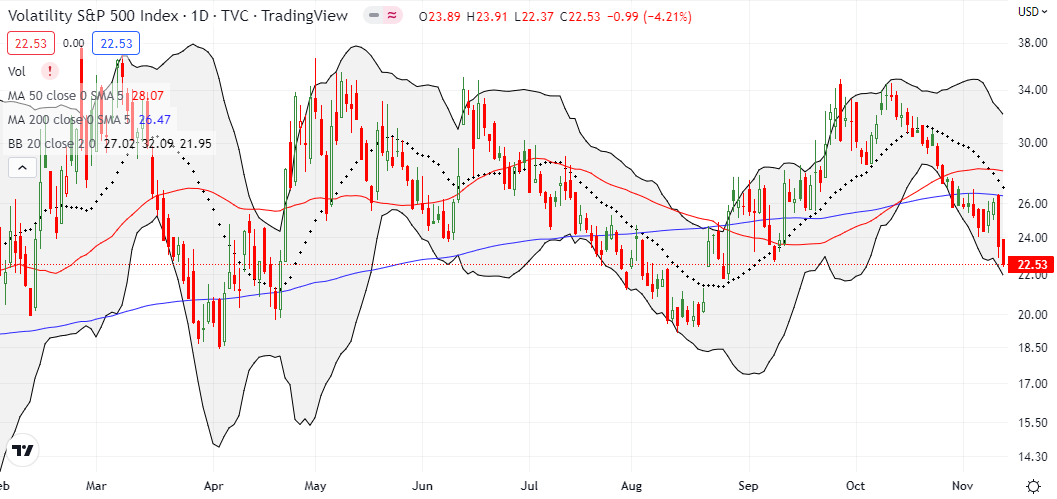
The volatility index (VIX) enjoyed two days of gain before relenting to bullish trading pressures. The mere 2.2% gain on Wednesday’s distraught trading was an early sign of the bullish potential ahead. The VIX ended the week near a three month low and looks set to challenge the critical 20 level.
The Short-Term Trading Call With Distraught to Overbought
- AT50 (MMFI) = 71.3% of stocks are trading above their respective 50-day moving averages (1st overbought day)
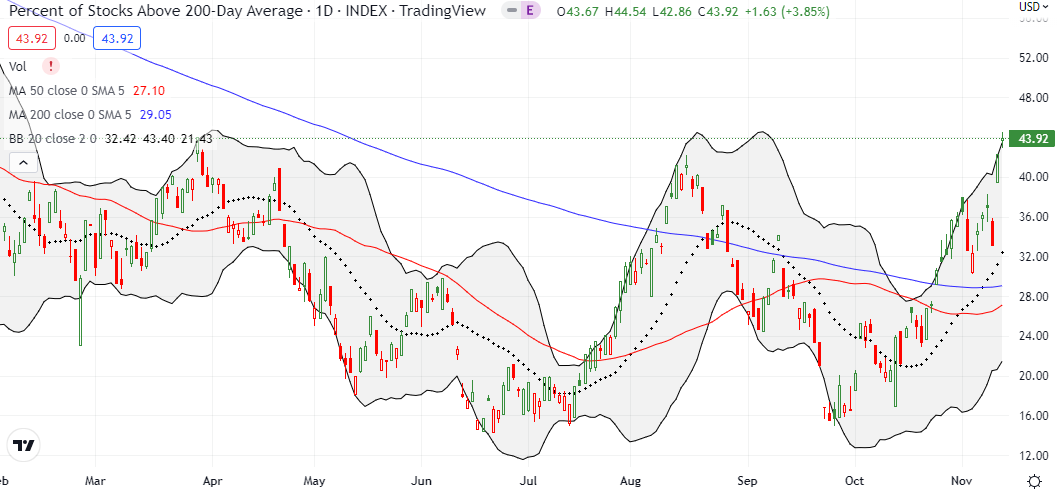
- AT200 (MMTH) = 43.9% of stocks are trading above their respective 200-day moving averages
- Short-term Trading Call: cautiously bullish
AT50 (MMFI), the percentage of stocks trading above their respective 50DMAs, guided my thinking all week. On Wednesday’s distraught trading, my favorite technical indicator did not break through the previous low. Now AT50 is in overbought territory for the first time since August when the stock market printed a major peak. Regular readers should recall that overbought conditions are not sufficient for bearishness. Instead, AT50 signals bearish conditions after it transitions out of overbought conditions and closes below 70%. Note well that AT200 (MMTH), the percentage of stocks trading above their respective 200DMAs, adds to the bullish case with a close at an 8-month high which in turn is near the highest level of the year.
The force of last week’s buying and the distance to next levels of resistance convinced me to leave the short-term trading call at cautiously bullish instead of flipping neutral. Moreover, it makes little sense to flip to neutral just two days out from distraught trading. Hopefully, motivated sellers have washed themselves out the system for now. Still, I will flip to neutral once AT50 closes below 70% whenever that happens. I will go to bearish once AT50 makes a second lower close from there.
Since bear markets are so rare, it is easy to get fooled by rallies. The tweet below shows chilling similarities between today’s bear market trading and the trading in the bear market of 2008-2009. Back then, the typical seasonal tailwinds were overwhelmed by the gravity of the meltdown in financial markets. The Federal Reserve was pedaling as fast it could and having minimal effect. This time around, the seasonal factors have more of a chance given the unconstrained and unfettered optimism granted to the decline in the CPI. The Federal Reserve has actively worked against the stock market all year, so any change, anticipated or real, from the Fed can ignite asset prices to the upside.
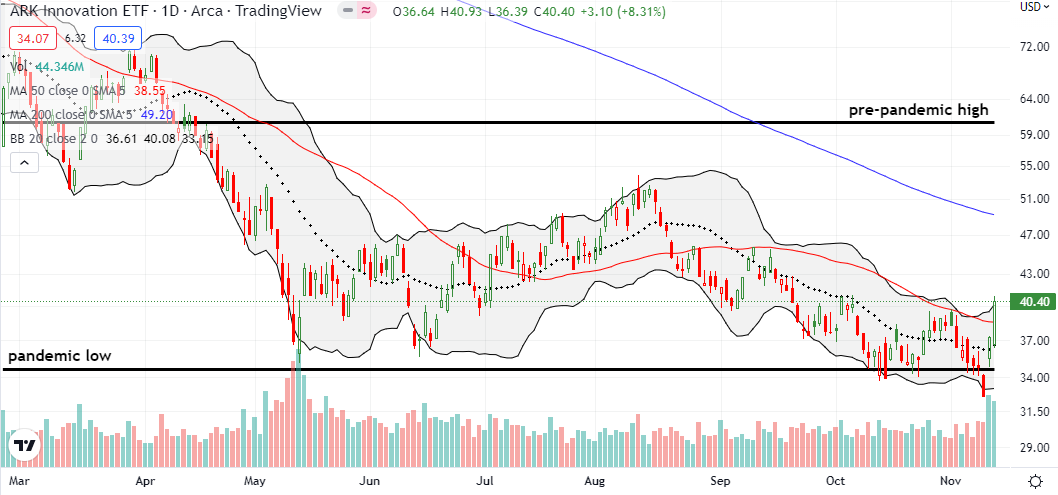
ARK Innovation ETF (ARKK) provided a dramatic reversal off distraught levels of trading. On Wednesday, ARKK fell 6.5% and closed at a 5-year low. I used the selling to take profits on a diagonal put spread. As the selling continued, I decided to roll into a larger put position. The next day’s 14.5% surge essentially wiped out that position in a flash! Buyers followed up with a convincing 8.3% surge that took ARKK above its 50DMA for the first time since August.
While the end of that downtrend is not yet confirmed, ARKK is in a promising position. I now need to think through whether to sell my shares or sell calls against them. I am leaning toward the latter given the upside potential of ARKK in a bear market rally where traders reflexively rush for the worst performing, most speculative stocks.
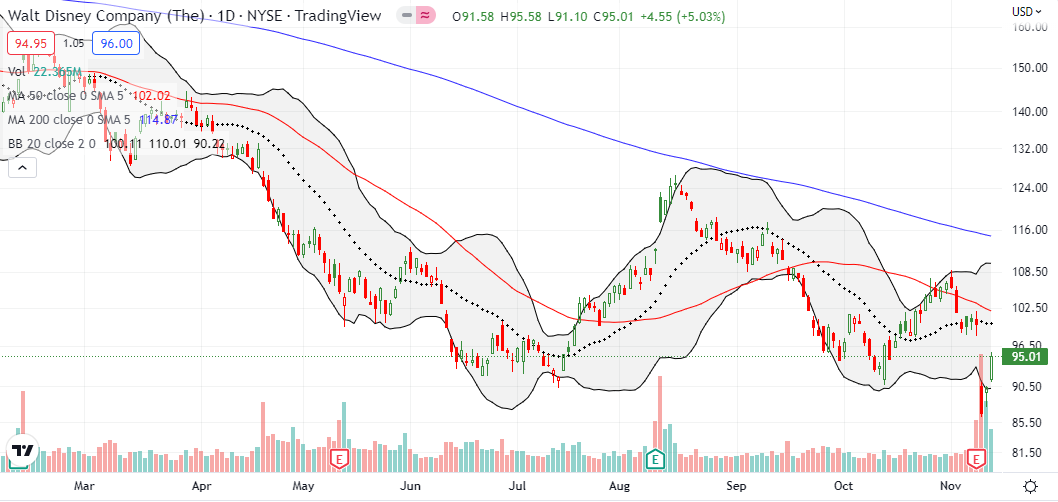
The Walt Disney Company (DIS) had the misfortune of reporting earnings ahead of distraught Wednesday. I had to rub my eyes after the dust settled: a 13.2% post-earnings loss that took DIS close to its pandemic lows. Disney’s issues with squeezing profits from streaming hardly compare to the catastrophic prospects of a global economic shutdown. Yet, here we are. I was tempted to add to my shares, but I decided to wait for the stock to settle down. The subsequent daily rebounds of 4.3% and 5.0% are a good start.
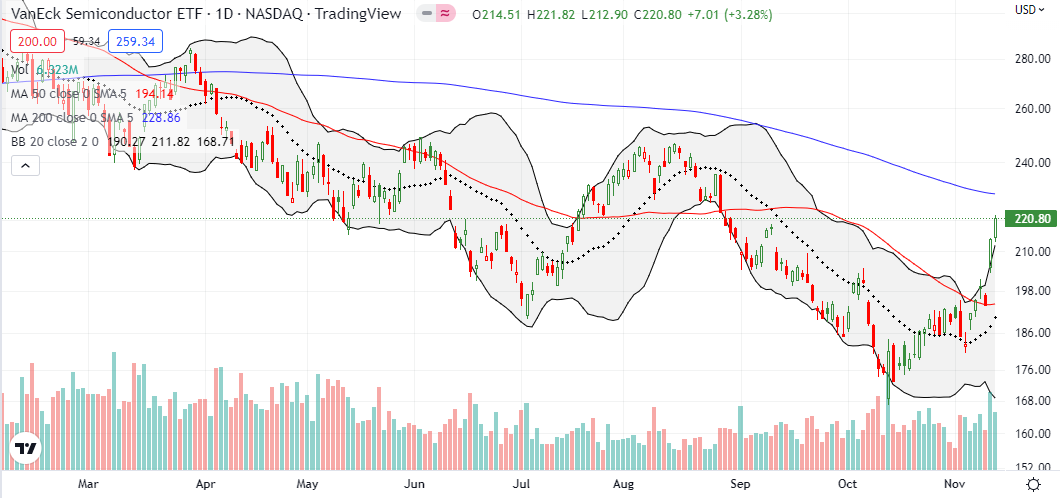
During a 27.5% run-up from the October lows, the VanEck Semiconductor ETF (SMH) served as a hedging tool. Emboldened by successfully fading SMH off 200DMA resistance in October, I bought various put option configurations. Only a picture-perfect pullback from 50DMA resistance delivered fresh profits. My skepticism on SMH blinded me to the upside opportunity once SMH broke out above its 50DMA. SMH is suddenly back in favor with a 13.8% gain in just the last two days. I will of course be watching even more closely as SMH challenges 200DMA resistance from this overbought position stretched well above the upper Bollinger Band (BB). Ironically, SMH put options are an even better hedge at this juncture.
With my eyes more focused on non-tech, I did NOT miss this picture-perfect 200DMA breakout for VanEck Steel ETF (SLX). I bought a half position of shares (options volumes are anemic) that I will complete if SLX retests 200DMA as support.
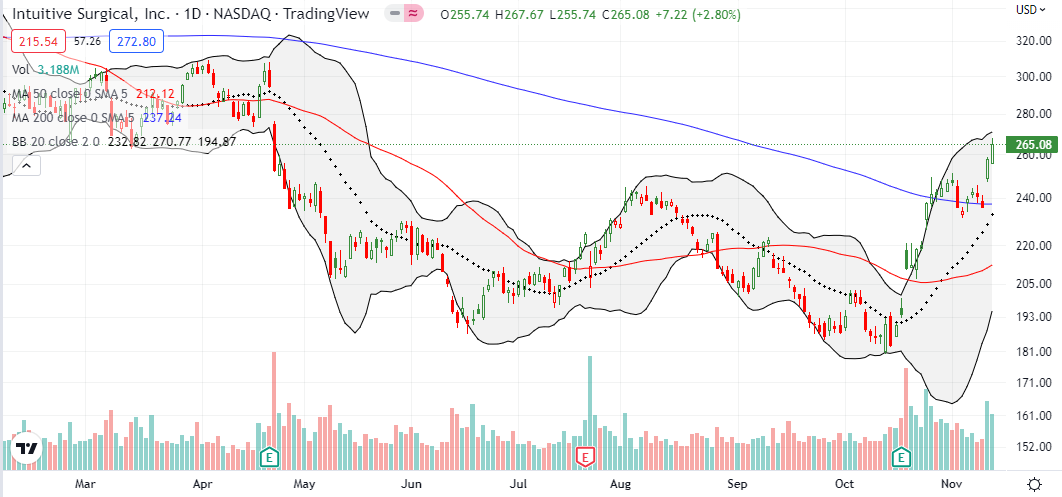
I made the bullish case for Intuitive Surgical, Inc (ISRG) after a post-earnings 50DMA breakout. Yet, I was slow to move. A subsequent 200DMA breakout forced me to action with shares and a January $260/$275 call spread. After some churn and pivoting around the 200DMA, ISRG delivered convincing results in the market’s latest rally.
Be careful out there!
Footnotes
“Above the 50” (AT50) uses the percentage of stocks trading above their respective 50-day moving averages (DMAs) to measure breadth in the stock market. Breadth defines the distribution of participation in a rally or sell-off. As a result, AT50 identifies extremes in market sentiment that are likely to reverse. Above the 50 is my alternative name for “MMFI” which is a symbol TradingView.com and other chart vendors use for this breadth indicator. Learn more about AT50 on my Market Breadth Resource Page. AT200, or MMTH, measures the percentage of stocks trading above their respective 200DMAs.
Active AT50 (MMFI) periods: Day #20 over 20%, Day #16 over 30%, Day #14 over 40%, Day #2 over 50%, Day #2 over 60%, Day #1 over 70% (overperiod ending 54 days 50 under 70%)
Source for charts unless otherwise noted: TradingView.com
Full disclosure: long IWM calendar call spread, short IWM put spread, long SPY calendar call spread and vertical spread, long QQQ call spread, long ARKK shares and puts, long ISRG shares and call spread, long SLX, long DIS, long SMH put
FOLLOW Dr. Duru’s commentary on financial markets via StockTwits, Twitter, and even Instagram!
*Charting notes: Stock prices are not adjusted for dividends. Candlestick charts use hollow bodies: open candles indicate a close higher than the open, filled candles indicate an open higher than the close.


