Stock Market Commentary:
And then there was just one. The S&P 500 (SPY) is once again the lone index of three that still trades just outside the clutches of the bear. The signs were flashing red last week as the bear market looked like it warmed right back up. The technicals of market breadth combined with significant resistance levels to deliver insight and drive action.
The U.S. dollar took center stage as the fear factor. The euro dropped below parity (1.0) against the dollar again and hit levels last seen in late 2002. The British pound fell toward its pandemic low against the U.S. dollar. Below that level sits an exchange rate last seen in early 1985. The bond market is back to taking inflationary pressures more seriously with a fresh push higher in long-term bond yields. In other words, the Federal Reserve’s posturing at the annual Jackson Hole confab at the end of this week takes on even more significance. The run-up in Fedspeak has stayed the hawkish course and defied those who expect (and need) the Fed to play nice again. So all ears will likely strain for even the slightest hint that the Fed wants to lean against dollar strength.
The Stock Market Indices
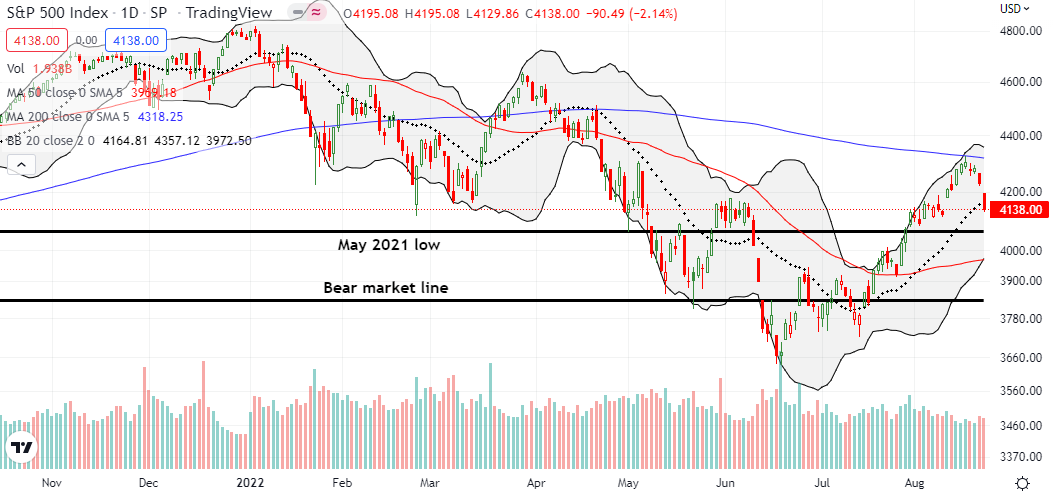
The S&P 500 (SPY) remains far above bear market territory. However, the index added stronger confirmation of resistance at its 200-day moving average (DMA) (the blue line below) with a close below its uptrending 20DMA (the dotted line). The 2.1% loss took the S&P 500 below its June high and put a retest of the May, 2021 low into play. I took profits on my weekly SPY put spread which was a play for a test of 20DMA support.
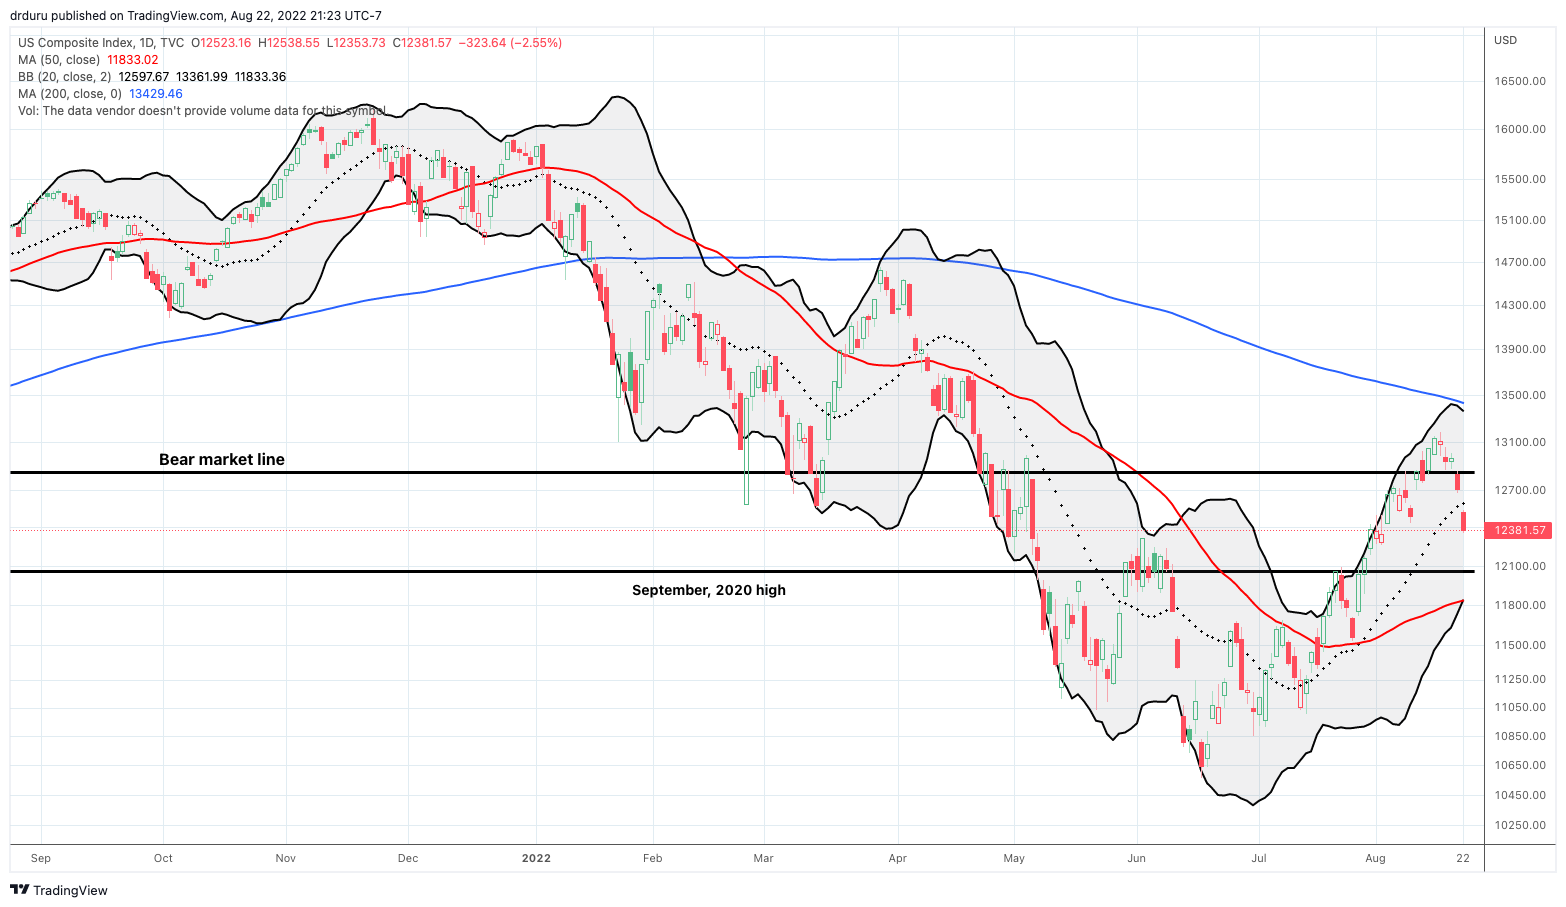
The NASDAQ (COMPQ) started the week in a bear market. The tech laden’s 2.6% plunge confirmed the return of the bear. While the NASDAQ avoided breaking below the June highs, a test of the September, 2020 high still looks in play. I took profits on my September put spreads and kept the October put spread.
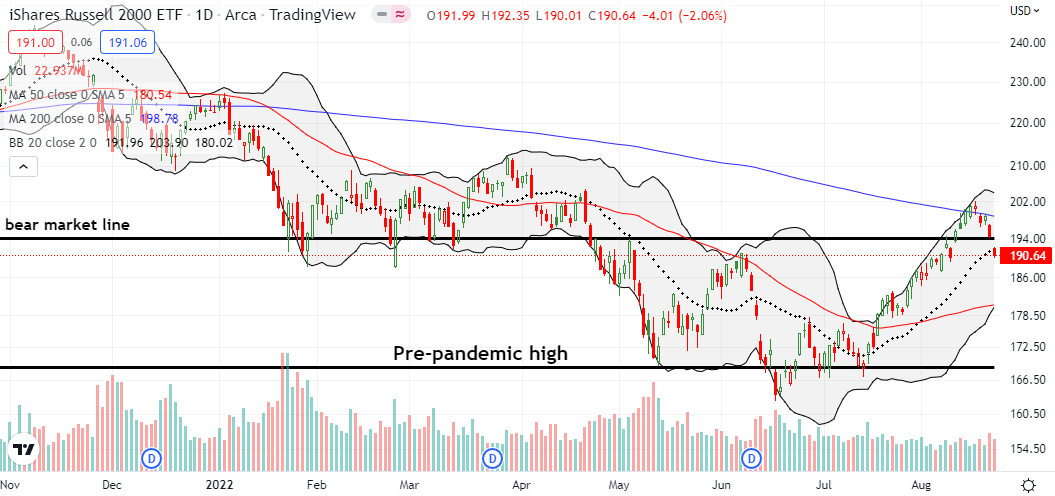
The iShares Russell 2000 ETF (IWM) tried its best at the end of last week to avoid bear market territory. Today, the ETF of small caps wasted no time gapping down into bear market territory. The 2.0% loss took IWM back to its June high and put a test of 50DMA (the red line below) support into play. Like the NASDAQ, IWM more definitively confirmed overhead resistance at its 200DMA.
Stock Market Volatility
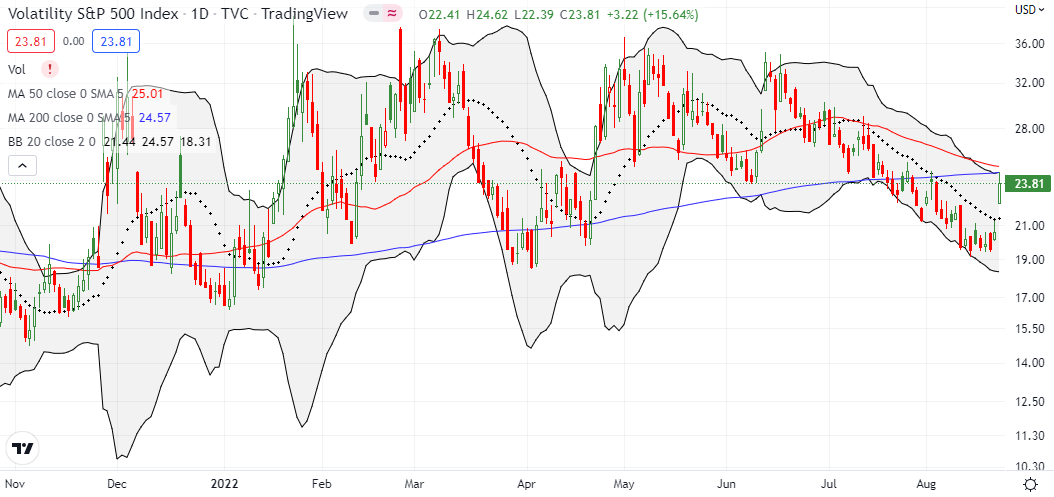
The downtrend for the volatility index (VIX) came to an end in spectacular fashion. After pivoting around the critical 20 level, the VIX launched higher for a 15.6% gain. The VIX closed at its August high and is one push away from a fresh run-up to the recent highs between 32 and 36. In my last “Market Breadth” I stated “a close above the 20DMA will get my attention and essentially confirm an end to the downtrend and the return of bear market trading action.” I am standing straight up at attention.
The Short-Term Trading Call for a Bear Market Comeback
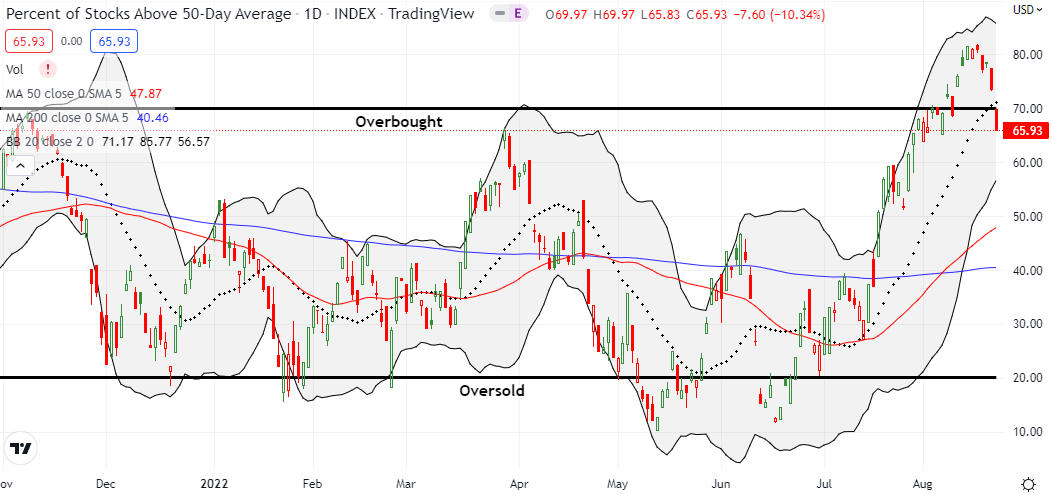
- AT50 (MMFI) = 65.9% of stocks are trading above their respective 50-day moving averages (ended 8-day overbought period)
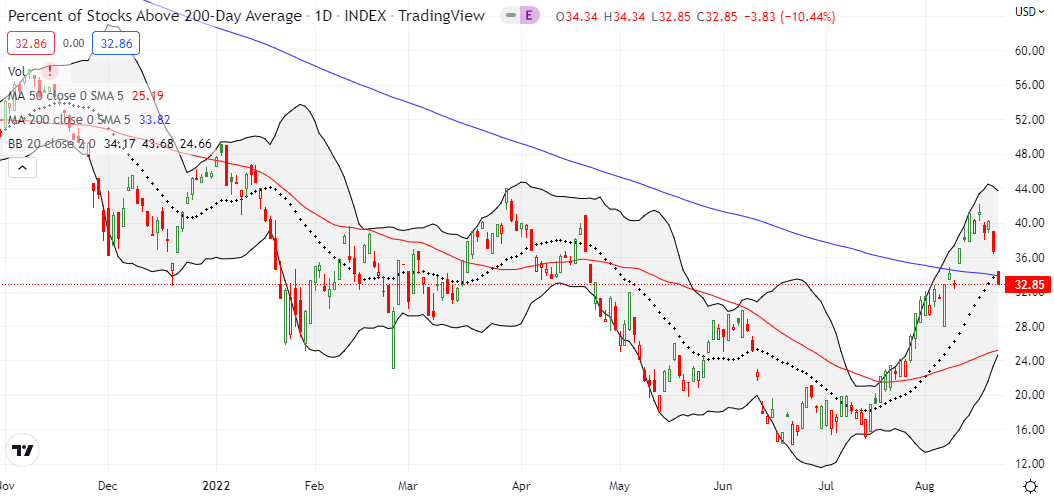
- AT200 (MMTH) = 32.9% of stocks are trading above their respective 200-day moving averages
- Short-term Trading Call: bearish
AT50 (MMFI), the percentage of stocks trading above their respective 50DMAs, did not drop as far as I thought it might. My favorite technical indicator fell from 73.5% to 65.9%. Still, this was a significant move because it ended overbought conditions. By rule, I shifted the short-term trading call out of neutral and into bearish. I skipped right over “cautiously bearish” because I think rallies should be sold from here until/unless the S&P 500 confirms a 200DMA breakout.
The S&P 500’s -1.7% performance during the overbought period added to the bearish burden of the trading action. While this negative return was in-line with historical behavior, a positive return would have made me less bearish on this sharp drop out of overbought conditions. Given the Jackson Hole catalyst, I plan to take more profits on bearish positions on further downside. I suspect the worse the market performs going into Jackson Hole, the more conciliatory the Fed may act. I will likely wait to fade rallies until after the Fed says what it has to say at Jackson Hole. With the CME FedWatch now indicating the market assigns a 59% chance for a 75 basis points (bps) rate hike next month and thinks the Fed will keep hiking until it hits 4.0% next year, there is room once more for a pleasant surprise for the market.
Be careful out there!
Footnotes
“Above the 50” (AT50) uses the percentage of stocks trading above their respective 50-day moving averages (DMAs) to measure breadth in the stock market. Breadth defines the distribution of participation in a rally or sell-off. As a result, AT50 identifies extremes in market sentiment that are likely to reverse. Above the 50 is my alternative name for “MMFI” which is a symbol TradingView.com and other chart vendors use for this breadth indicator. Learn more about AT50 on my Market Breadth Resource Page. AT200, or MMTH, measures the percentage of stocks trading above their respective 200DMAs.
Active AT50 (MMFI) periods: Day #35 over 20%, Day #29 over 30%, Day #22 over 40%, Day #22 over 50%, Day #16 over 60%, Day #1 under 70% (ending 8 days overbought)
Source for charts unless otherwise noted: TradingView.com
Full disclosure: long QQQ put spread
FOLLOW Dr. Duru’s commentary on financial markets via StockTwits, Twitter, and even Instagram!
*Charting notes: Stock prices are not adjusted for dividends. Candlestick charts use hollow bodies: open candles indicate a close higher than the open, filled candles indicate an open higher than the close.


