Stock Market Commentary:
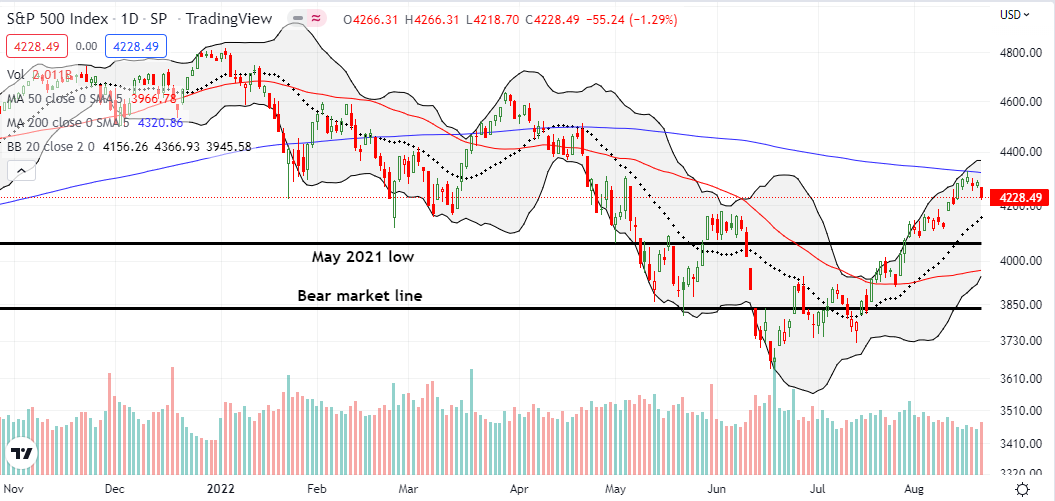
Now I see why there was so little fanfare about the end of the bear market. Last week’s trading looks like a warm-up for a bear market comeback. The S&P 500 and the iShares Russell 2000 ETF (IWM) printed bearish confirmations of resistance at their respective 200-day moving averages (DMAs) (the blue line in the charts below). The NASDAQ actually returned to bear market territory while IWM barely escaped the same setback. Finally, the volatility index (VIX) valiantly held on to the 20 level which defines elevated volatility. The only remaining setback to come is an end to overbought trading conditions which the market breadth trading rules defines as a bearish move.
At this latest market juncture, I am keeping a close eye on Apple Inc (AAPL). AAPL sprinted its way almost non-stop from the June lows. The stock never even touched its 20DMA (the dotted line below) after breaking out in early July. AAPL barely even paused at 200DMA resistance a whole month before the S&P 500 tested its own 200DMA resistance. This extremely bullish behavior led the market higher and push through what I thought was a bear market tease. Thus, AAPL’s behavior could deliver a final confirmation of a change in sentiment.
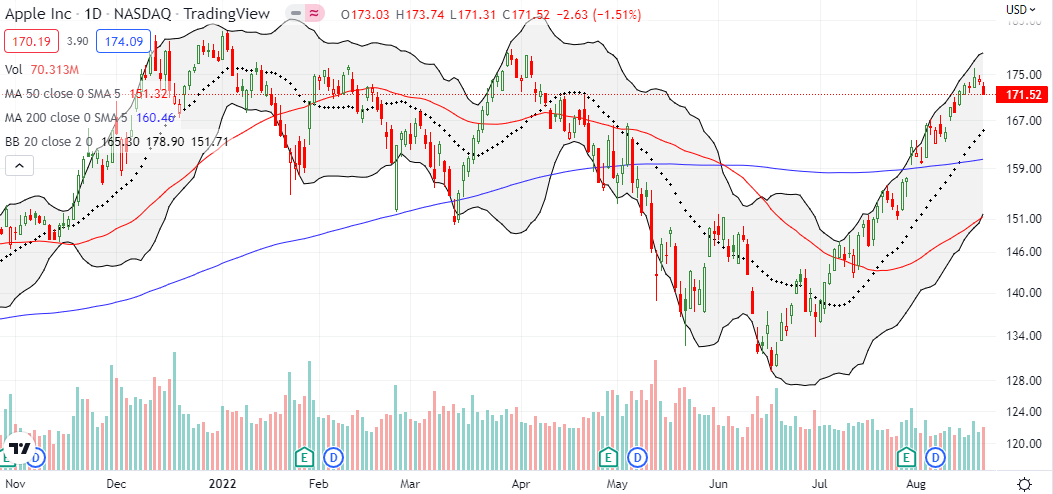
Carter Worth took the Apple technicals to an outright bearish conclusion.
The Stock Market Indices
The bullish positioning for the S&P 500 (SPY) came into question last week. On Tuesday, the index perfectly tapped its 200DMA resistance on an intraday basis. The inability to follow through led to Friday’s 1.3% loss and confirmation of 200DMA resistance. This bearish move looks like a warm-up for a comeback of the bear market. Accordingly, I jumped into a “warm-up” SPY $420/$415 put spread that expires on Friday. This position is a play on a test of 20DMA support. The S&P 500 confirms bearishness with a fresh breakdown below its May, 2021 low. A fresh breakdown below 50DMA support would put the bear market line back in play.
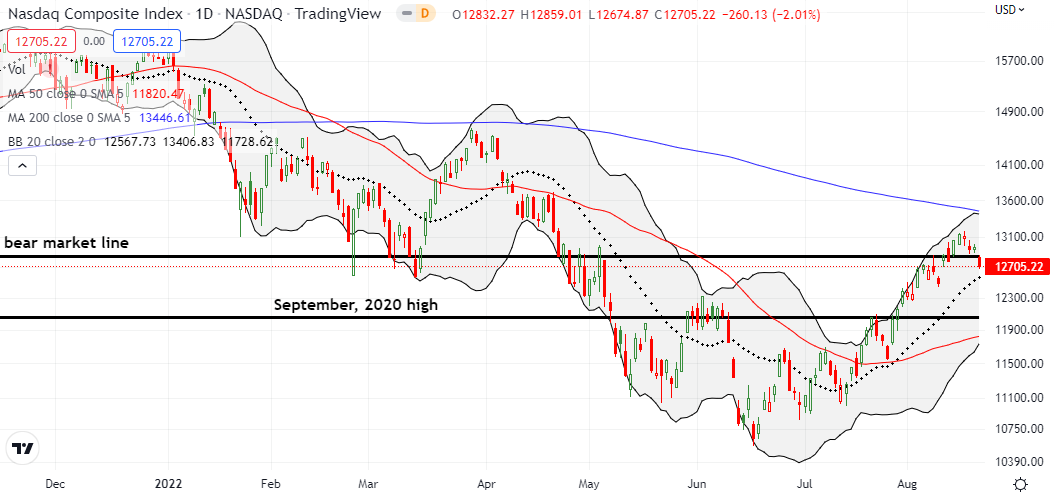
The bear market already made a comeback for the NASDAQ (COMPQ). Friday’s 2.0% loss for the tech-laden index was the biggest setback for the extended overbought rally. Buyers and bulls will get their next test at nearby uptrending 20DMA support. In the meantime, I used this comeback for the bear market as a signal to increase my weekly bearish (hedging) bets on QQQ puts. However, instead of weeklies, I went out to September and October expirations given the high potential for a near-term rebound from 20DMA support. I took on $315/$300 put spreads expiring in September and October.
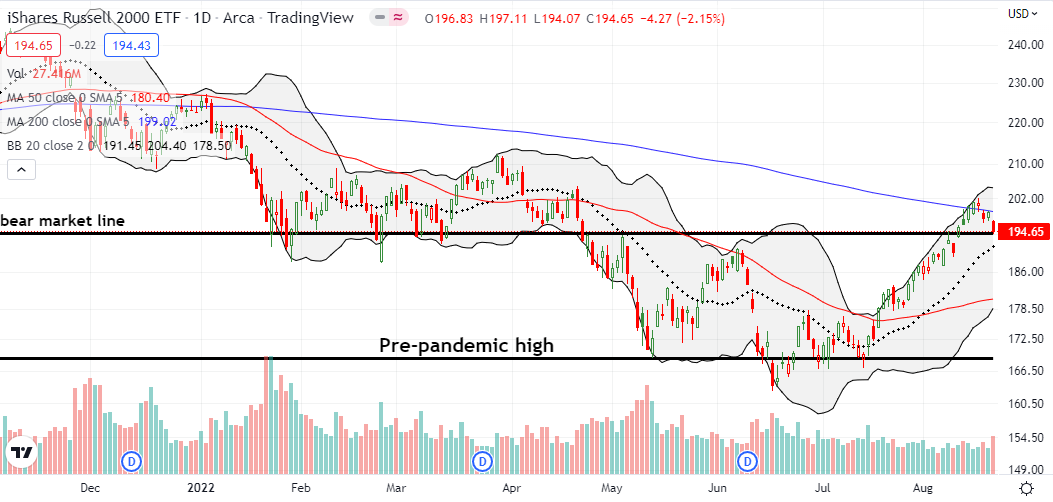
The iShares Russell 2000 ETF (IWM) somehow managed to close right on top of its bear market line after a bearish confirmation of 200DMA resistance. Like the NASDAQ, uptrending 20DMA support could provide a springboard for a buyer’s comeback if IWM slips into bear market territory. I made no moves on IWM. I prefer to buy a dip to 50DMA support if IWM makes it that far into bear market territory.
Stock Market Volatility
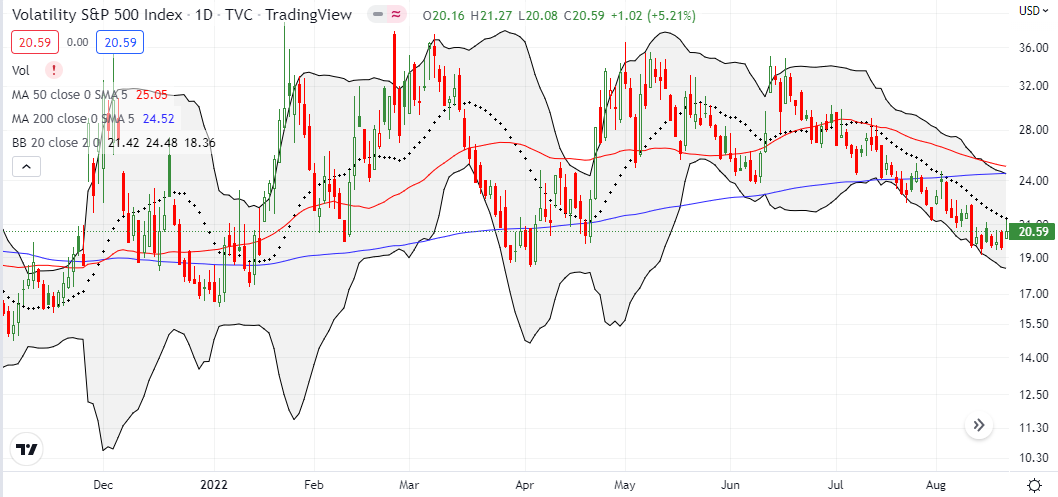
The downtrend remains alive and well for the volatility index (VIX). However, the ability to pivot around the 20 level is a potential warm-up for a bear market comeback. A close above the 20DMA will get my attention and essentially confirm an end to the downtrend and the return of bear market trading action.
The Short-Term Trading Call for a Bear Market Comeback
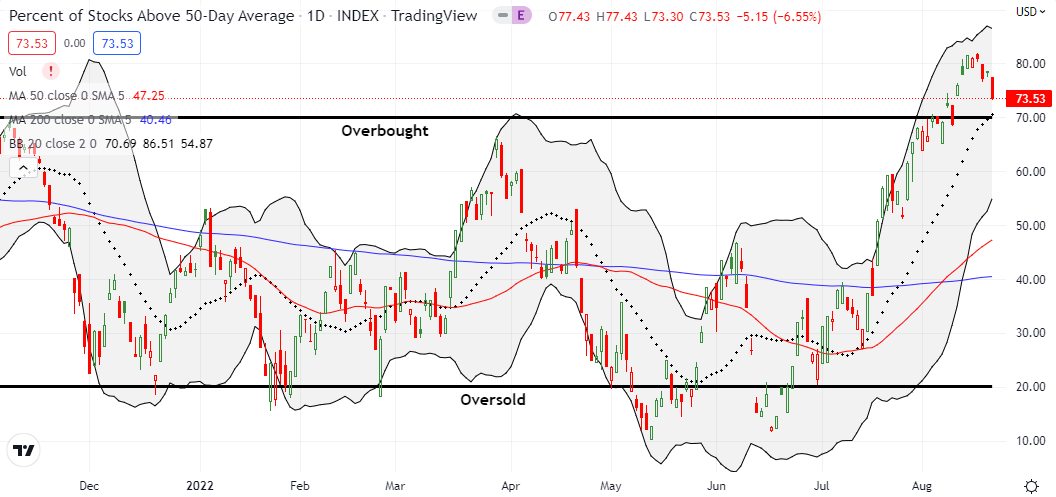
- AT50 (MMFI) = 73.5% of stocks are trading above their respective 50-day moving averages (overbought day #8)
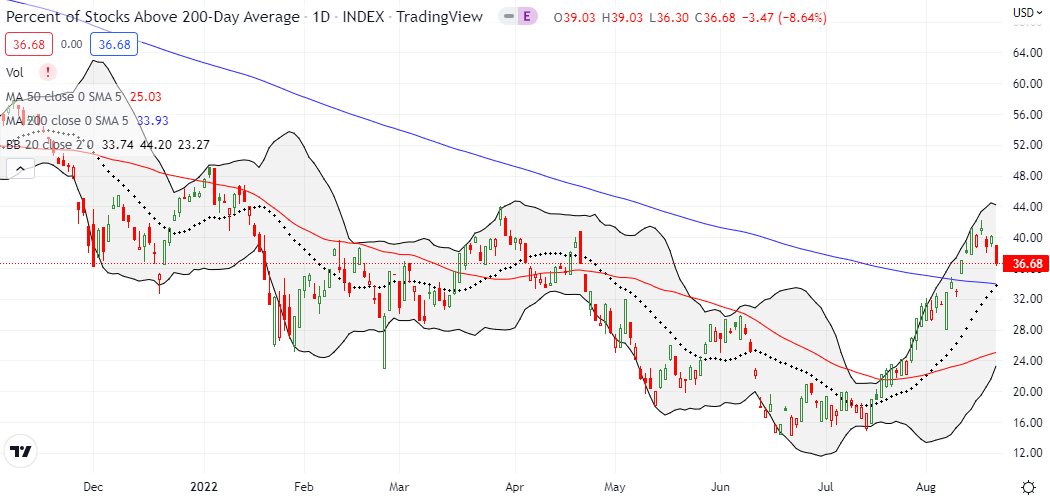
- AT200 (MMTH) = 36.7% of stocks are trading above their respective 200-day moving averages
- Short-term Trading Call: neutral
AT50 (MMFI), the percentage of stocks trading above their respective 50DMAs, enjoyed just a 3-day stint above 80%. My favorite technical indicator closed the week at 73.5%. AT50 is now within range of confirming a comeback for the bear market. A close below the 70% overbought threshold will trigger a bearish signal per the AT50 trading rules. My SPY and QQQ put positions are hedges until AT50 flips the short-term trading call to (cautiously) bearish. Accordingly, I married those puts with some buy-the-dip trades in ARK funds. See “A Sunny Mid-Summer Assessment of the ARK Bottom” for an explanation for my strategy for speculating in the ARK funds. I included shares in case I have to sit through a new bear market wave to get to the other side.
Three stock charts stuck out to me in addition to Apple (AAPL) as keys to watch for this warm-up for a comeback of the bear market.
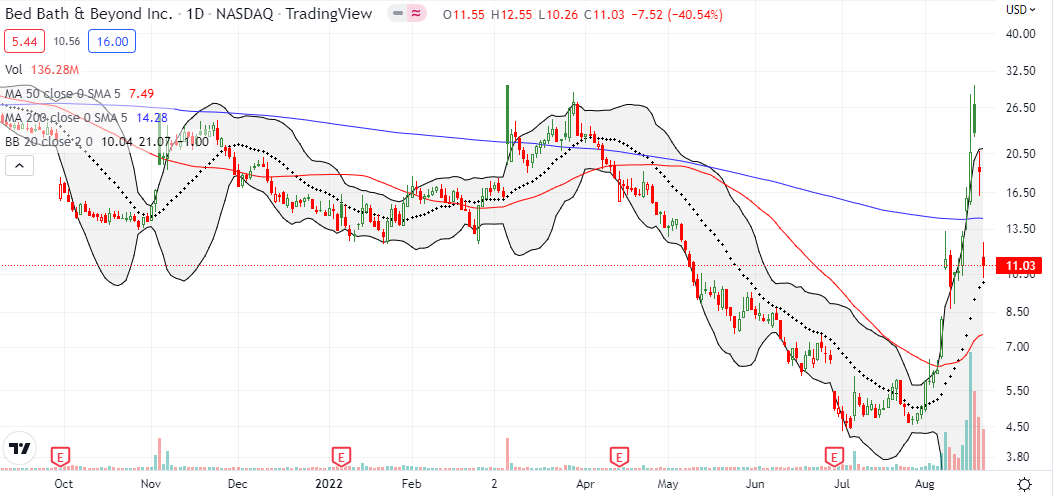
Debt-burdened Bed Bath & Beyond rode fresh speculative fever after GameStop (GME) Chairman Ryan Cohen made what looked like bullish bets on BBBY. The bubble suddenly burst as Cohen turned around and disclosed sales. A Friday filing disclosing liquidation of Cohen’s entire holding sent BBBY further down in the after hours. The whole episode looks suspicious. Even if Cohen did not break the law, all the trading activity has the APPEARANCE of misleading investors and traders to get a higher sales price. Regardless, I might look back at BBBY’s stratospheric resurrection and disastrous collapse as one big signal that warmed up a comeback for the bear market. It was a bad week for speculative assets as BBBY’s selling triggered big declines in other meme stocks (including GME of course) and accompanied deep selling in ARK funds and cryptocurrencies.
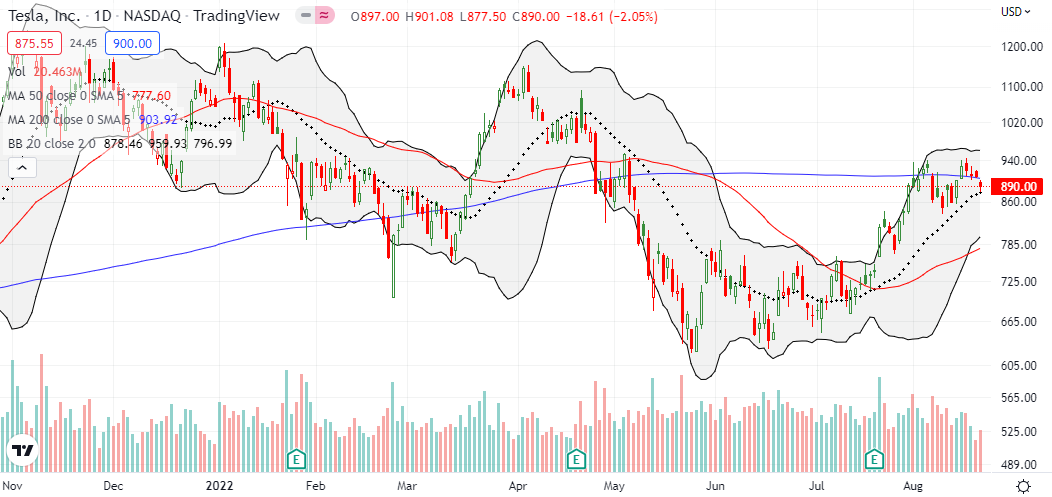
I wrote two weeks ago about signs of rally fatigue in Tesla, Inc (TSLA). After first nudging higher, TSLA did indeed falter. However, the stock found enough support at its uptrending 20DMA to mount a comeback to 200DMA resistance. If a bear market makes a comeback, I fully expect TSLA to lose this fight in the process. The sign of rally fatigue will then become a portent of a resurrected bear market.
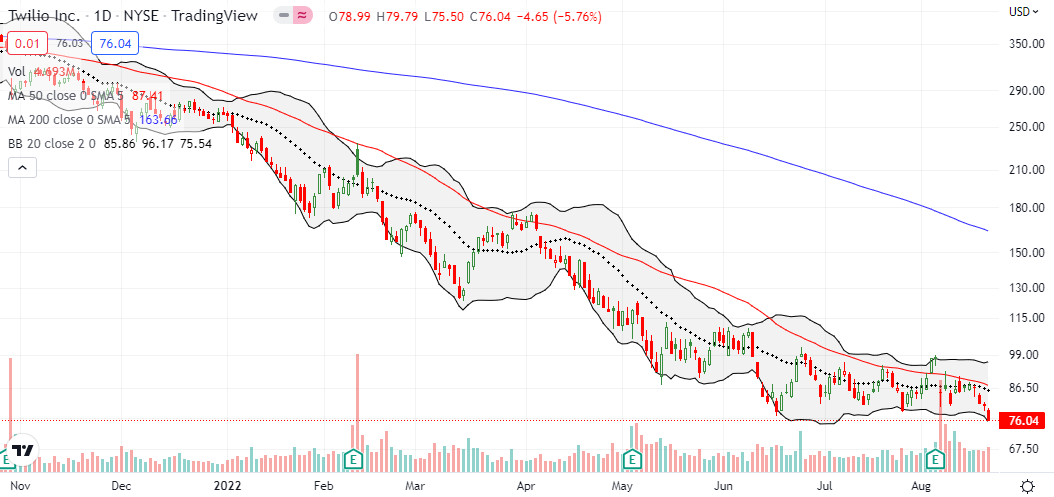
Twilio Inc (TWLO) caught my attention after I saw a 52-week low alert for the cloud software stock. The chart below shows TWLO barely benefited from the big rebound from the June lows. TWLO scratched along in a tight trading range until a 13.5% post-earnings loss energized sellers and/or exhausted buyers. TWLO closed the week at a 27-month low and is a mere $5 above its pandemic low. This relapse into bear market action is a very bad sign for similar SaaS stocks in the sector.
The WoodShed
With speculative stocks taking a beating, I made a timely catch-up with Cathie Wood missives. The Fed did not deliver on Wood’s expectations for a retreat from monetary tightening, and Fed-speak has been as hawkish as ever. Accordingly, Wood’s last “In the Know” webcast deepened the thesis of a horrible economy and a bumbling Fed following lagging indicators into overly tight monetary policy. Wood claimed “demand is falling apart” and “the economy is unraveling.” These dire observations are surreal given ARK fund positioning is essentially full steam ahead: “innovation solves problems” after all. Typical money managers with such fears would move to large holdings of cash. Ultimately, Wood expects the economy to come out of recession early next year. So perhaps, net-net, no Wood-follower should worry about the here and now anyway.
Be careful out there!
Footnotes
“Above the 50” (AT50) uses the percentage of stocks trading above their respective 50-day moving averages (DMAs) to measure breadth in the stock market. Breadth defines the distribution of participation in a rally or sell-off. As a result, AT50 identifies extremes in market sentiment that are likely to reverse. Above the 50 is my alternative name for “MMFI” which is a symbol TradingView.com and other chart vendors use for this breadth indicator. Learn more about AT50 on my Market Breadth Resource Page. AT200, or MMTH, measures the percentage of stocks trading above their respective 200DMAs.
Active AT50 (MMFI) periods: Day #34 over 20%, Day #28 over 30%, Day #21 over 40%, Day #21 over 50%, Day #15 over 60%, Day #8 over 70% (overbought day #8)
Source for charts unless otherwise noted: TradingView.com
Full disclosure: long QQQ put spreads, long SPY put spread, long ARKK shares and call and call spread
FOLLOW Dr. Duru’s commentary on financial markets via StockTwits, Twitter, and even Instagram!
*Charting notes: Stock prices are not adjusted for dividends. Candlestick charts use hollow bodies: open candles indicate a close higher than the open, filled candles indicate an open higher than the close.


My biggest position has been AAPL for 20 years and I’ve watched its relationships to tech and broad-market ETFs daily. In my view only Dan and Karen seem to understand those relationships. Dan’s point, that AAPL has swung 30% many times, is particularly salient.
To me, AAPL’s runup is not “unnatural”. AAPL always leads the market, and its chart merely reflects the change in sentiment from panic over the Fed’s rate-raises to comfortably looking past them. Nearing all-time highs it’s discounting the fact that 6 months from now the USA will be exiting a shallow Fed-induced recession as significant government spending aka “fiscal stimulus” overwhelms it. Much of that spending is on health care and infrastructure which are economically beneficial and anti-inflationary both short and long term. Even the spending on Ukraine military assistance has the effect of reducing upward pressure on prices of grain, energy, and indirectly other European exports.
You need to be a Fast Money guest! 🙂