
In “What Recession? Market Shows Love As Apple Leads the Way“, I raised a yellow flag on a critical test for the market at the overbought threshold. I described the conditions dividing the market from a bearish reversal and an extended bullish rally. The stock market left the situation in suspense by gapping down, falling further, rallying to new highs on the day, and then falling back to just under the day’s open. Those moves produced a trading stalemate. However, Tesla, Inc (TSLA) provided a clear trading example: potential rally fatigue in the form of the dreaded shooting star.
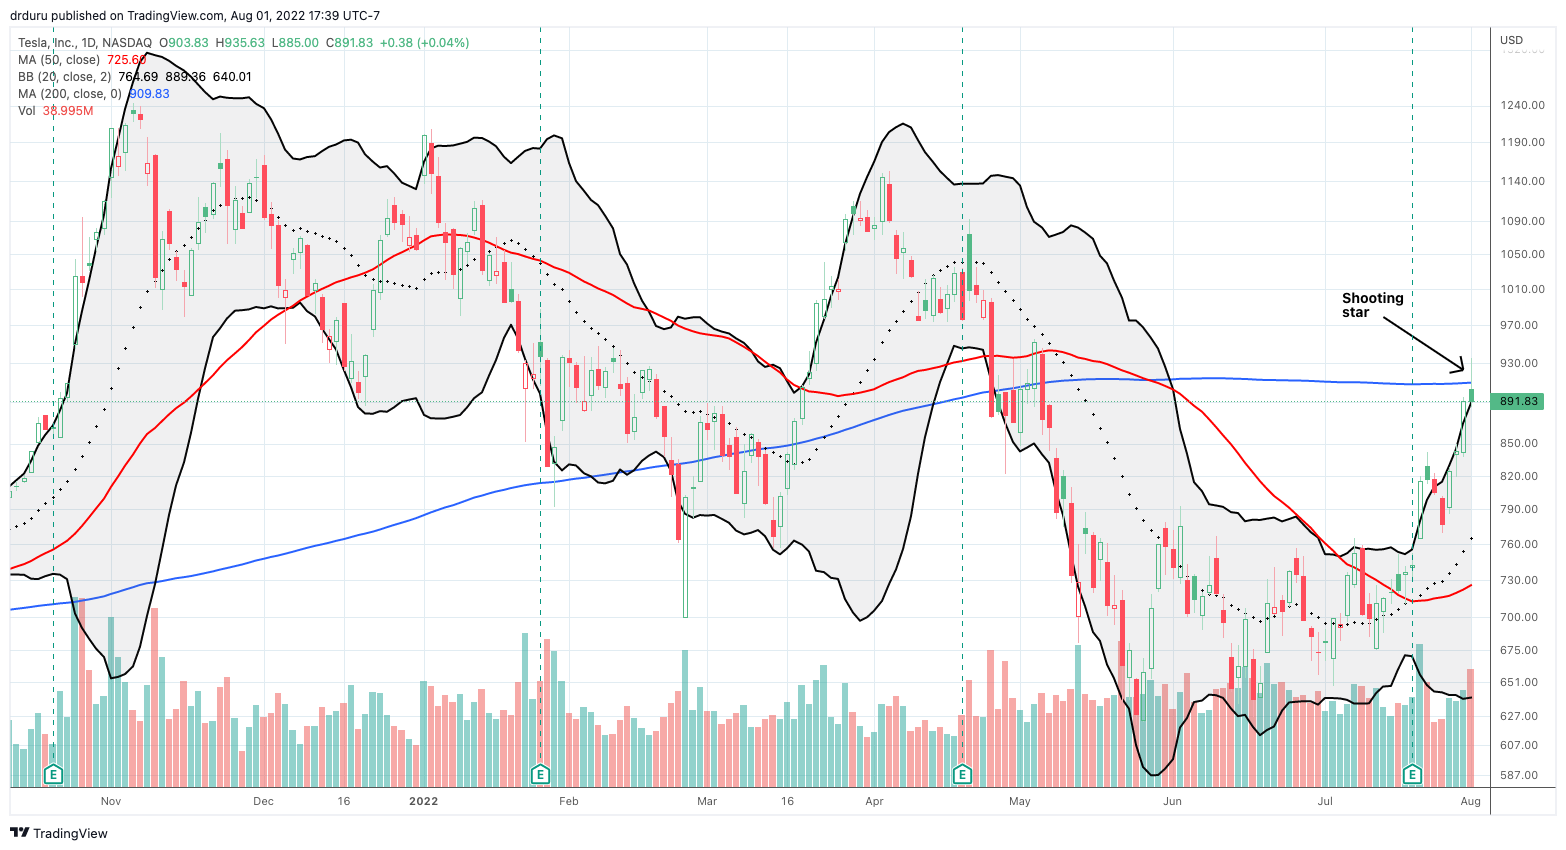
A shooting star is a reversal pattern that carries its highest significance after an extended and/or strong rally in price. The candlestick suggests exhaustion because buyers are unable to maintain momentum as sellers push price off a significant intraday high. Today, TSLA gapped higher for a 1.4% gain, rallied as high as up 5.0%, and finally faded back to a flat performance for the day. Not only did sellers succeed in pulling off a significant reversal, but also they eliminated what would have been a bullish breakout above resistance at the 200-day moving average (DMA) (the blue line above). A fakeout like this one carries doubly bearish weight.
A similar but less significant shooting star occurred on July 22nd. Subsequently, sellers followed through on the bearish pattern with a 1.4% loss and a 3.6% loss on two straight days. Upward, post-earnings resumed from that point. However, that trading cycle provides a mini blueprint. The bearish shooting star requires a confirmation in the form of a down day. TSLA suffered such a confirmation, but sellers were only able to benefit for one more day. A confirmation this time around would signal a bearish failure at 200DMA resistance…a relatively convincing sign of rally fatigue. On the flip side, invalidating this bearish signal would be VERY bullish for TSLA!
Full disclosure: no positions