Stock Market Commentary:
The bear market ended with a bullish counter, yet I noticed no celebratory or indicative headlines on CNBC. CNBC’s Fast Money included technical discussions but gave no reference to what I consider to be two major technical developments. The NASDAQ closed above its bear market line and joined the S&P 500 and IWM in the bear market recovery ward. IWM pried open a sliver of light in the dark tunnel with a bullish counter to the bear market: IWM pulled off a marginal breakout above its 200-day moving average (DMA) (the blue line in the chart). With the volatility index once again closing below the threshold that defines elevated levels, the bulls and buyers are firming up control of the stock market.
The stock market conquered a lot of bad news and poor sentiment to get to this point. So, with market breadth high in overbought territory, conditions look ripe for an extended rally…absent negative surprises of course.
The Stock Market Indices
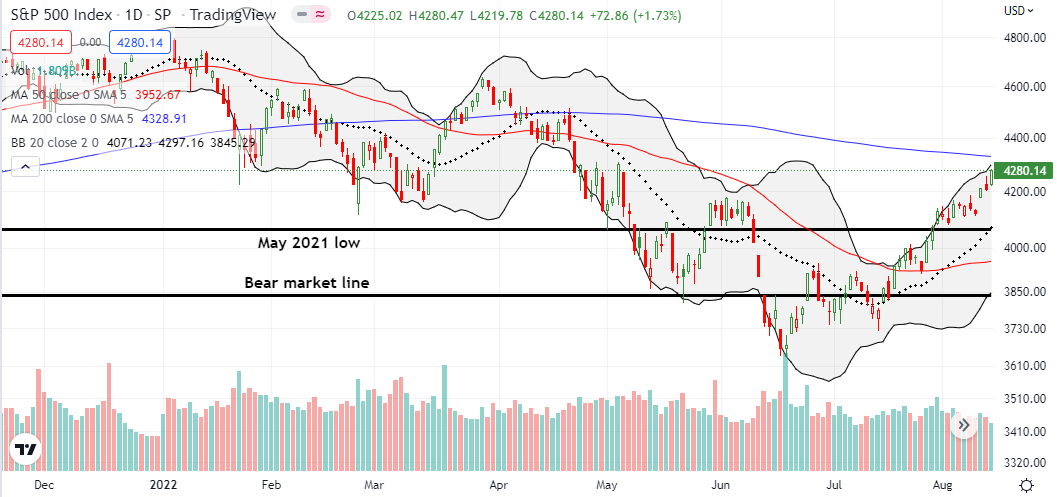
The bear market ended for the S&P 500 (SPY) almost a month ago. Since then, the index has ground steadily higher. Last week delivered the fourth up week in a row. The week closed on Friday with a 1.7% gain and a 3-month high. Suddenly, a test of critical resistance at the 200DMA is a 1-day rally away. A breakout would open the prospect for quite the sustained, extended overbought rally.
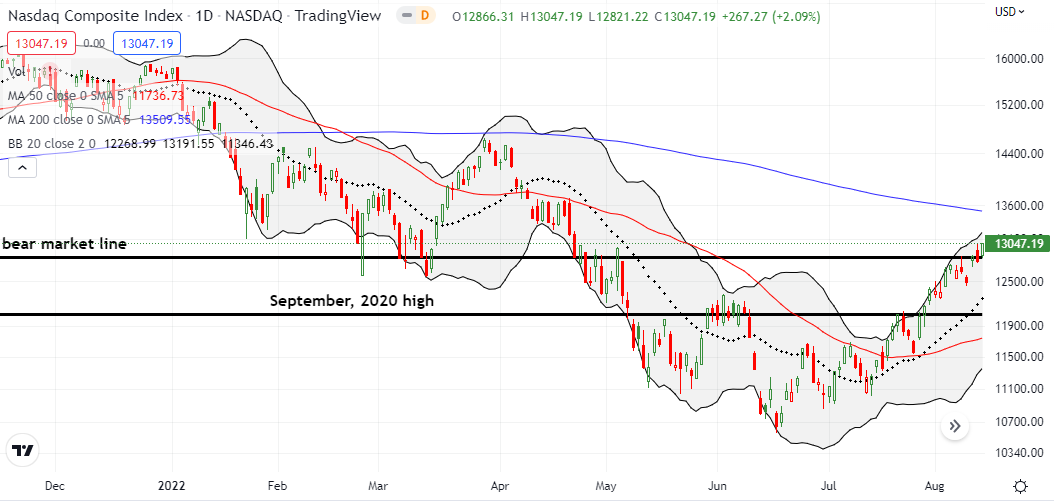
The bear market ended for the NASDAQ (COMPQ) after what was an ominous fakeout the day before. The tech laden index surged 2.1% on Friday and closed definitively above the bear market line. The NASDAQ was the last of the three major indices stuck in a bear market. In my book, this milestone ends the bear market for the stock market. Still, I bought a single QQQ weekly put as a partial hedge on what is otherwise bullish positioning for short-term trades. I plan to buy at least one (hedging) QQQ put every week during this overbought period.
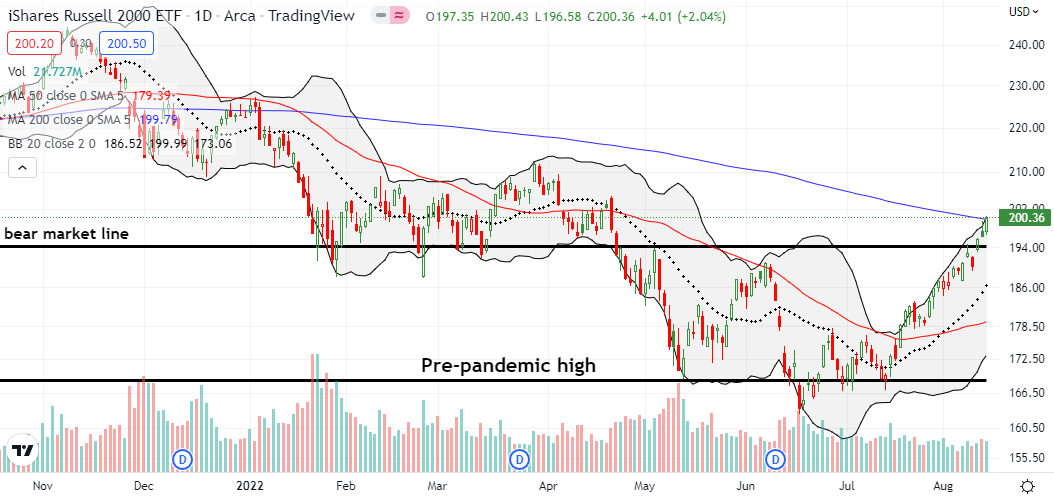
The bear market ended for the iShares Russell 2000 ETF (IWM) in the middle of last week. I did not see any CNBC fanfare for that event either. Now, IWM is pulling off what seemed impossible not long ago: a 200DMA breakout, a bullish counter to months and months in various forms of a bear market. While the move is marginal, I still consider it significant because IWM is just one higher close from confirming a very bullish event. I now look back on my quick sale of my IWM call spread and just shake my head!
Stock Market Volatility
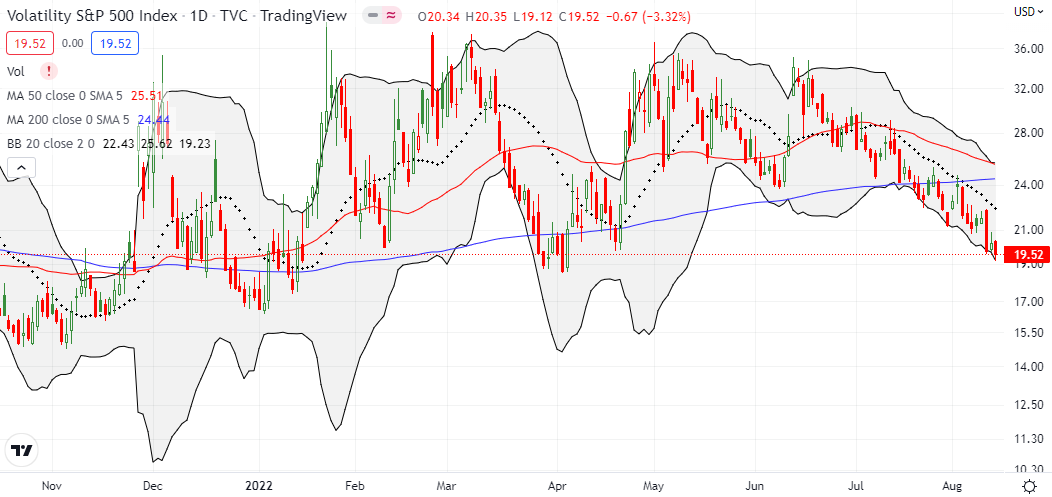
The volatility index (VIX) shows the same old story. The downtrend for the VIX remains well intact and undisturbed since the June outburst.
The Short-Term Trading Call Given the Bear Market Ended
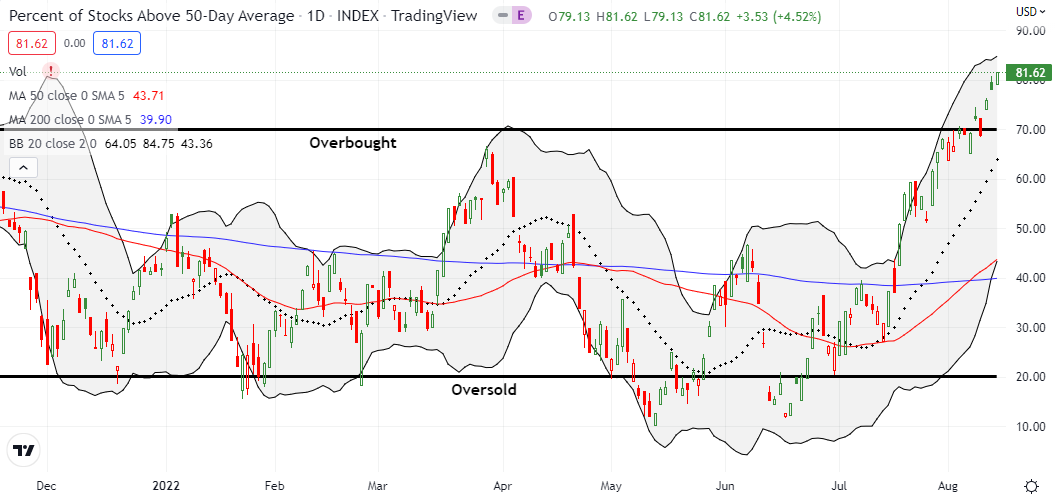
- AT50 (MMFI) = 81.6% of stocks are trading above their respective 50-day moving averages (overbought day #3)
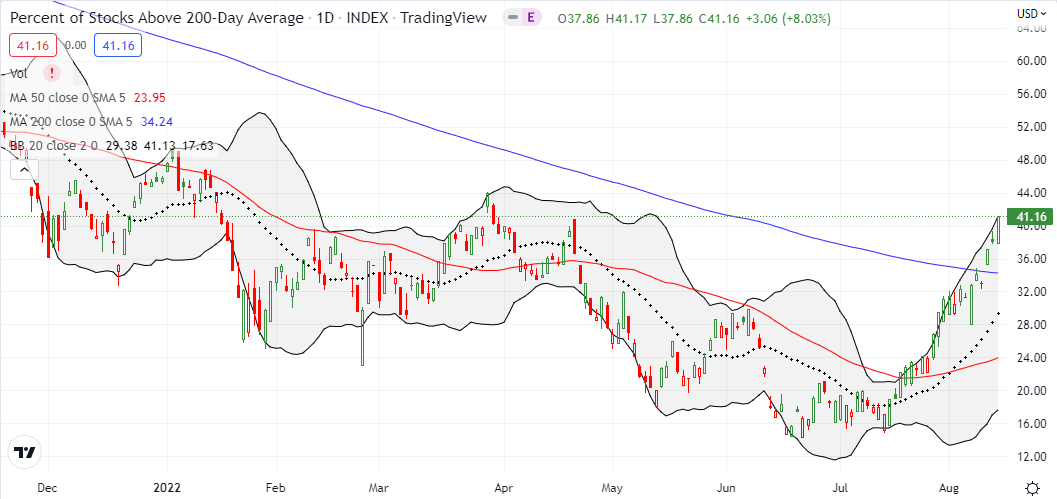
- AT200 (MMTH) = 41.2% of stocks are trading above their respective 200-day moving averages
- Short-term Trading Call: neutral
AT50 (MMFI), the percentage of stocks trading above their respective 50DMAs, managed to close above 80%. My favorite technical indicator moved into rarefied space. With 4 of the last 5 trading days closing AT50 in overbought territory and the last two days keeping AT50 above 80%, an extended overbought rally is underway. Thus, IWM’s 200DMA breakout is in good company. This feat augurs well for the prospects of follow-through buying for IWM and an imminent 200DMA breakout for the S&P 500.
The bear market ended with refueling bullish signs and increasing command of the buyers and bulls over the stock market. Yet, I still left the short-term trading call at neutral. I am looking for and cautiously holding choice short-term bullish trades (I am increasingly focused on the ARK funds). Moreover, I am not actively looking to argue with the market with new short positions. My few remaining bearish positions act as partial hedges. My strategy for regular purchases of weekly QQQ put options only keeps something ready and in place for the time the overbought period finally comes to an end. The stock market could easily start a new bear market with fresh negative catalysts. However, I do not expect a new bear market to happen on the same, well-known negative catalysts of inflation, recession fears, or monetary tightening.
Be careful out there!
Footnotes
“Above the 50” (AT50) uses the percentage of stocks trading above their respective 50-day moving averages (DMAs) to measure breadth in the stock market. Breadth defines the distribution of participation in a rally or sell-off. As a result, AT50 identifies extremes in market sentiment that are likely to reverse. Above the 50 is my alternative name for “MMFI” which is a symbol TradingView.com and other chart vendors use for this breadth indicator. Learn more about AT50 on my Market Breadth Resource Page. AT200, or MMTH, measures the percentage of stocks trading above their respective 200DMAs.
Active AT50 (MMFI) periods: Day #29 over 20%, Day #23 over 30%, Day #16 over 40%, Day #16 over 50%, Day #10 over 60%, Day #2 over 70%, Day #1 over 80% (overbought day #3)
Source for charts unless otherwise noted: TradingView.com
Full disclosure: long QQQ put
FOLLOW Dr. Duru’s commentary on financial markets via StockTwits, Twitter, and even Instagram!
*Charting notes: Stock prices are not adjusted for dividends. Candlestick charts use hollow bodies: open candles indicate a close higher than the open, filled candles indicate an open higher than the close.


