Stock Market Commentary
Over two years ago, a lethal virus forced the economy to shut down. The Federal Reserve was one of many to rush to the rescue with historic sums of liquidity. Today, the economy stubbornly runs hot, and the Fed is rushing to “shut down” financial markets to cool down economic activity “just enough”. The Fed has raised rates just twice in this effort. However, market expectations have been enough to bring the stock market to its knees. The latest fear-filled expectation comes in the form of a leaked source and/or a gossiping, speculating Wall Street Journal about a 75 basis points rate hike in the upcoming Fed meeting. The subsequent rush for the exits launched a new oversold period that dragged the S&P 500 into a bear market.
The Stock Market Indices
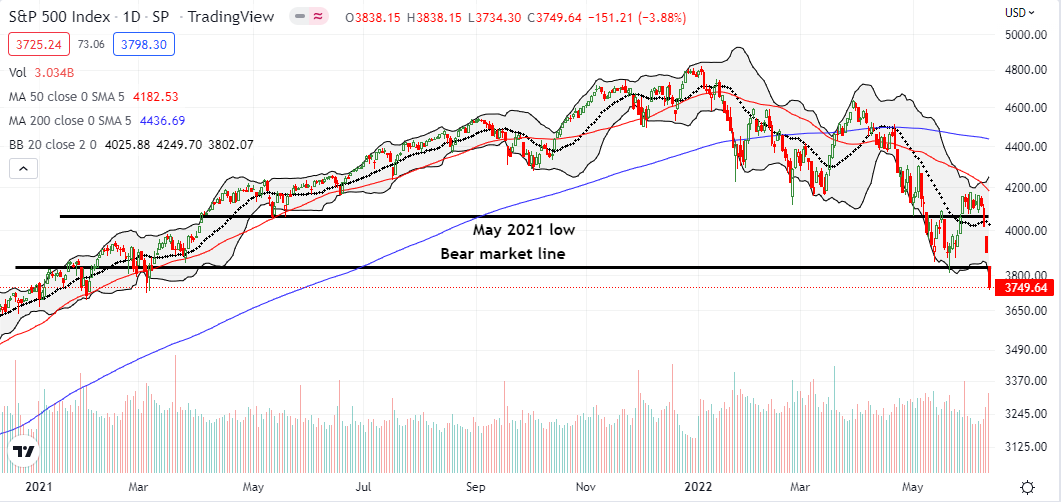
The S&P 500 (SPY) left no doubt about its new status in bear market territory. I frequently feared a third test of the bear market line would not succeed. On its way to a 3.9% loss for the day, the index gapped down just below the bear market line and never looked back. The S&P 500 stretched well below its lower Bollinger Band (BB) and closed at a fresh 16-month low. Per my last update of the 200DMA Model, this close sits right around an important test of the S&P 500’s ability to bottom:
“As long as the S&P 500 trades above its May 2021 high, I am willing to bet that the index has hit a bottom ahead of the next all-time high (whenever that happens). However, on a fresh breakdown, I will brace for the warning ratio going as low as 60. A warning ratio of 60 represents a 21.7% loss from the all-time high or a close of 3755.71. A bottom at that point would confirm approximate support at the March 2021 lows.”
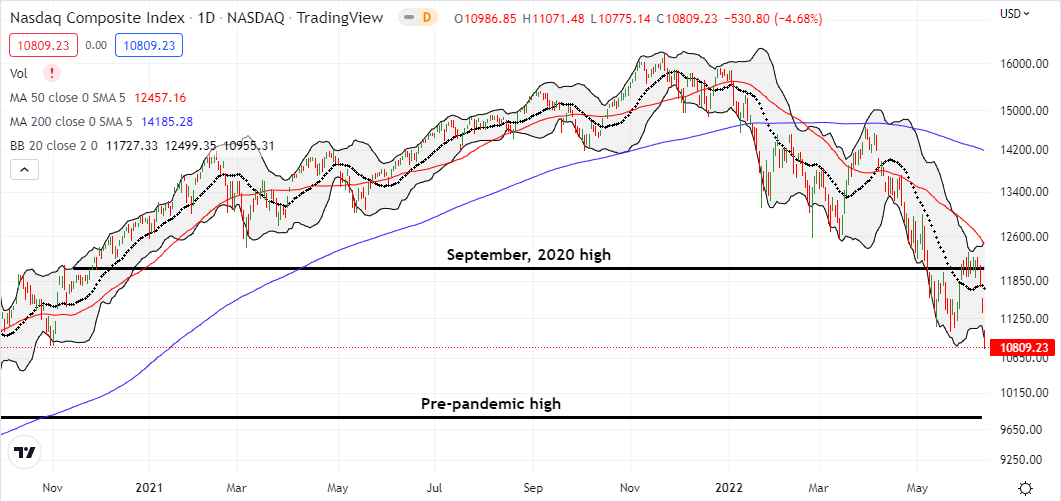
The NASDAQ (COMPQX) lost a whopping 4.7% and slipped right by the October, 2020 low. The 21-month closing low incredibly puts the pre-pandemic high into play. That extremely critical level of support conveniently rests just under the psychologically notable 10,000 level. Needless to say, my speculative weekly QQQ calls completely blew up.
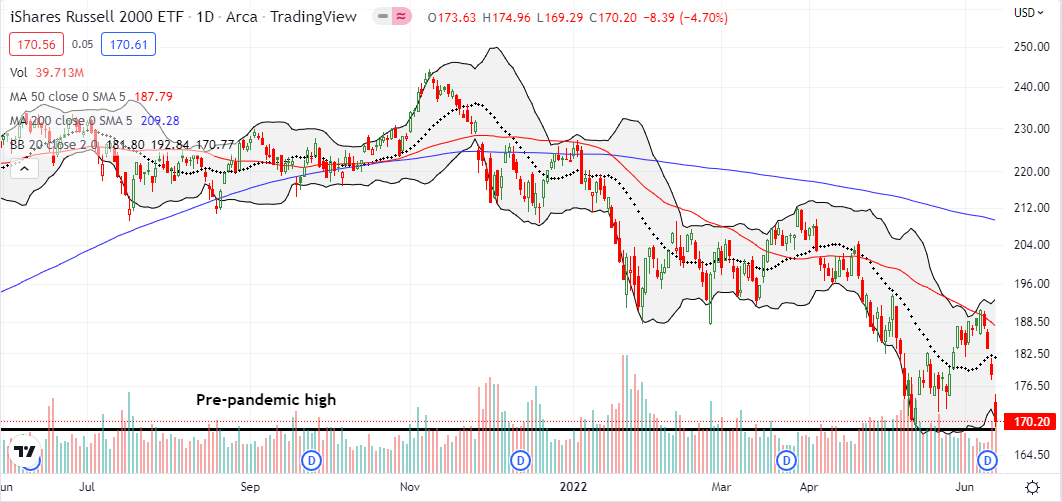
The iShares Russell 2000 ETF (IWM) lost 4.7% and closed just a hair below its 2022 low. More importantly, the ETF of small caps lightly tapped critical support at the pre-pandemic high again. This fresh reversal of pandemic era gains is a reminder of the potential eventual fate of the larger indices. I wrote that speculation with a LARGE gulp.
Stock Market Volatility
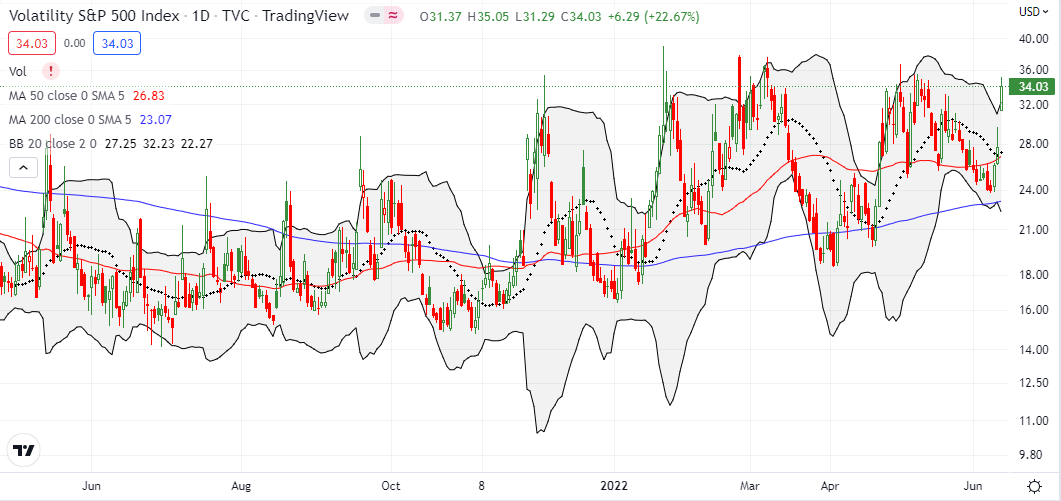
A fresh bear market milestone deserves a special move from the volatility index (VIX) to mark the occasion. While the VIX soared 22.7%, it still fell short of its closing high for the year. While volatility faders tend to dominate trading in the VIX, I am expecting a breakout above the treetops of 2022 intraday highs before this latest cycle of fear implodes on itself. The potential relief rally after the Fed spills the beans on monetary policy is the most likely catalyst for a wicked relief rally. Beware if emboldened faders get an early jump and take the VIX down ahead of the Fed’s announcement. Such a move would be like an early withdrawal on sentiment that could get paid back with a swift plunge back into oversold conditions.
The Short-Term Trading Call With A Bear Market
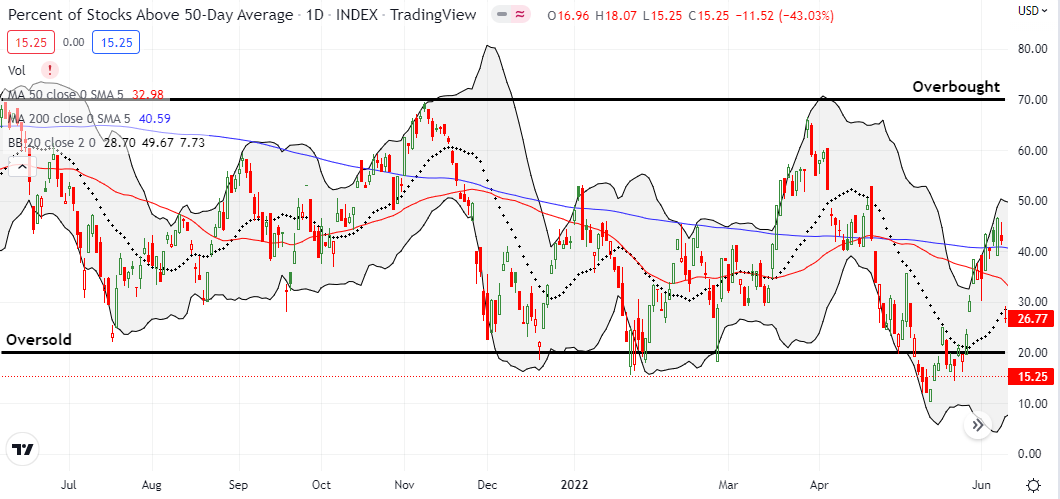
- AT50 (MMFI) = 15.3% of stocks are trading above their respective 50-day moving averages
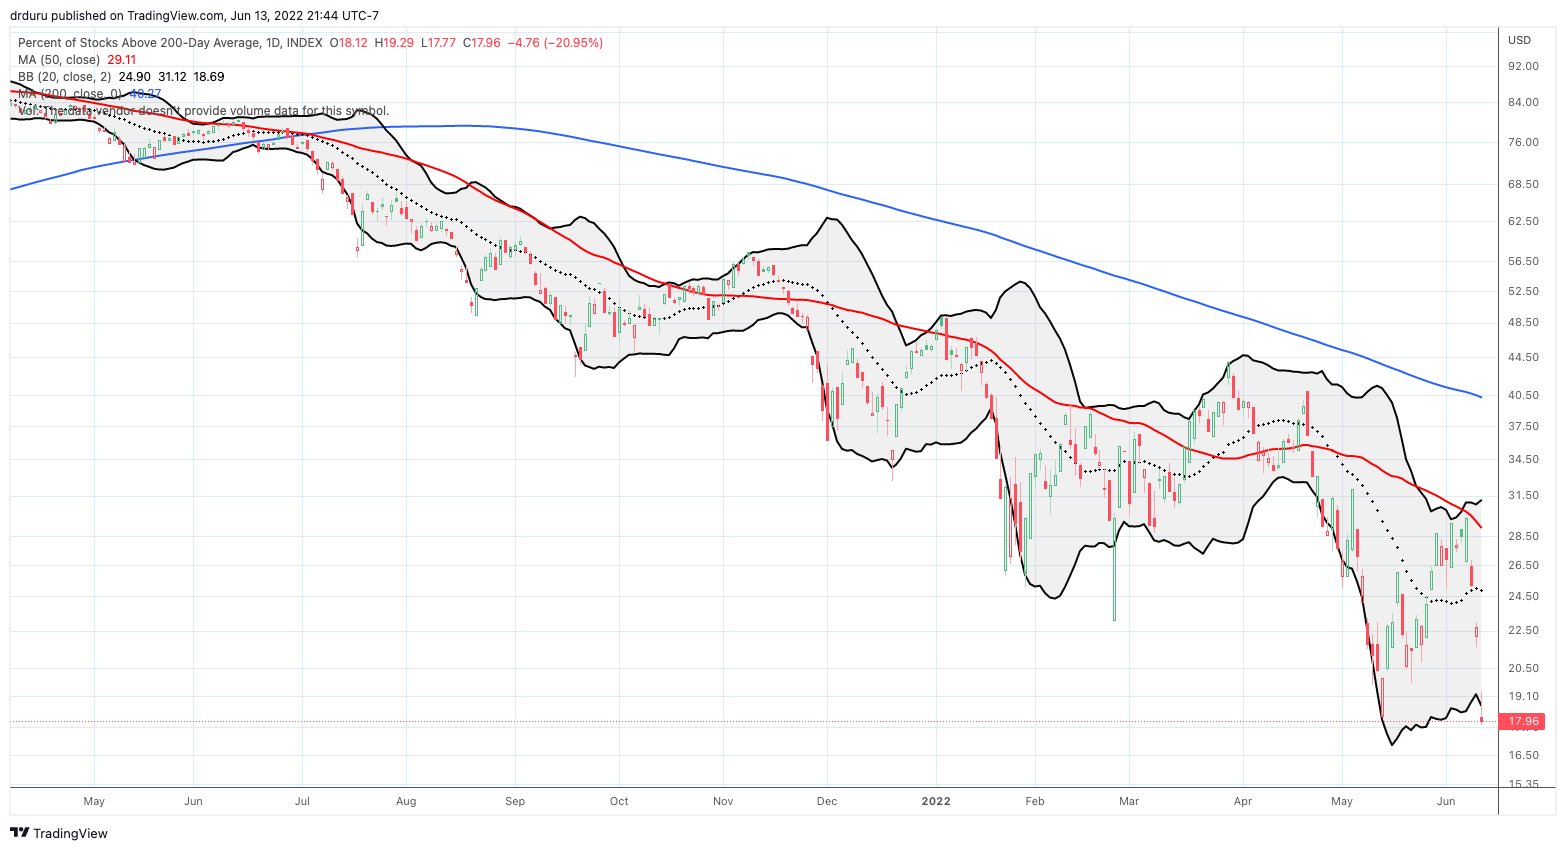
- AT200 (MMTH) = 18.0% of stocks are trading above their respective 200-day moving averages
- Short-term Trading Call: cautiously bullish
AT50 (MMFI), the percentage of stocks trading above their respective 50DMAs, completed its destiny with another oversold period. My favorite technical indicator escorted the S&P 500’s bear market with a close at 15.3%. While this level remains above the lows for the year, the significance is great given the context.
Negativity is about as sharp as it can get and expectations are near panic levels. The Fed has successfully talked the market down and increased its chances to squash whatever component of inflation is under its control. The leaked news of a 75 bps rate hike could be a stroke of genius for grinding sentiment down as much as possible going into the meeting (see “The Easy Way to See Why the Stock Market Fears Rate Hikes” for more context on this fear). However, these extremes of oversold conditions mean that the Fed just needs to sound slightly less threatening in order to ignite the next bounce from oversold conditions.
Accordingly, and per rule, I switched the trading call into bullish territory. Like the year’s first oversold period in 519 trading days, I started with “cautiously” bullish. I was in no rush to load up on fresh positions ahead of what could be a gap down start to Tuesday’s trading. I will definitely buy into a gap down (and close out almost all remaining hedges). Otherwise, I will sit on my hands and wait upon the Fed’s judgement.
Be careful out there!
Footnotes
“Above the 50” (AT50) uses the percentage of stocks trading above their respective 50-day moving averages (DMAs) to measure breadth in the stock market. Breadth defines the distribution of participation in a rally or sell-off. As a result, AT50 identifies extremes in market sentiment that are likely to reverse. Above the 50 is my alternative name for “MMFI” which is a symbol TradingView.com and other chart vendors use for this breadth indicator. Learn more about AT50 on my Market Breadth Resource Page. AT200, or MMTH, measures the percentage of stocks trading above their respective 200DMAs.
Active AT50 (MMFI) periods: Day #1 under 20% (oversold period ended 13 days over 20%), Day #2 under 30%, Day #4 under 40%, Day #48 under 50%, Day #53 under 60%, Day #324 under 70%
Source for charts unless otherwise noted: TradingView.com
Full disclosure: long QQQ put spread and calls; long SPY call spread, long IWM call spread
FOLLOW Dr. Duru’s commentary on financial markets via StockTwits, Twitter, and even Instagram!
*Charting notes: Stock prices are not adjusted for dividends. Candlestick charts use hollow bodies: open candles indicate a close higher than the open, filled candles indicate an open higher than the close.

