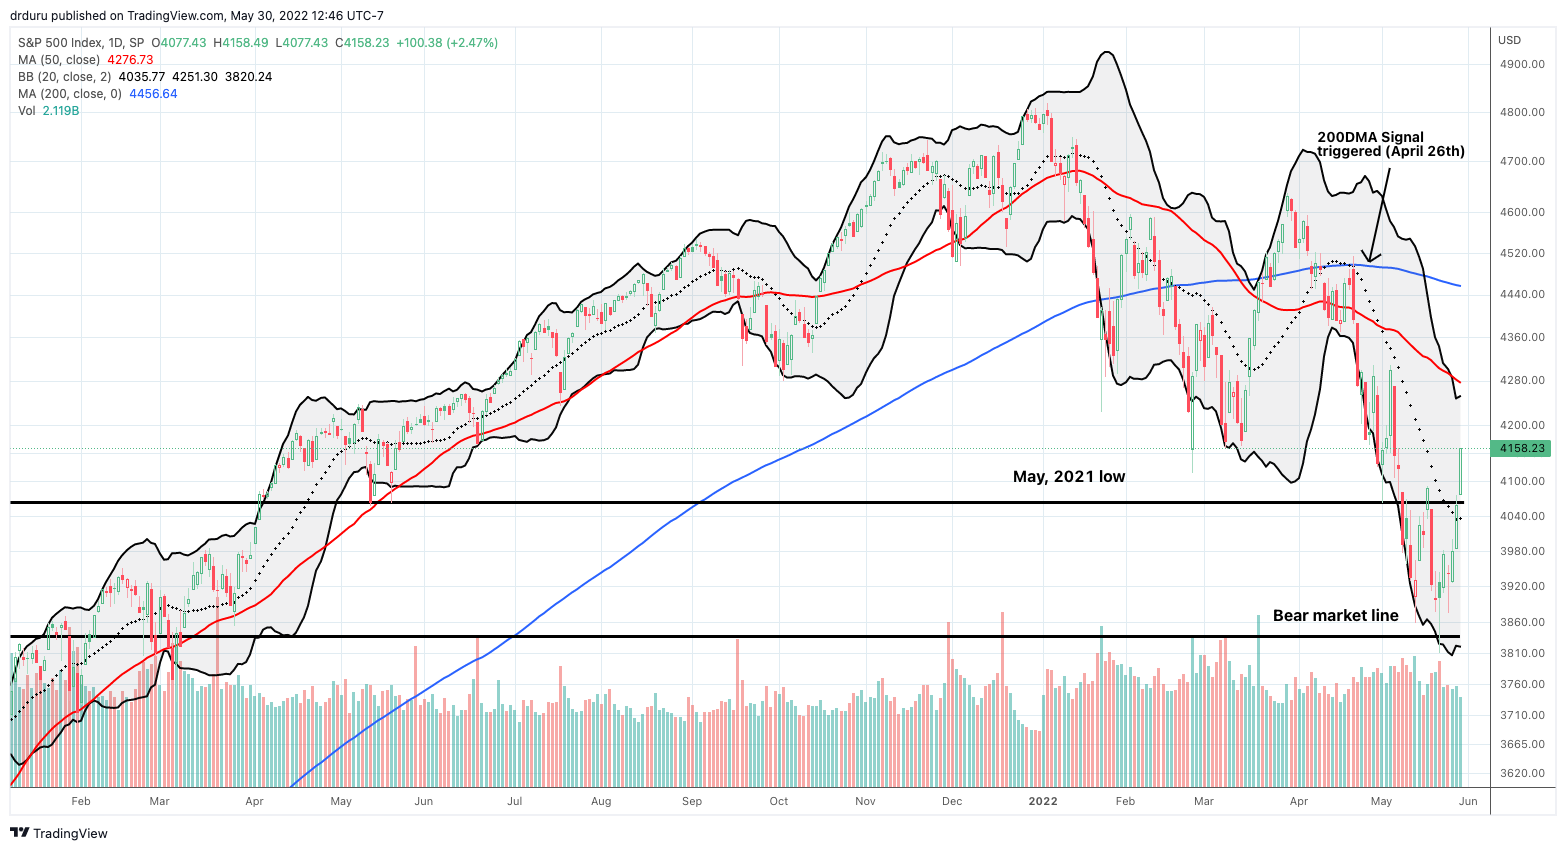
Almost seven years ago, I developed the “200DMA Signal” to provide a relative measure of major bottoms for the S&P 500 (SPY). The 200-day moving average (DMA) is a long-term measure of a price trend, so it provides a robust assessment of prevailing trends. The 200DMA Signal triggers when the S&P 500’s 200DMA suffers its first 5-day negative change after an all-time high. Such a move indicates the start of a downtrend for the 200DMA. Selling must become particularly strong and extended in time to push the 200DMA into a downtrend given the long-term positive bias to the stock market. Indeed, the 200DMA Signal has only been triggered 23 times since 1956. The 23rd time happened on April 26, 2022.

The 200DMA Signal was particularly significant for this cycle because it was triggered shortly after the S&P 500 failed at 200DMA resistance. That failure preceded the wave of selling that eventually took the index down to bear market territory (defined as a 20% loss from the all-time high). Note that while the NASDAQ closed in bear market territory, the S&P 500 never did so. Its lowest close was -18.7% off the all-time high.
Using the 200DMA Signal
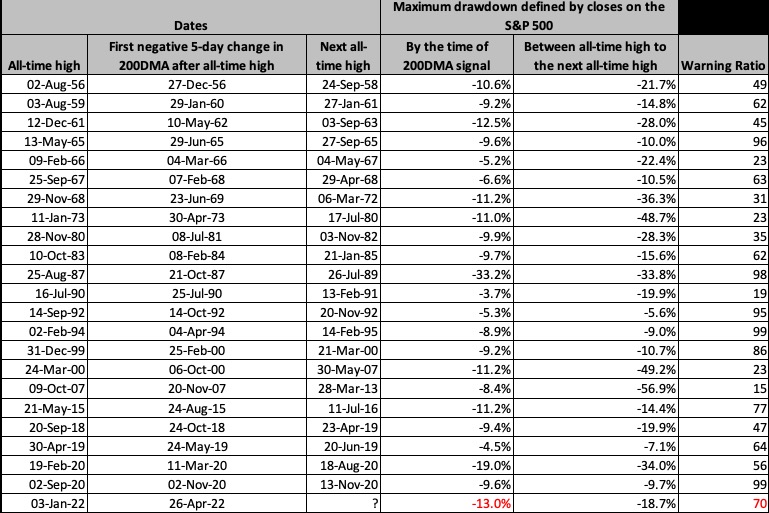
The table below shows all the 200DMA Signal triggers since 1956. The first column provides the all-time high that proceeded the signal dated by the second column. The next all-time high is in the third column. The next two columns measure the losses associated with the 200DMA Signal. The fourth column shows the S&P 500’s closing loss on the day of the signal (again, dated by the second column). The fifth column shows the maximum closing loss between all-time highs. The “warning ratio” in the last column is 100 times the fourth column divided by the fifth column.

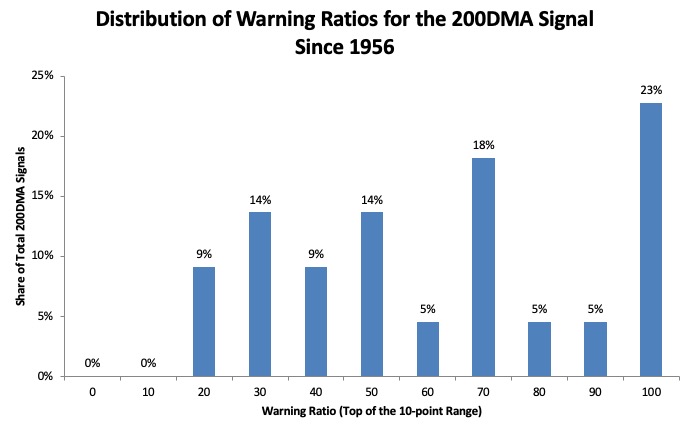
The warning ratio measures the share of the maximum loss between all-time highs achieved by the time of the DMA Signal. The closer to 100, the closer the maximum loss occurred at the time the DMA Signal triggered. The majority (51%) of DMA Signal triggers produced warning ratios higher than 60. The histogram below shows this distribution where the x-axis represents the top of a 10-point range. For example, 70 on the axis represents the range 60-70, exclusive of 60.
When the S&P 500 hit its maximum closing loss on May 19th, the warning ratio hit 70. If that marked the bottom of this selling cycle before the next all-time high, then this cycle sits right on the edge of 33% of DMA Signals. Those are “decent” odds to bet on a bottom, but there remains a decent chance that the S&P 500 will suffer one more sell-off to lower lows before the next all-time high.
Using Market Breadth for A Market Bottom
As long as the S&P 500 trades above its May 2021 high, I am willing to bet that the index has hit a bottom ahead of the next all-time high (whenever that happens). However, on a fresh breakdown, I will brace for the warning ratio going as low as 60. A warning ratio of 60 represents a 21.7% loss from the all-time high or a close of 3755.71. A bottom at that point would confirm approximate support at the March 2021 lows.
On the way down, my favorite technical indicator for measuring market breadth will come in handy as the final arbiter of bottoming potential. A breakdown below the May, 2021 would shift my latest trading call from cautiously bullish to neutral. I would flip bullish again – anticipating a fresh bottom – once market breadth shifted down to oversold trading conditions. I cover these technicals in The Market Breath series.
Be careful out there!
Full disclosure: no positions

