
Stock Market Commentary:
The last “official” oversold period was 519 trading days ago. After 8 different intraday dips into and out of oversold territory, the stock market finally closed in oversold conditions. The signs of a bear market include the inability to stay out of oversold conditions. Today’s series of breakdowns combined with further deterioration in market breadth delivered the bearish confirmation few traders actually needed. Now, the difficult trading decisions begin for the oversold trading strategy.
The Stock Market Indices
The successful tests of support were too perfect and too mechanical to believe. Last week, the S&P 500 (SPY) bounced TWICE in picture-perfect style off support from its May, 2021 low. The index started the week leaving support behind with a 3.2% drop to a 13-month low. I expect sellers to fade rallies back to (or through) what is now resistance for the next oversold bounce.
The NASDAQ (COMPQX) made its weakness plain at the end of last week. The tech-laden index started this week with a 4.3% loss. The critical September, 2020 high is now in the rearview mirror. Sellers will likely fade rallies back to the former line of support. An oversold bounce should face some kind of resistance around the September, 2020 high.
Like the NASDAQ, the iShares Russell 2000 ETF (IWM) made its weakness plain. The ETF of small caps opened this week with a 4.2% loss. The entirety of the November, 2020 breakout is now in danger.
Stock Market Volatility
The volatility index (VIX) still “refuses” to break out. While the VIX printed its second highest close of the year, the series of intraday highs from this year still look like stiff resistance. To bears, this persistent lag in fear portends an even worse bout of selling ahead to achieve a full flush and exhaustion of sellers. To bulls, the VIX’s relative sluggishness looks like a bullish divergence. Given the stock market is in oversold conditions, the odds favor the bulls. Still, I remain wary.
The Short-Term Trading Call When the Market Cannot Avoid Extended Oversold Conditions
- AT50 (MMFI) = 16.2% of stocks are trading above their respective 50-day moving averages
- AT200 (MMTH) = 25.8% of stocks are trading above their respective 200-day moving averages
- Short-term Trading Call: cautiously bullish
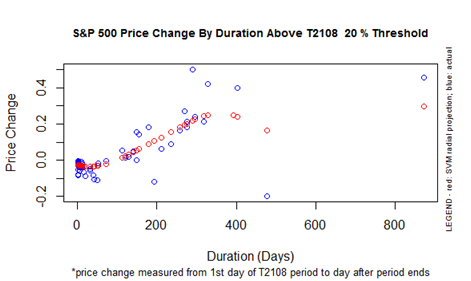
AT50 (MMFI), the percentage of stocks trading above their respective 50DMAs, closed at 16.2%. My favorite technical indicator closed under the 20% oversold threshold for the first time in 519 trading days (see April 13, 2020 for reference). The chart below from the T2108 (AT40) archives shows the oddity of such a feat. As of 2015, only ONE other 20% overperiod persisted longer than the last one. Over that period, the S&P 500 gained about 45%. Amazingly, the latest 20% overperiod delivered a similar 43% performance for the S&P 500 (as measured by AT50).
For newer readers, note that T2108 is the percentage of stocks trading above their respective 40DMAs (AT40). I created a conversion from T2108 (AT40) to AT50 that demonstrated the validity of leaving oversold and overbought at their 20% and 70% thresholds respectively.
In my previous Market Breadth post, I noted my wariness about trading oversold conditions in a bear market. I even expect an extended stay in oversold conditions. Accordingly, I did not rush to load up on bullish positions in response to AT50 falling into oversold conditions. In fact, I am content to wait on either 1) an S&P 500 confirmed breakout above its resistance at the May, 2021 high, and/or 2) a plunge deeper into oversold territory with new (intraday) highs on the VIX. Both strategies are more conservative triggers for my AT50 trading rules than my typical aggressive approach.
Instead of buying, I closed out most of my remaining bearish positions, including my shares short the ARK Autonomous Technology & Robotics ETF (ARKQ) and my May calendar put spread on SPY. Since I am not looking to open new bearish positions, I switched the short-term trading call to cautiously bullish.
While I wait, I am keeping a close eye on the currency market. The U.S. dollar continues to surge. Even more importantly, at the time of writing, the Australian dollar versus the Japanese yen (AUD/JPY) rebounded from a 50DMA breakdown – one small positive going into the next day’s trading. (See Why the Australian Dollar and Japanese Yen Matter for Stock Traders to understand why I care about the technicals on AUD/JPY).
Be careful out there!
Footnotes
“Above the 50” (AT50) uses the percentage of stocks trading above their respective 50-day moving averages (DMAs) to measure breadth in the stock market. Breadth defines the distribution of participation in a rally or sell-off. As a result, AT50 identifies extremes in market sentiment that are likely to reverse. Above the 50 is my alternative name for “MMFI” which is a symbol TradingView.com and other chart vendors use for this breadth indicator. Learn more about AT50 on my Market Breadth Resource Page. AT200, or MMTH, measures the percentage of stocks trading above their respective 200DMAs.
Active AT50 (MMFI) periods: Day #1 under 20% (day #1 oversold, ending 518 days over 20%), Day #3 under 30%, Day #12 under 40%, Day #23 under 50%, Day #28 under 60%, Day #299 under 70%
Source for charts unless otherwise noted: TradingView.com
Full disclosure: short AUD/JPY
FOLLOW Dr. Duru’s commentary on financial markets via StockTwits, Twitter, and even Instagram!
*Charting notes: Stock prices are not adjusted for dividends. Candlestick charts use hollow bodies: open candles indicate a close higher than the open, filled candles indicate an open higher than the close.