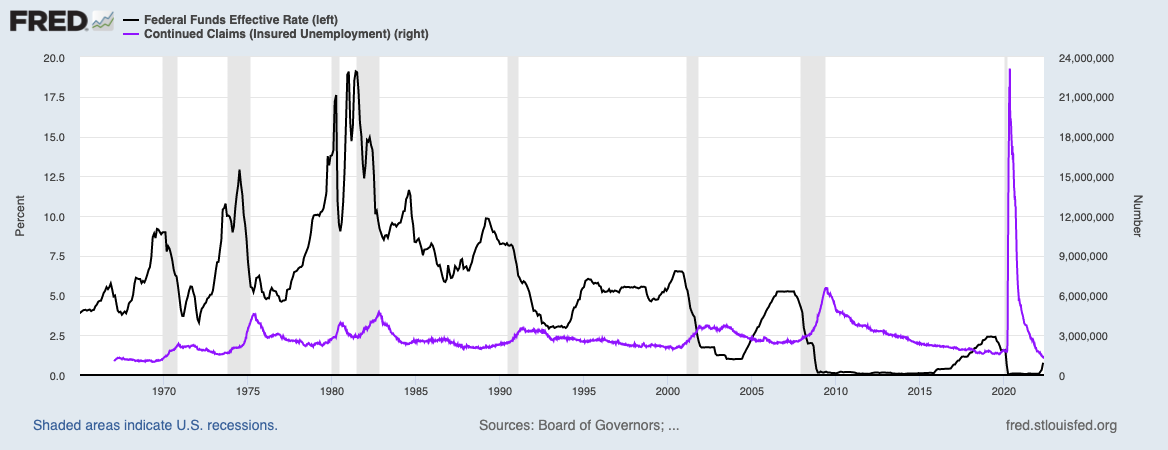
It is easy to forget that the months going into the COVID-19 pandemic were filled with fears of a recession. In response to mounting economic and political pressures, the Federal Reserve, led by Jerome Powell, reversed course on the Fed’s 3-year effort to slowly normalize monetary policy with what he called a “mid-cycle” rate adjustment. This about face stood in stark contrast to a massive Federal tax cut in 2018 designed to turbo charge an already strengthening economy. The pandemic sent the economy into a quick recession and left a fuzzy spot in the economic record. Until then, the easy way to predict a recession was to start the clock ticking after the Fed launched a rate-hiking cycle. Within one or two years, the economy would swerve into a recession. This relationship is also the easy way to see why the stock market fears rate hikes.

Source: Board of Governors of the Federal Reserve System (US), Federal Funds Effective Rate [FEDFUNDS], retrieved from FRED, Federal Reserve Bank of St. Louis; U.S. Employment and Training Administration, Continued Claims (Insured Unemployment) [CCSA], retrieved from FRED, Federal Reserve Bank of St. Louis, June 9, 2022.
The above chart marks recessions by the vertical grey bar. The black line shows the fed funds effective rate (values on the left y-axis). The purple line provides the continued claims for unemployment (values on the right y-axis). I included continued claims to show how rate hike cycles start with an improving employment picture. The Fed started hiking in 2015 with claims back to pre financial crisis levels. Claims trended down to a 45-year low ahead of the pandemic.
This time around the Fed did not start hiking rates until claims reached 52-year lows. The rate-hike cycle is just a blip on the above chart, yet a stock market already in a bear market mood is racing ahead along the contours of the economic history. Of course, the link between rate hike cycles and recessions includes exceptions (in 1984 and 1994). However, the presence of rate hikes going into every recession since at least 1970 provides an easy way to understand the fear in the stock market.
Looking Ahead
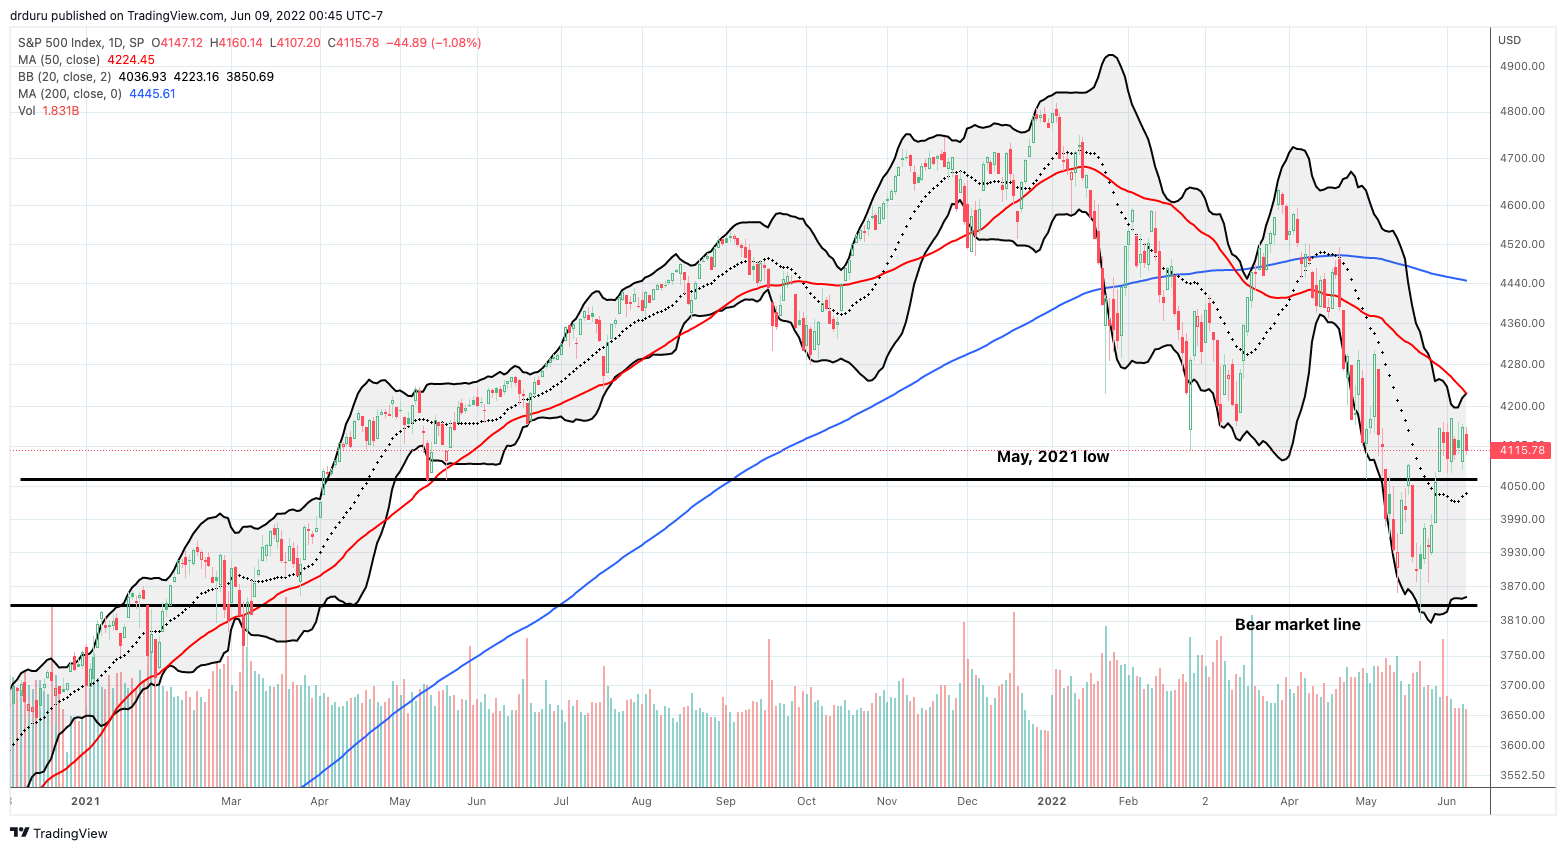
The data provide little evidence of the stock market’s ability to predict a recession. The pattern of rate changes provides a stronger signal. When the rate hike cycle comes to an end, the economy is in or just about to enter a recession. In parallel, continued claims are on the rise or about to ascend. It is hard to imagine that the transition is imminent because the current rate hike cycle is barely visible in the historic record. Yet, these are unprecedented times, so rules are meant to be broken. Continued claims are so low right now that technically the Fed has plenty of room to keep hiking rates. The S&P 500 (SPY) is also giving the Fed some breathing room by escaping last month’s test of the bear market line.

However, the economic pressures from high inflation might ironically force the Fed to back down early….and leave us wondering how long stagflation will last. There is no easy way for the Fed to navigate monetary policy here.
Be careful out there!
Full disclosure: long SPY call spread
