Two recent studies from the Federal Reserve say a lot about its core concerns for inflation. These studies were released back-to-back just one week following Fed Chair Jerome Powell confirming the new religion at the Fed for (aggressively) fighting inflation.
Researchers at the St. Louis Federal Reserve identified housing services (aka rents) as a core component of today’s inflation problem in a piece called “Breaking Down the Contributors to High Inflation.” The Federal Reserve Bank of Dallas followed the next day with a release from several researchers called “Real-Time Market Monitoring Finds Signs of Brewing U.S. Housing Bubble.”
Those who recall the Greenspan, Bernanke, and Yellen days, can be excused for shock and awe at the spectacle of the Fed publishing an operational definition of a bubble. For example, in 2022, Bernanke famously asked: “Can the Federal Reserve (or any central bank) reliably identify ‘bubbles’ in the prices of some classes of assets, such as equities and real estate? And, if it can, what if anything should it do about them?” Bernanke concluded “First, the Fed cannot reliably identify bubbles in asset prices. Second, even if it could identify bubbles, monetary policy is far too blunt a tool for effective use against them…Although neither I nor anyone else knows for sure, my suspicion is that bubbles can normally be arrested only by an increase in interest rates sharp enough to materially slow the whole economy.”
Today’s Fed may have not only proactively identified a housing bubble, but also may have chosen to act aggressively against it. This rapid switch in inflation posturing is impacting the housing market well ahead of the presumed coming normalization of monetary policy. As a result, the stocks of home builders are descending into recession-pricing. The declining valuations make these stocks particularly attractive whenever recession fears hit a feverish pitch.
The Core Source of Inflation: Housing Services
The St. Louis Fed researchers measured inflation using the Fed’s standard PCE (Personal Consumption Expenditures) inflation. They broke down contributions to the PCE across durable goods, non-durable goods, and services. For comparative purposes, they measured contributions in the current economic expansion versus the previous one (July 2010 to January 2020). By this relative measure they found that services inflation is relatively modest compared to the surges in durable and non-durable goods.
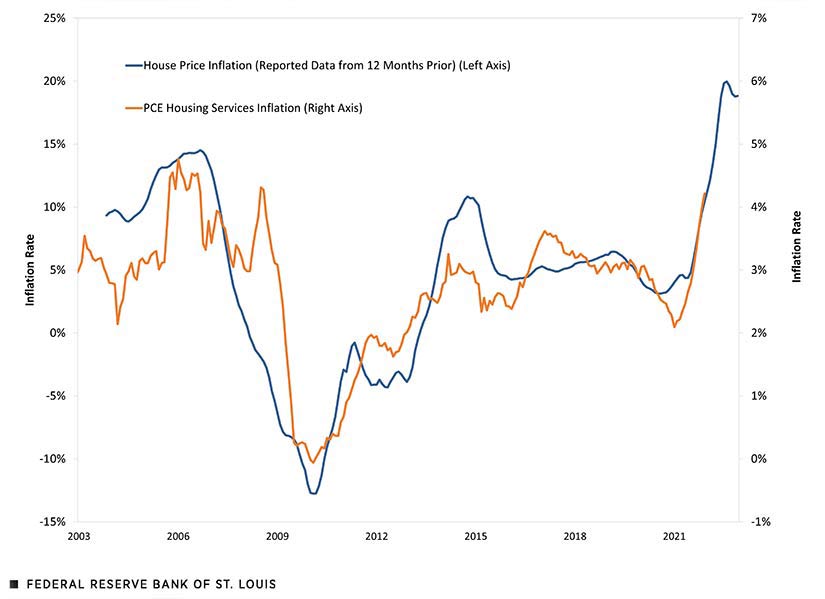
However, the future worries the St. Louis Fed researchers. Changes in housing prices take about 12 months to feed into changes in rents. Rents are a key component of services. If the chart below plays out according to history, then today’s 4% rent inflation could continue higher for the rest of the year. This inflation could significantly contribute to higher inflation expectations as well.
In other words, housing costs will continue to add to already exacerbated inflationary pressures. Even if durable and non-durable goods inflation flattens out later this year, rents will deliver additional heft to the inflation rate. Per the researchers: “Given that housing services constitutes the largest subcomponent of PCE, accounting for roughly 18% of total consumption expenditures, the impact of housing services inflation on overall PCE inflation is always significant. Hence, a continued increase in housing services inflation could keep the overall PCE inflation rate at an elevated level.”
In other words, a passive Fed risks a persistent inflation spiraling further out of their reach. Such a move would compel even more aggressive remedies. In case the St. Louis Fed researchers left anyone unconvinced of the risks, researchers at the Dallas Fed brought down the hammer by using the “B” word.
A Bubble in Housing?
The Fed’s emergency monetary measures provided rocket fuel to a pandemic-driven rush to buy homes. The housing market did not stop at a mere recovery. Indeed, the market went into a near frenzy that did not peak in terms of sales until January, 2021. Subsequent normalization brought sales back to trend. However, prices continued to soar against limited inventory and supported by ultra-low mortgage rates.
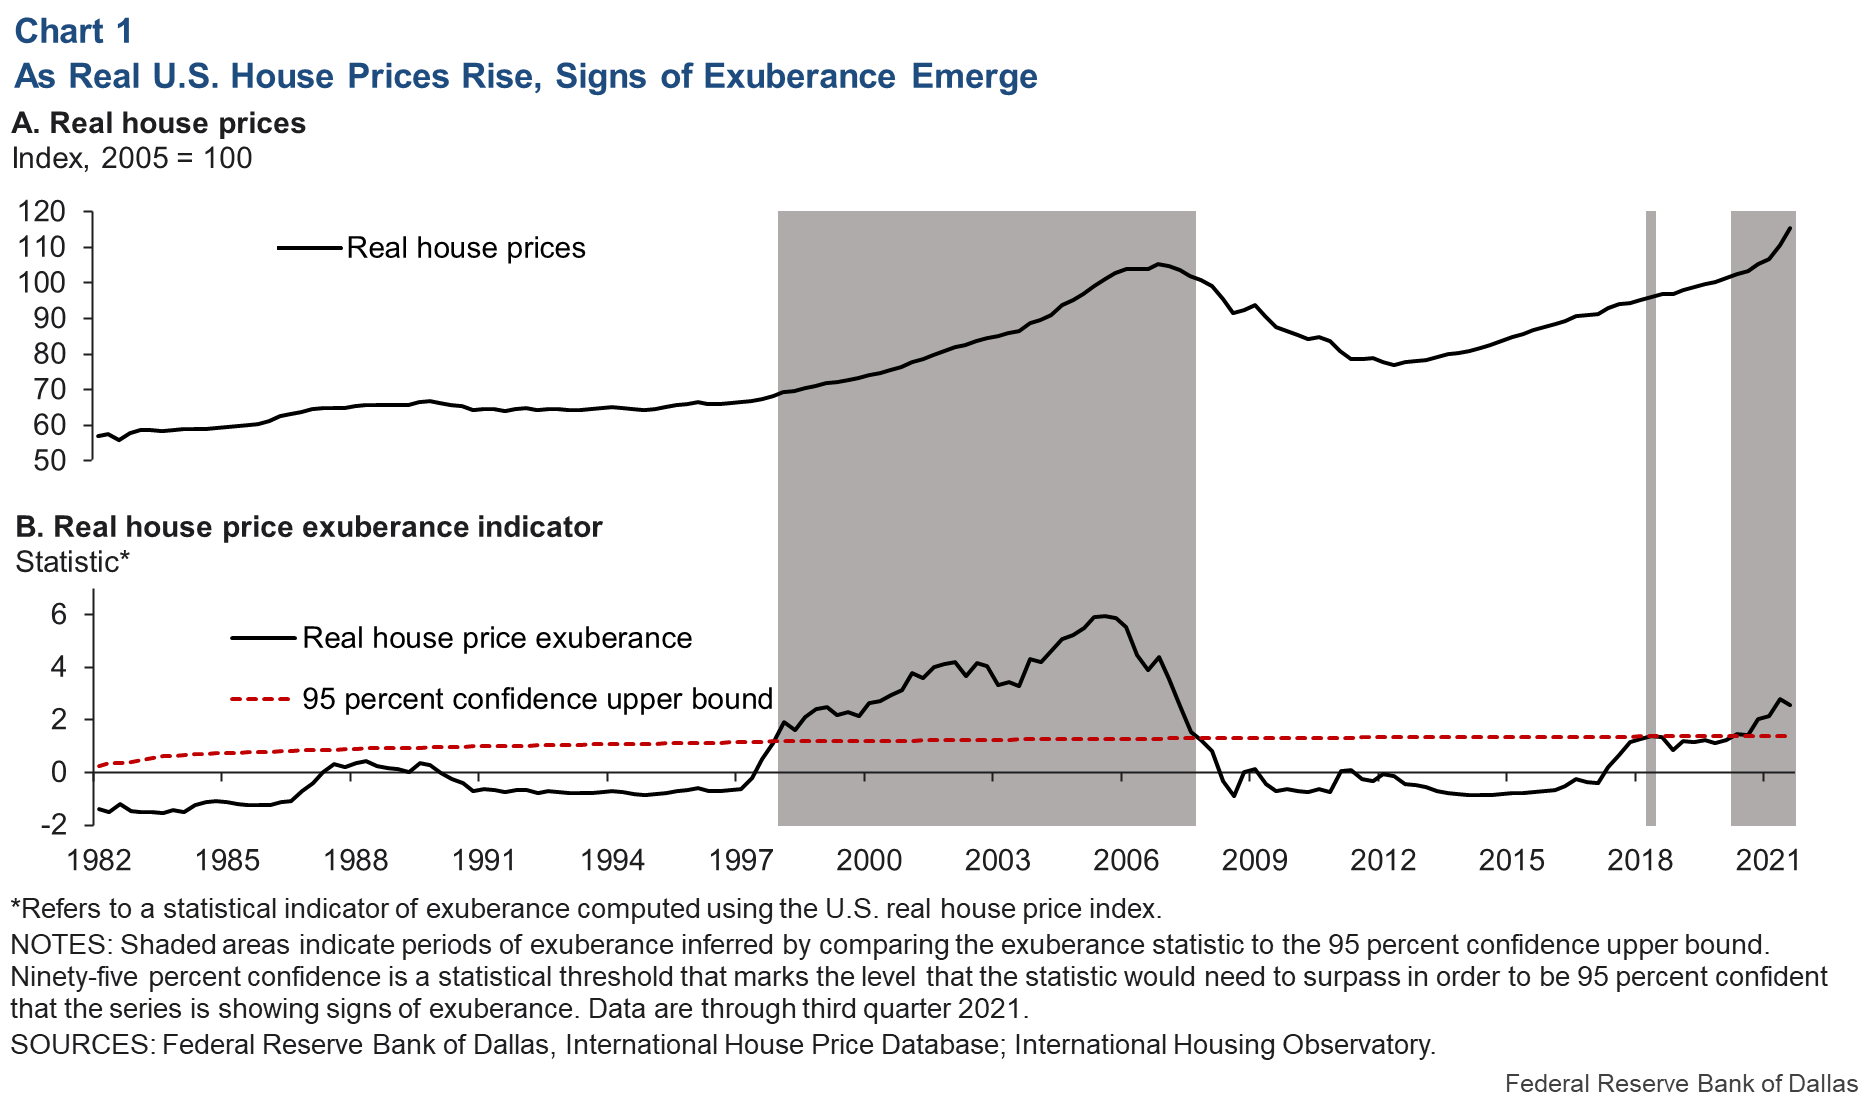
Against this backdrop, the Dallas researchers first defined a bubble: “An asset—in this case, housing—is in the primary expansionary phase of a bubble when price rises are out of step with market fundamentals.” They called the “fear of missing out” (FOMO) in the housing market a manifestation of “expectations-driven explosive appreciation (often called exuberance).” The bubble in housing shows up in a “real house price exuberance indicator.” This indicator has exceeded a 95% confidence upper bound for the range of prices supported by economic fundamentals such as “shifts in disposable income, the cost of credit and access to it, supply disruptions, and rising labor and raw construction materials costs.”
According to these data, the housing market reached bubble levels starting way back in the second quarter of 2020. Given the Fed did little about the previous statistical bubble until the wheels blew off, one might wonder why the Fed should show concern so early in the current bubble. Presumably, this time is different.
The PCE during the last housing bubble was relatively consistent with low levels of inflation. The Fed was much more pre-occupied by fears of deflation even during periods of trickling rates higher. Per the research from the St. Louis Fed, this time around the Fed cannot afford to watch rents continue rising in the fallout of the current bubble. According to the Dallas Fed researchers, an uncontrolled boom in housing prices can deliver economic harm “including the misallocation of economic resources, distorted investment patterns, individual bankruptcies and broad macroeconomic effects on growth and employment.”
The Trade on Recession-Pricing
The Fed’s aggressive posturing is already exacting a toll on the housing market. For example, mortgage rates have experienced a stunning run-up. Mortgage rates accelerated upward in the past few weeks from an already steep uptrend for 2022. Recent gains have outpaced the 30-year bond and are stretching mortgage rates to highs last seen in late 2018. This behavior is what a market looks like that takes seriously the Fed’s aggressiveness.
![Sources include: Board of Governors of the Federal Reserve System (US), Market Yield on U.S. Treasury Securities at 30-Year Constant Maturity [DGS30], retrieved from FRED, Federal Reserve Bank of St. Louis and Freddie Mac, 30-Year Fixed Rate Mortgage Average in the United States [MORTGAGE30US], retrieved from FRED, Federal Reserve Bank of St. Louis, April 12, 2022](https://drduru.com/onetwentytwo/wp-content/uploads/2022/04/220412_Mortgage-Rates-and-Treasury-Yields.png)
Finally reading the writing on the wall in early March, I called an end to the seasonal trade on home builders. The subsequent 14% loss for the iShares U.S. Home Construction ETF (ITB) added to an already steepening slide from the all-time highs set just 4 months ago. The selling has left home builders hurtling toward and beyond recession-like valuations. For example, KB Homes (KBH), with a management driving full steam ahead with unapologetic bullishness, currently trades at a mere 0.9 times book and 0.4 times sales. Market leader Lennar trades just above the 1.0 times book that defines recession-pricing for home builders. These valuations are tempting. However, financial markets appear set up to swing from one euphoric extreme to the depths of a pessimistic extreme. As a result, what is now incredibly cheap could easily get even cheaper.
The unfolding bearishness on housing should not reach the extremes of the financial crisis. Indeed, today’s home financing is much more robust than the questionable practices during the last housing bubble. The fallout at that time included hand-wringing about the end of interest in home ownership. Some predicted the collapse of the suburbs. A renown demographer even warned about a future senior sell-off for housing. Still, I suspect the market could get “close enough” to such despair. I definitely want to be a buyer (and add to positions) around that time.
Be careful out there!
Full disclosure: long ITB and KBH


6 thoughts on “Inflationary or A Bubble – Housing Prices Help Push A Fed Driving Recession-Pricing for Home Builders”