
Housing Market Intro and Summary
The story of housing remained relatively steady for most of the year: low inventory, rising prices, strong demand, low interest rates, and the desire for more space, especially in the suburbs. In my last Housing Market Review, I explored the market as a nexus of economic recovery and inflation. In this Housing Market Review, I see a housing market settling into normalization and readying for a healthy Spring 2022 selling season. This normalization is clearest in sales pace, but the pace of pricing is only normal relative to the prevalent inflationary pressures in the housing market. Perhaps a tightening in monetary policy will catalyze a “soft landing” for prices in the housing market.
Housing Stocks
The iShares Dow Jones US Home Construction Index Fund (ITB) out-performed the S&P 500 (SPY) in 2021 49% versus 27% respectively. The performance gap widened with the seasonally strong period starting in November. ITB finished the year right at its all-time high after printing a picture-perfect test of support at its 50-day moving average (DMA) (red line below).
With the seasonally strong period underway, I am now looking at home builder laggards that offer runway for catch-up in the coming months (while keeping in mind that 2022 offers bigger prospects for stock market sell-offs). LGI Homes (LGIH) is still working on a recovery from a 12.1% post-earnings plunge in November. The stock should lift-off once it closes above the December high. LGIH finally flipped from following its 50DMA downward to following it upward. The uptrending 200DMA is also still a positive trend despite providing upside resistance since October.
KB Home (KBH) keeps breaking out above its 200DMA resistance. KBH looks like it is one catalyst away from making a run back to all-time highs.
PulteGroup, Inc (PHM) is already making its run back to the all-time high. PHM has even cleared the summer’s congested trading.
Housing Data
New Residential Construction (Single-Family Housing Starts) – November, 2021
Single-family home starts increased to 1,173,000 which was 11.3% above October’s starts (revised upward from 1,039,000 to 1,054,000). Starts were 0.8% below last year’s levels. Typical seasonality includes a big jump in starts from October to November as builders rev up for Spring selling season. The -0.8% year-over-year performance is a promising sign that normalization in starts will not take levels significantly lower.
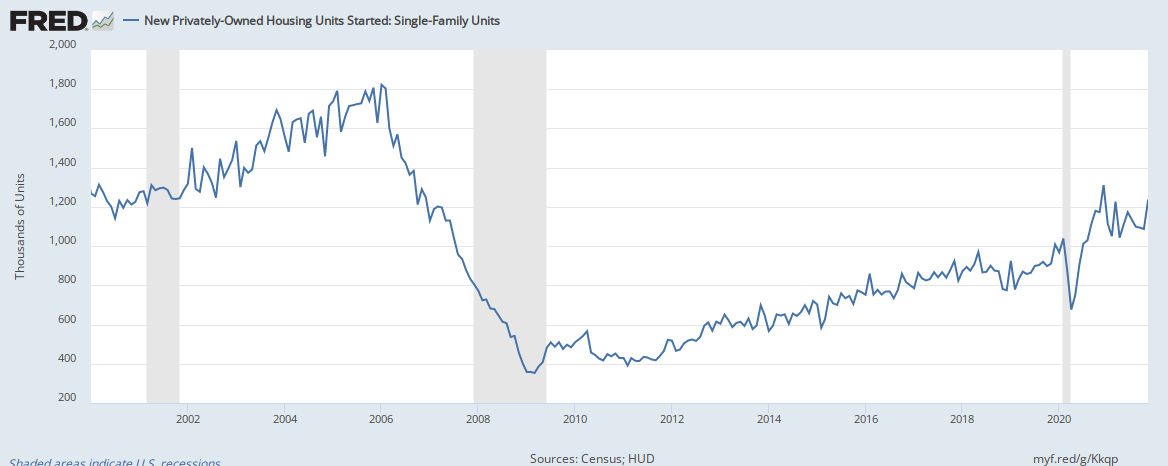
The South was the only region to increase year-over-year. The West suffered a second straight double digit decline. Housing starts in the Northeast, Midwest, South, and West each changed -7.0%, -3.7%, 6.4%, -12.9% respectively year-over-year. All four regions increased sequentially.
Existing Home Sales – November, 2021
Existing home sales enjoyed a big comeback in September. Sales are continuing to creep higher although year-over-year comparisons remain negative. The National Association of Realtors (NAR) claimed that a rush to take advantage of low mortgage rates drove sales in November: “Locking in a constant and firm mortgage payment motivated many consumers who grew weary of escalating rents over the last year.” The seasonally adjusted annualized sales in November of 6.46M increased 1.9% month-over-month from the unrevised 6.34M in existing sales for October. Year-over-year sales decreased 2.0%.
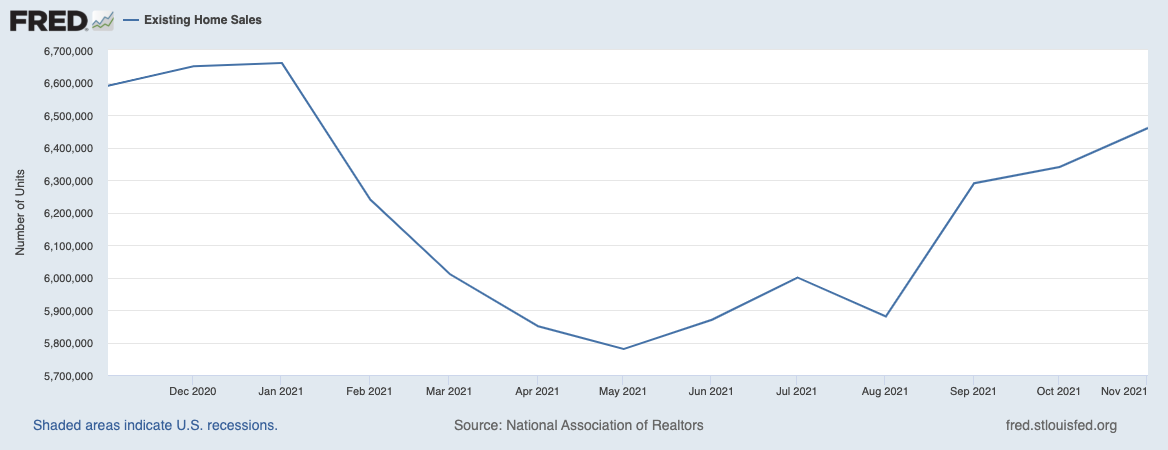
(For historical data from 1999 to 2014, click here. For historical data from 2014 to 2018, click here) Source for chart: National Association of Realtors, Existing Home Sales© [EXHOSLUSM495S], retrieved from FRED, Federal Reserve Bank of St. Louis, December 28, 2021.

November’s absolute inventory level of 1.11M homes plunged 9.8% from October, a fourth consecutive month-over-month decline. Inventory dropped 13.3% year-over-year (compare to October’s 12.0%, September’s 13.0%, August’s 13.4%, July’s 12.0%, June’s 18.8%, May’s 20.6%, April’s 20.5%, March’s 28.2%, February’s 29.5%, and January’s 25.7% year-over-year declines, unrevised). “Unsold inventory sits at a 2.1-month supply at the current sales pace, a decline from both the prior month and from one year ago.” The on-going year-over-year decline in inventory is on a 30-month streak.
The average 18 days it took to sell a home in November was the same as in October. October’s duration was the first change since it dropped to 17 days in April.
The median price of an existing home increased 0.3% from October to hit $353,900. Prices have increased year-over-year for 117 straight months which is an all-time record streak. November’s price hike was a 13.9% year-over-year gain.
First-time home buyers decreased to a 26% share of sales in October, down from 29% in October. The NAR’s 2017 Profile of Home Buyers and Sellers reported an average of 34% for 2017, 33% for 2018, 33% for 2019, and 31% for 2020. Investors also retreated in share. Their share of sales decreased from 17% to 15%. The NAR offered no explanation for these changes. Sustained lower shares could indicate affordability issues in the marketplace.
The Northeast was the only region without a month-over-month sales increase. The South was the only region with a year-over-year sales increase. The regional year-over-year changes were: Northeast -11.6%, Midwest -0.7%, South +1.1%, West -3.6%.
For the second month in a row, the South’s median price soared year-over-year. The regional year-over-year price gains were as follows: Northeast +4.7%, Midwest +9.0%, South +18.4%, West +8.4%. The South has provided stretched homebuyers an oasis of affordability, so I am watching to see whether sustained price gains accompany a sales slowdown in the South.
Single-family home sales increased 1.6% from October and declined on a yearly basis by 2.2%. The median price of $362,600 was up 14.9% year-over-year.
California Existing Home Sales – November, 2021
For October, the California Association of Realtors (C.A.R.) described a market settling into normalization. For November, the C.A.R. characterized the California existing home sales market as “unseasonably resilient” with competitiveness still “elevated.” Apparently, normalization has a long runway! Some “cooling” appeared in the data in the tug of war between buyers and sellers: “While the statewide median sales-price-to-list-price ratio remained above 100 percent, the November’s number was the lowest level since March 2021. Nearly two-thirds of homes (59.2 percent) still sold above asking price in the latest monthly report, but that was the lowest level in nine months.” Recall that in October, the median time to sell a house increased month-over-month for the first time in over two years.
California’s existing homes sales increased 4.7% month-over-month and diluted the recent losing streak to 5 months over the last 7. For November, the C.A.R. reported 454,450 in existing single-family home sales. Sales decreased 10.7% year-over-year (similar to the year-over-year declines in September and October). At $782,480 the median price dropped for the third month in a row coming off August’s all-time high. The median was still up 11.9% year-over-year. The $393 price per square foot rebounded back to September’s pricing and is up 18.4% year-over-year.
Inventory fell along with slowing sales. The Unsold Inventory Index (UII) dropped from 1.8 to 1.6 months of sales. The UII was 1.9 a year ago. Active listings fell 22.4% year-over-year.
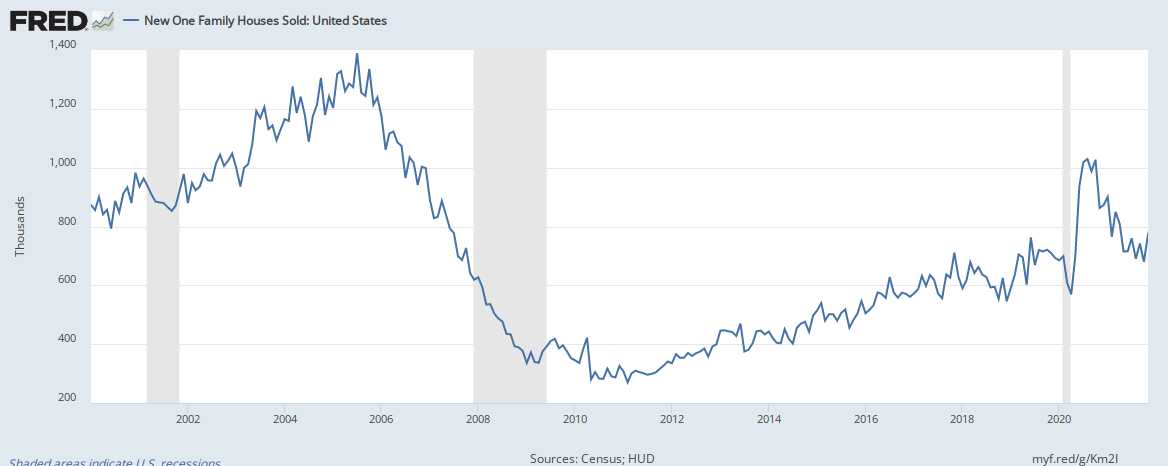
New Residential Sales (Single-Family) – November, 2021
Like existing home sales, new home sales cooled off from the early pandemic craze. New home sales look like they are stabilizing near the uptrend line from the trough following the financial crisis. New home sales of 744,000 were up 12.4% from October’s 662,000 (significantly revised down from 745,000 – the second straight large downward revision). Sales were down 14.0% year-over-year.
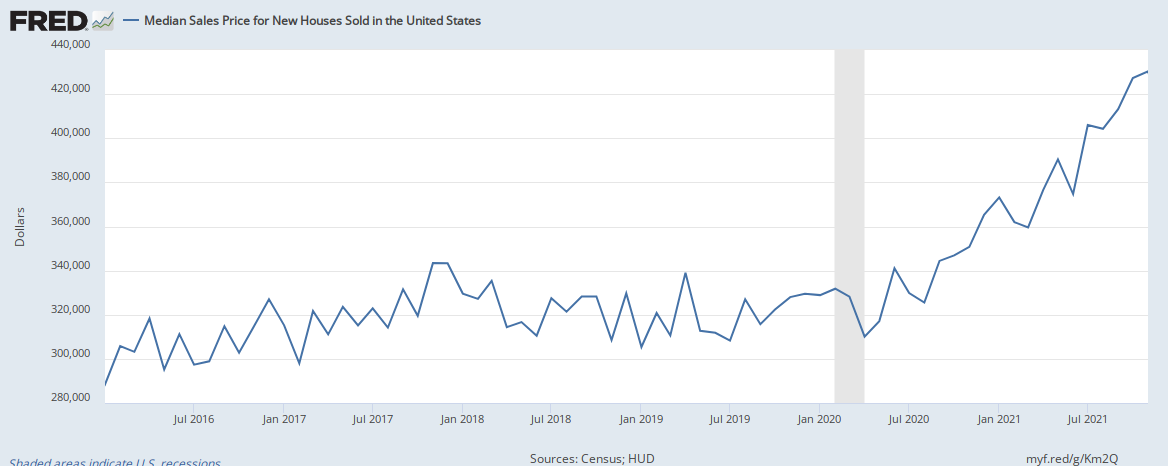
At $416,900 the median home price set a a fresh all-time high, up 2.0% month-over-month and up 18.8% year-over-year. The chart below highlights the recent price run-up. The soaring increase in the median price was at least partially driven by the disappearance of the low-end below $200K and a one percentage point increase in the $500,000 to $749,999 range.
The monthly inventory of new homes for sale increased from 6.3 to 6.5. The absolute inventory level of 402,000 delivered a fourth month of gains. This steady increase is likely from seasonal factors and must be biased toward the higher-end of the price spectrum.
Regional sales numbers were mixed with some exceptionally large year-over-year swings. The Northeast followed October’s steep drop of 26.8% with a gain of 8.8% for November. The Midwest plunged 44.8%, a second straight month with a significant decline. The South also declined double digits again, this time a drop of 21.2%. The West jumped 14.2%. The disparities reflect the uneven popularity in the regions that drove pandemic-related home purchases last year. The pandemic tailwinds are effectively over now although the price pressures are far from over.
Home Builder Confidence: The Housing Market Index – December, 2021
The bottom is in for the NAHB/Wells Fargo Housing Market Index (HMI). The on-going rebound in all three components of the HMI suggest a healthy Spring season is on the way for 2022. This outlook aligns with the stabilization in housing starts. The HMI closed the year at a lofty 90 with a 4-month streak of gains. If not for the historically high readings from a year ago, HMI would look very bullish.
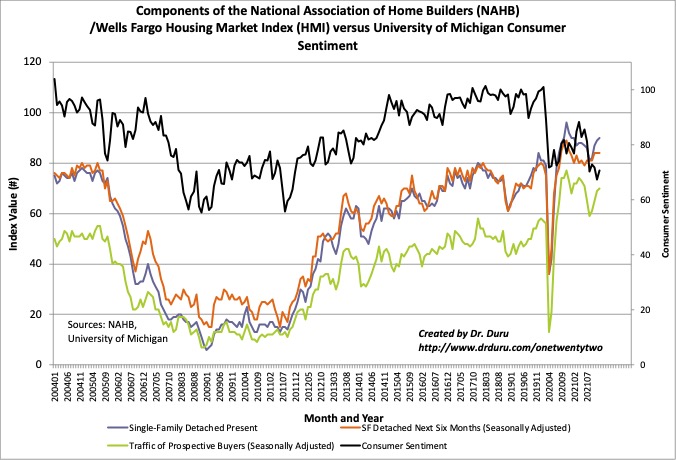
Source for data: NAHB
The NAHB did its best to include caveats on the bullish HMI reading: “While demand remains strong, finding workers, predicting pricing and dealing with material delays remains a challenge…The most pressing issue for the housing sector remains lack of inventory…Building has increased but the industry faces constraints, namely cost/availability of materials, labor and lots. And while 2021 single-family starts are expected to end the year 24% higher than the pre-Covid 2019 level, we expect higher interest rates in 2022 will put a damper on housing affordability.” After a year of similar caveats, I suspect home builders remain full steam ahead on planning for a strong 2022.
While HMI increased by a point, the regions were mixed. The Northeast had an impressive jump from 69 to 79. This gain surprised me given the steep drop in new home sales in the region. I do not know how to reconcile the two data points. The Midwest fell back from 75 to 74. The South gained two points to 89. The West remained flat at 87.
Home closing thoughts
Rentrifcation
According to Dictionary.com, gentrification refers to “the buying and renovation of houses and stores in deteriorated urban neighborhoods by upper- or middle-income families or individuals, raising property values but often displacing low-income families and small businesses.” Apparently a parallel process of displacement is happening in popular rural tourist destinations. I call it “rentrification” because landlords are upgrading their renter demographics from locals living on low-income jobs to well-heeled tourists who are in town temporarily.
Marketplace described this process of rentrification in Southern California’s Joshua Tree National Park and Yucca Valley. A low-income single mother found herself pushed out of her apartment as the landlord switched to a short-term rental business. The trends in other national park areas are similar but still small. I am struck by the similarity in economics between across gentrifying urban areas, remote workers moving out to far flung areas, and now rentrification in outright rural areas. The equilibrium is not yet settled, but natural limits will constrain rentrification because tourists areas cannot survive without workers!
Be careful out there!
Full disclosure: long ITB