
The Stock Market’s Value
The U.S. Federal Reserve’s dual mandate is stable prices and maximum employment. Yet, when the Fed sets monetary policy, the most direct and immediate impact plays out in financial markets. When the Fed eases monetary policy, the dominant theme the last 20 years, asset prices invariably increase. Indeed, over the years the stock market looks increasingly dependent on easy money policies. Accordingly, what happens if the stock market’s value is Fed-adjusted? When easy money policies increase the Fed balance sheet, liquidity in financial markets generally increase. Market participants use the extra liquidity to purchase assets. A Fed-adjusted valuation is akin to adjusting GDP growth by inflation. The resulting Fed-adjustment creates a stock market value that has essentially gone nowhere since the extraordinary Fed interventions of the 2008/2009 financial crisis.
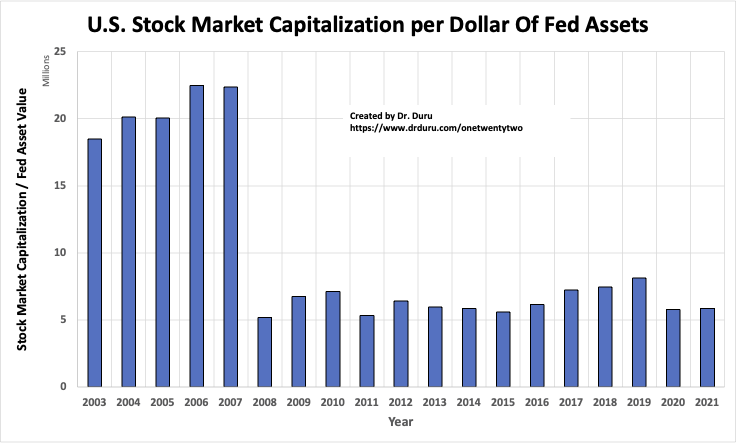
For those that believe like I do that the Federal Reserve helps to prop up the stock market, the graph above of the stock market’s value adjusted for the Fed’s balance sheet provides a powerfully affirming symbol. Of course, two assets increasing at the same time does not prove cause and effect. The parallel moves could represent spurious correlation. However, in this case, the mechanism that feeds Fed asset purchases into higher asset prices in financial markets is well-understood and fully acknowledged. Accordingly, the above graph has value and meaning.
The Methodology
My calculation of the stock market’s value adjusted by the value of Fed assets on the balance sheet comes from multiple sources and some extrapolation. Read below for the steps:
The market capitalization of the U.S. stock market comes from the World Bank’s data on listed domestic companies. Data at the time of writing are only available through 2019.
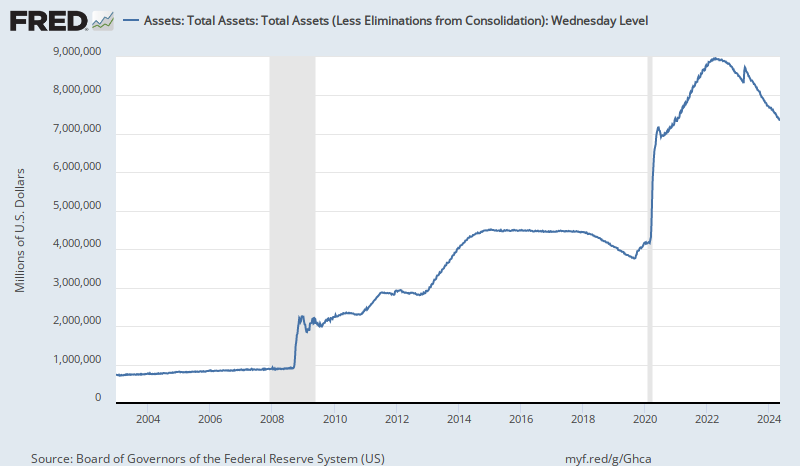
The St. Louis Federal Reserve’s FRED blog describes the Fed’s balance sheet. I also wrote a piece earlier this year describing how the liquidity from the Fed’s balance sheet helps prop up stock valuations. FRED also provides data on total Fed assets and includes a breakdown of the myriad categories and sub-categories.
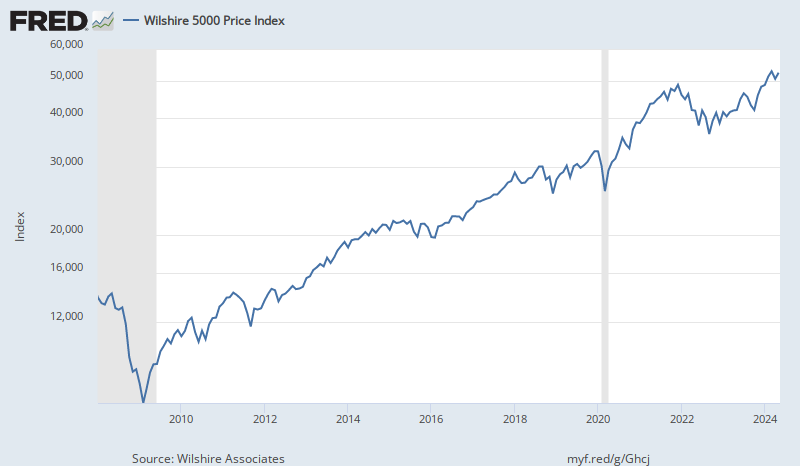
The different time frames prevented me from simply divided the data from the World Bank by the data from FRED. I filled in the missing data by using the relationship between the Wilshire 5000, an approximate price index of the entire U.S. stock market, and the World Bank market cap data. The resulting formula allowed me to estimate data for 2020 and 2021 (year-to-date). I used FRED to get data on the Wilshire 5000.
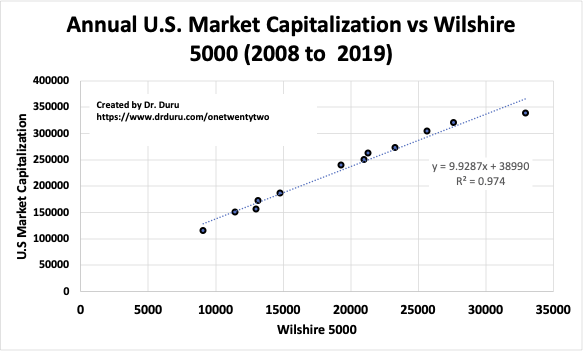
The last data point in the graph for the Annual U.S. Market Capitalization vs Wilshire 5000 (2008 to 2019) departs a bit from what is otherwise a perfectly linear relationship. As a result, I am very interested in following up this analysis with an update. It is possible that the relationship is changing such that I am over-estimating the current market cap of the market. If so, the Fed-adjusted valuation of the stock market’s value is also lower.
The Trade
The lesson is simple: buy what the Fed buys and buy what the Fed props up. The historic market interventions at the onset of the coronavirus pandemic created a similarly historic bottom in the stock market. On-going support from the Federal Reserve helped generate a relentless uptrend even as market breadth deteriorates month-after-month. The Fed will at some point need to start withdrawing its massive support for financial markets as the economy continues to strengthen and as fiscal support continues pouring into the economy. Thus, when that moment becomes clearer for market participants, poor market breadth will grease the skids of a notable sell-off.
Be careful out there!
Full disclosure: no positions