
The Bullish Engulfing Pattern
A bullish engulfing pattern is a candlestick chart pattern used in technical analysis. According to SwingTradeBot, the chart pattern “forms when a small black candlestick is followed by a large white candlestick that completely eclipses or engulfs the previous candlestick’s real body.” Most importantly, the pattern can signal the end of an enduring downtrend. The small black candlestick represents the final exhaustion of sellers. The subsequent large white candlesticks represents buyers rushing into the void left behind by the last motivated sellers. A qualifying pattern showed up today in Uber Technologies (UBER). However, traders might miss the pattern if they insist on being extremely technical.
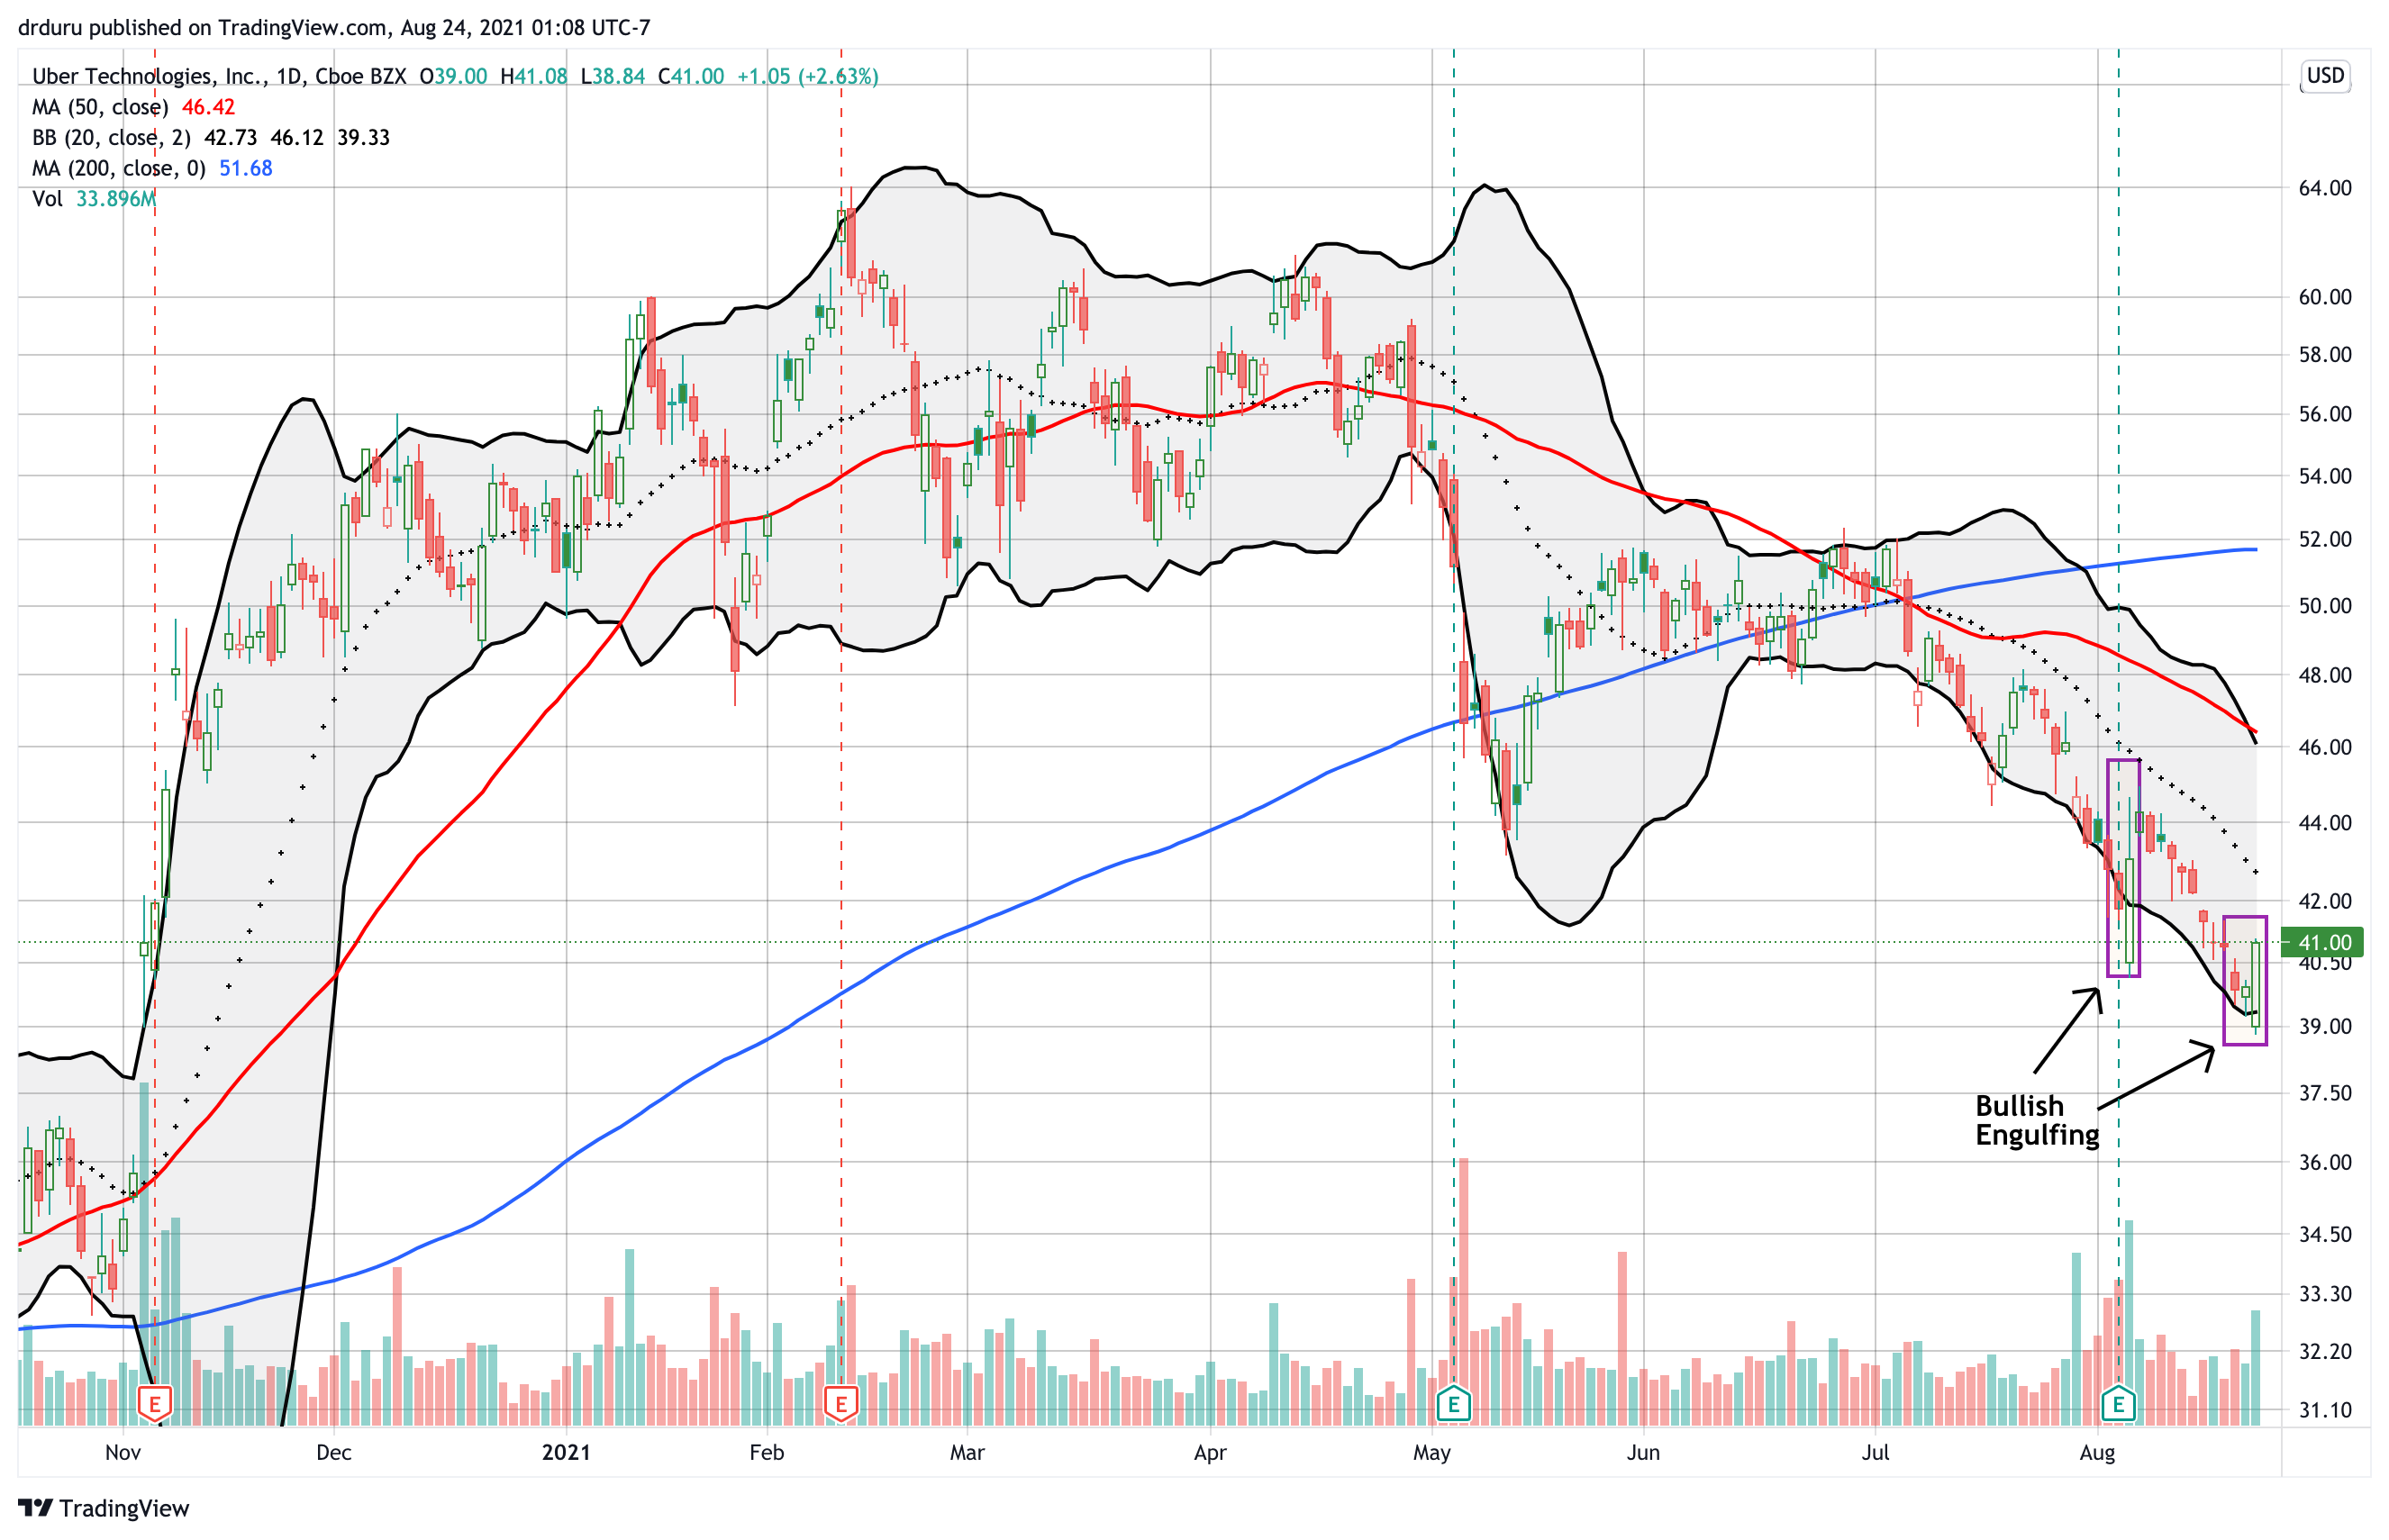
The color coding for the chart uses red instead of black for downward price movement from the opening price. Note that today’s pattern exactly matches the definition of a bullish engulfing pattern for the engulfing candle. The previous candle is also white, but I am fine because the candle’s small size indicates a near stalemate between buyers and sellers. Moreover, today’s 2.6% gain managed to engulf the candle from two trading days ago which was a small black (red) candlestick. So either way, I think traders should interpret the move as essentially a bullish engulfing pattern.
Also note that UBER printed a bullish engulfing pattern shortly after earnings earlier in August. That pattern only delivered one additional day of gains. Interestingly, buyers stepped in just in time to prevent sellers from confirming a complete failure of the the first bottoming signal.
The Trade
The best trade on the bullish engulfing pattern is the simple trade. If I did not already own shares of UBER, I would buy here. I moved my stop below the day’s intraday low. Overhead resistance from the declining 50-day moving average (DMA) (the red line above) represents the first upside target. This resistance is dropping fast toward UBER’s $45 IPO price.
Earnings provided the first catalyst for UBER. News that an Alameda Superior Court judge ruled Proposition 22 unconstitutional catalyzed the big gap down in UBER and in competing ride share company Lyft, Inc. (LYFT). Voters approved Proposition 22 in 2020 to allow UBER and LYFT to maintain drivers as contract workers while making some small concessions. This battle will likely make its way to California’s Supreme Court.
Bonus: Lyft, Inc. (LYFT)
A qualifying pattern appeared in Lyft, Inc. (LYFT) in parallel with UBER. Buyers timed their refreshed interest near the bottom of an over 8-month trading range. Support from the trading range provides an additional boost to the bottoming potential of the pattern.
Be careful out there!
Full disclosure: long UBER