
Stock Market Commentary
The oversold bounce last week exceeded my expectations. I did not expect the week to end with the S&P 500 and the NASDAQ hitting fresh all-time highs. Both indices seemed to offer limited upside for trading oversold conditions.The oversold bounce also disappointed me. I looked to beaten up stocks as the source of the biggest upside opportunities. Instead, the gas ran out out on some of these stocks after just one or two days while the two major indices continued to soar. This early divergence in the oversold bounce looks like a cautionary warning. The drop into oversold trading conditions did not renew interest in a broad selection of stocks. Instead, the oversold bounce was just enough to deliver a fresh booster to the elite group of stocks leading the market through this year of deteriorating market breadth.
The Stock Market Indices
I suspected the algos and like-minded traders would jump on the test of support at the 50-day moving average (DMA) (the red line below), and they delivered. The subsequent rebound for the S&P 500 (SPY) was impressive. I could have just loaded up on SPY call options and sat back for the rest of the week. Instead, I chased down other opportunities (I described some in the last follow-through trades post). The index zipped right past my 4300 line for confirming a bullish bounce and ended the week with a new all-time high.
The NASDAQ (COMPQX) followed through on its perfect bounce. Like the S&P 500, the tech-laden index ended the week at an all-time high.
The iShares Trust Russell 2000 Index ETF (IWM) ended the week as a major laggard. The buying stopped cold two days into the oversold bounce while buyers kept pouring into the S&P 500 and the NASDAQ; IWM even failed to conquer 20DMA (the dotted line below) and 50DMA resistance. This early divergence warns me that the oversold bounce failed to transform the underlying dynamics of the stock market. Instead of a broad-based rally, an elite group of stocks continues to shoulder the load of the current bull market. The small caps as represented by the IWM still look fated to churn in this year’s trading range.
Stock Market Volatility
The faders smashed the volatility index (VIX) after it reached for its heights of May. While the faders erased all the VIX’s gains from a 2-day surge, they failed to hold the VIX at its intraday low on Friday. As a result, the VIX still has a subtle uptrend in place from its lows of June. I see a warning in this trading action when combined with the struggles of IWM to fully participate in the oversold bounce.
The Short-Term Trading Call Despite Early Divergences In the Oversold Bounce
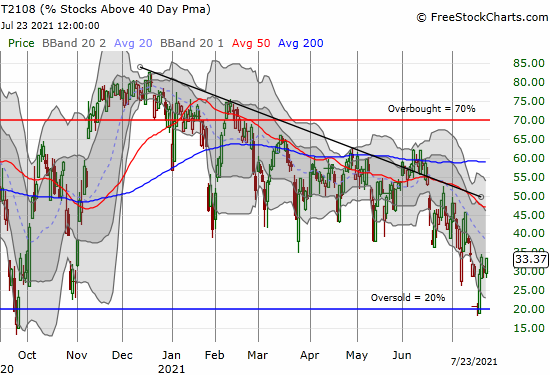
- AT40 (T2108) = 33.4% of stocks are trading above their respective 40-day moving averages
- AT200 (T2107) = 64.1% of stocks are trading above their respective 200-day moving averages (TradingView’s calculation)
- Short-term Trading Call: cautiously bullish

AT40 (T2108), the percentage of stocks trading above their respective 40DMAs, closed at 33.4%. Despite the strong oversold bounce in the S&P 500 and the NASDAQ, AT40 not only failed to reach the previous downtrend line (the black diagonal below), but also it fell just short of the high for the week. AT200 (T2107), the percentage of stocks trading above their respective 200DMAs, also performed poorly. This indicator of longer-term health faded after the first two days of the oversold bounce. These early divergences signal the biggest warnings of the oversold bounce. My favorite technical indicator had a tough challenge given oversold trading conditions occurred with the major indices still trading at very lofty levels. Now, the all-time highs of the two major indices provide as stark a contrast to market breadth as ever.
While I am wary, I remain cautiously bullish on the stock market. AT40 is too low to switch the trading call. The optimistic scenario indicates a lot of upside ahead as AT40 (reluctantly) churns its way higher. The pessimistic scenario suggests that the stock market will quickly return to oversold conditions. In both cases the risk/reward for the trading call remains in the bullish camp: I want to buy now and perhaps buy more later.
Stock Chart Video Reviews
Stock Chart Reviews – Below the 50DMA
The Boeing Company (BA)
On the oversold market day, The Boeing Company (BA) gapped down for a 4.9% loss. BA even confirmed a 200DMA breakdown (the blue line below). However, the AT40 trading rules do not allow shorting during oversold periods (even during bear markets). Thus, the oversold signal overrode the bearish 200DMA breakdown signal. The immediate 4.9% rebound the next day provided a sharp reminder of the guidance from the trading rules. BA had enough gas for one more up day before stalling. I was able to grab a double from trading BA call options, but now I wait to see whether BA can confirm its 200DMA breakout. I will not likely try additional trades ahead of earnings on the morning of July 28th.
The Boston Beer Company (SAM)
I never thought a beer company could deliver high tech kind of gains. From its last major bottom in 2017, The Boston Beer Company (SAM) increased in value almost 10x at its all-time high in April of this year. Twenty-two years ago, SAM was a single digit stock! With that perspective, Friday’s post-earnings crash looks like a hiccup for a monster performer. Accordingly, I am wondering whether this near reversal of all the gains since earnings a year ago is an opportunity to trade SAM for an eventual rebound to 50DMA and/or 200DMA resistance. In its earnings release, The Boston Beer Company explained:
“…our 24% depletions growth for the second quarter decelerated from our first quarter growth of 48% and was below our expectations, as the hard seltzer category and overall beer industry were softer than we had anticipated. Hard seltzer category growth was negatively impacted by several developments: (1) slowing growth in household penetration as the market matures and there is less new trial, (2) a gradual transition of volume to the On-Premise channel as hard seltzer becomes a more regular option in that channel, (3) new hard seltzer brands at retail that resulted in a proliferation of choices and consumer confusion, and (4) a challenging comparative period of significant pantry loading related to On-Premise restrictions in the second quarter of 2020.”
The company went on to reassure investors that “four of our five major brands grew in the second quarter and we continue to expand our market share.” Accordingly, I see the catalyst for an eventual rebound once the shock of the seltzer warning wears off. I am a buyer of SAM on a close above Friday’s intraday high at $745. Such a close presumably signals the return of buyer support. SAM may not achieve this milestone until the stock finishes reversing its gains from last July’s earnings.
Celsius Holdings, Inc (CELH)
I had to preserve remaining profits on Celsius Holdings, Inc (CELH) after the stock dropped back to its 20DMA. I wanted to give CELH some more latitude, but the building divergences in the market ahead of the oversold market day forced me to get more conservative. Now, CELH is trying to rebound from a 50DMA breakdown. I put this stock on the shelf as I see little reward in trying to time or wait through a bunch of churn.
DMC Global Inc (BOOM)
When stocks preform poorly in the middle of a market oversold bounce, I get wary. DMC Global Inc (BOOM) faded from a 200DMA breakout and then followed through with an ominous pre-earnings 6.5% loss. Some trader(s) seemed to get the drop on bad news waiting around the corner. BOOM plunged 11.3% post-earnings and closed well below its lower Bollinger Band (BB). DMC Global Inc is in the oil services industry, but the stock’s valuation is relatively elevated. So, I am not eyeing BOOM for a buy just yet.
In fact, BOOM could be a short if a weak rebound unfolds from here. Bears are already all over BOOM with 13.1% of the float sold short. Trouble first started for BOOM in March with a 50DMA breakdown that disrupted a prior relentless run-up.
Ethan Allen Interiors (ETH)
I see a warning in the wavering performance of Ethan Allen Interiors (ETH) during the market’s oversold bounce. On Thursday, ETH fell 4.8% and closed below its 200DMA for the firs time in 11 months. A timely business update propelled ETH out of the bearish breakdown and into a 200DMA breakout and a 6.2% gain. The market’s reaction to earnings on August 9th should provide insight on whether sentiment has truly turned around on ETH. Meanwhile, I am a buyer and holder on ETH only above Friday’s close. I will close out any position ahead of earnings.
Nordstrom, Inc (JWN)
I see a warning from a 200DMA breakdown in the case of Nordstrom, Inc (JWN). JWN earlier faded from 20DMA resistance. Patient bears are all over JWN with 14.4% of the float sold short, so the stock could suddenly rebound at any time. Absent such market manipulation, JWN looks more and more bearish after churning in a trading range7 months ahead of this 200DMA breakdown.
Invitae Corporation (NVTA)
The market’s oversold bounce passed right by genetics testing company Invitae Corporation (NVTA). This stock has disappointed for months, especially given the encouraging business developments I observed in March. I closed out another covered call on Friday. Selling calls against NVTA has been quite profitable during churn over the past year, but I prefer an NVTA to in rally mode!
Intel (INTC)
The between earnings trade for Intel (INTC) looks complicated for the coming cycle. INTC looks bearish after plunging to a post-earnings, 6-month low. Accordingly, I have to wait for more selling to wash out before daring to buy a fresh tranche of call options. If INTC somehow turns right around, I will not touch it until a breakout above 50/200 DMA resistance.
iShares MSCI Emerging Index Fund (EEM)
Chinese stocks are helping flash a warning for the iShares MSCI Emerging Index Fund (EEM). China’s various market and business crackdowns placed a lid on the upside in many Chinese stock favorites. The latest moves helped drive EEM to a 1.5% loss and a large market under-performance for the day. Accordingly, I see more and more pundits advise staying away from Chinese stocks (John Rutledge and Jim Cramer, for example). I slammed this rule in place for myself back when the former Presidential administration threatened Chinese stocks with greater scrutiny and delisting. Even the permabulls on China on the CNBC Fast Money crew are finally getting nervous…
Stock Chart Reviews – Above the 50DMA
The Walt Disney Company (DIS)
The blockbuster weekend for Disney Marvel’s Black Widow generated a lot of stock market excitement. The Walt Disney Company (DIS) gained 4.2% on the following Monday. DIS has yet to close any higher than that 50DMA breakout. The stock market’s drop into oversold conditions helped DIS finish reversing its Black Widow gains. Surprisingly, DIS failed to gain much from the oversold bounce and is back to its 3-month running struggle with 50DMA resistance. The Walt Disney Company reports earnings on August 12th.
Rapid7 (RPD)
Cybersecurity software company Rapid7 Inc (RPD) is enjoying a strong July. The stock market’s oversold bounce helped RPD accelerate its gains. RPD gained 13.2% on the week and accomplished successive all-time highs. RPD is a buy on the dips.
Iridium Communications Inc (IRDM)
Earnings helped propel satellite communications company Iridium Communications Inc (IRDM) to a 9.0% gain. Yet, IRDM has not generated much follow-through. I am on the sidelines watching until IRDM pulls off a breakout above the June highs. I am also likely a buyer on a test of 50/20DMA support. IRDM generally looks like it is consolidating.
Honeywell International Inc. (HON)
A small post-earnings pullback prevented diversified industrial company Honeywell International Inc (HON) from finishing a breakout move to all-time highs. HON has two 50DMA breakouts this month, so it looks like a stock that “wants” to go much higher. I like the setup for HON and am a buyer here. A stop-loss makes sense below last week’s low.
D.R. Horton Inc (DHI)
Nothing like an analyst upgrade to reverse market sentiment. D.R. Horton Inc (DHI) gapped down post-earnings, ended the day with a 2.0% loss, and confirmed 50DMA resistance. Undeterred, Raymond James slapped a strong buy rating on DHI and clarified for the stock market that “…demand still far exceeds supply despite higher price.” Subsequently, DHI gapped higher and gained 4.4% on a 50DMA breakout. The rules of the seasonal trade on home builders makes me reluctant to buy despite this bullish pattern. A higher close will compel me to make yet another exception.
Lowes Companies, Inc. (LOW)
Lowes Companies, Inc (LOW) is back to bullish form after ending the week with a breakout from a July of consolidation. LOW gained 2.1%. I am a buyer here as soon as LOW “cools” off its upper Bollinger Band.
Chipotle Mexican Grill, Inc (CMG)
There is no cooling for Chipotle Mexican Grill, Inc (CMG). CMG has yet to rest after posting an 11.5% post-earnings gain. This kind of streak makes CMG a buy on the dips.
Dominos Pizza (DPZ)
Earnings also treated Dominos Pizza (DPZ) well with a 14.6% gain. Yet, sellers stepped in to end the week with a 2.5% pullback. Still, like CMG, the strong results and all-time highs make DPZ a buy on the dips. I am now much more interested in the casual dining and fast food space. Are soaring labor and food costs no longer an issue? Are the big eating establishments squeezing out smaller ones that lack the scale to manage input inflation?
Be careful out there!
Footnotes
“Above the 40” (AT40) uses the percentage of stocks trading above their respective 40-day moving averages (DMAs) to measure breadth in he stock market. Breadth indicates the distribution of participation in a rally or sell-off. As a result, AT40 can identify extremes in market sentiment that are likely to reverse. Above the 40 is my alternative name for “T2108” which was created by Worden. Learn more about T2108 on my T2108 Resource Page. AT200, or T2107, measures the percentage of stocks trading above their respective 200DMAs.
Active AT40 (T2108) periods: Day #181 over 20%, Day #3 over 30% (overperiod), Day #10 under 40% (underperiod), Day #20 under 50%, Day #32 under 60%, Day #94 under 70%


Black line: AT40 (T2108) (% measured on the right)
Red line: Overbought threshold (70%); Blue line: Oversold threshold (20%). Chart always show the latest download date. Source: FreestockCharts
Source for charts unless otherwise noted: TradingView.com
Grammar checked by Grammar Coach from Thesaurus.com
Full disclosure: long UVXY call spread, long IWM call spread, long NVTA,
FOLLOW Dr. Duru’s commentary on financial markets via StockTwits, Twitter, and even Instagram!
*Charting notes: Stock prices are not adjusted for dividends. Candlestick charts use hollow bodies: open candles indicate a close higher than the open, filled candles indicate an open higher than the close.
As new reader: Nice writeup Thanks
Welcome! And thanks!