
Stock Market Statistics
AT40 = 73.1% of stocks are trading above their respective 40-day moving averages (DMAs) (overbought 4 of last 5 trading days)
AT200 = 20.0% of stocks are trading above their respective 200DMAs
VIX = 28.2
Short-term Trading Call: neutral
Stock Market Commentary
The stock market had a promising start with a large gap up to return to overbought trading conditions. The action essentially stopped there as the stock market churned its way in and out of overbought conditions. If not for the bullish breakouts by a growing number of technology stocks, I would not continue to brace for an extended overbought rally. The S&P 500 remains the key holdout for a more bullish scenario as it lingers in an overbought holding pattern.
The Stock Market Indices
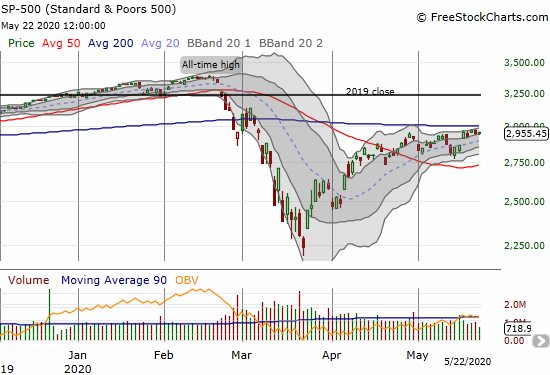
The S&P 500 (SPY) soared 3.2% to start the week. Buyers failed to generate enough momentum the rest of the week to break through overhead 200-day moving average (DMA) resistance. This resistance is likely the most watched – and most obvious – technical development in the stock market right now. Meanwhile, the 50DMA line of support is turning upward which gives a positive outlook for buying a dip ahead of a 200DMA breakout.
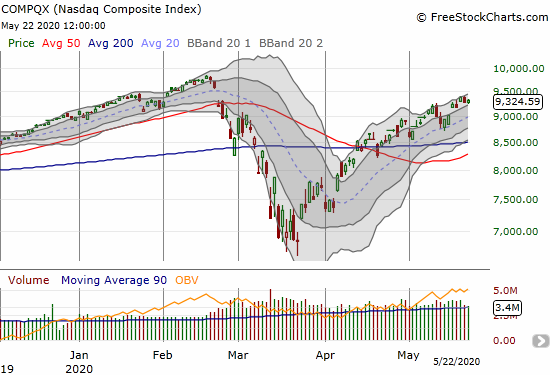
The NASDAQ (COMPQX) barely generated incremental buying momentum after Monday’s gap up. However, an upward bias remains with the technology-laden index meandering though its upper Bollinger Band (BB) channel.
Another positive development for financial markets in general is seen in the high-risk currencies of emerging markets. Investors and traders are getting more interested and those currencies are strengthening against the U.S. dollar. They suffered mightily during the stock market crash in March. I wrote about these developments in “Emerging Currencies: Turkish Lira, South African Rand, Mexican Peso.”
Volatility
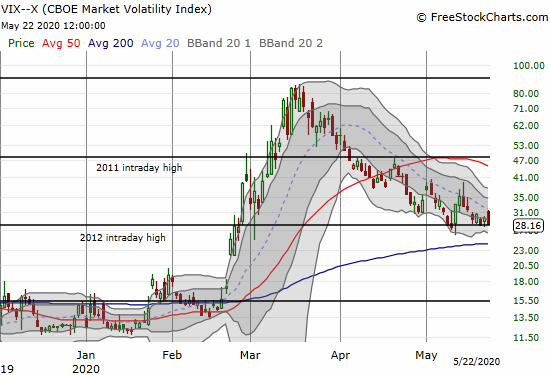
The volatility index, the VIX, struggled to hold its ground after Monday’s loss. Support from the 2012 intraday high held all week. This line has become a major battleground this month. If/when it finally gives way, I have to assume that an extended overbought rally will get its next dose of fuel.
Overbought

On Monday, AT40 (T2108), the percentage of stocks trading above their respective 40DMAs, crossed into overbought territory (above 70%) for the third time in less than a month. AT40 dipped out of overbought territory for one day last week. This trading action is acting like a coiled spring.
The Short-Term Trading Call
A lot of disbelief exists about the rally. It is hard to fathom such a strong rally in the stock market while the economic data are so bad. Yet, all we need to do is look back to the historic market bottom in March, 2009 to see that the market is perfectly capable of looking past bad data to something better on the other side. On the flip side, the stock market sells off ahead of bad economic data… and all the way down you will hear pundits talk about the market’s over-reaction. All is well. The data look fine. Plain and simple, the stock market is not obligated to follow each and every economic data point. Instead, the stock market follows supply and demand, liquidity, and the collective best guesses as to what is ahead.
Ironically, the growing narrative that the stock market continues to rally against economic data and economic rationality looks past some fundamental weaknesses in the stock market. Most retail, travel, and entertainment stocks continue to act horribly. Financials look terrible. Small caps were looking more precarious just two weeks ago. Overall, the S&P 500 has only gained 2.7% since confirming a 50DMA breakout a month ago. The index gained 28.4% in a little over three calendar weeks from the March lows. Almost 90% of the index’s gains since the March lows happened in that compressed time period. Perhaps a better interpretation of the trading action is that the March stock market collapse was a gross over-reaction to the overall prospects for the U.S. economy.
Times of market extremes are exactly the best times to ignore the data and follow the technicals. “Above the 40” is all about reading these signs to ensure buying into panic and oversold conditions and, at some point, selling into or out of overbought conditions. The current overbought situation is special in that other technicals are helping to keep the AT40 sell signal at bay. Bears and sellers have a lot to prove because the NASDAQ is comfortably in the middle of a bullish 200DMA breakout. The S&P 500 has a firming 50DMA support line beneath it even as it struggles to make its own 200DMA breakout. So whatever happens with overbought conditions, I have to stay neutral until either 1) the market hits oversold trading conditions again (bullish), or 2) the S&P 500 breaks 50DMA support (bearish), or 3) the S&P 500 confirms a 200DMA breakout (cautiously bullish).
Stock Chart Reviews – Below the 50DMA
iQIYI (IQ)
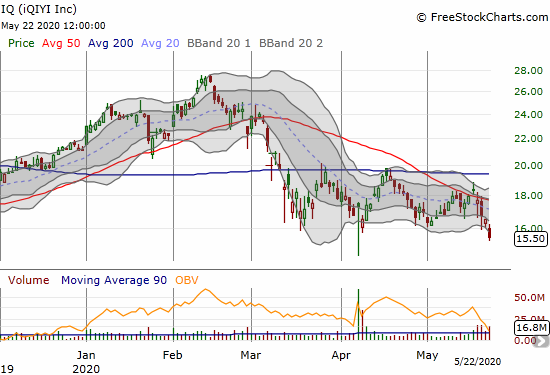
Until now, I was in the habit of buying iQIYI (IQ) on pullbacks and and taking profits on rallies. With the heated rhetoric between the U.S. and China including threats of delisting Chinese stocks, IQ is now on my no-touch list. I do not want to wake up one morning to find my position has evaporated into the ether of delisting. I also imagine selling pressure on these names will intensify.
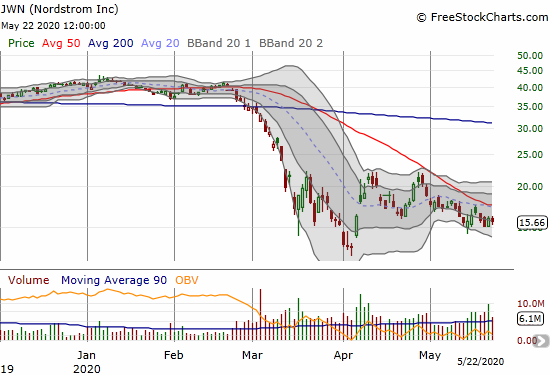
Nordstrom (JWN)
Nordstrom (JWN) is one of several retailers which has failed to benefit much from the rebound from March’s stock market crash. JWN even set a new 11-year low in April. The declining 50DMA is also providing a tight lid on the stock. I am still looking for signs of life and remain interested in buying a 50DMA breakout.
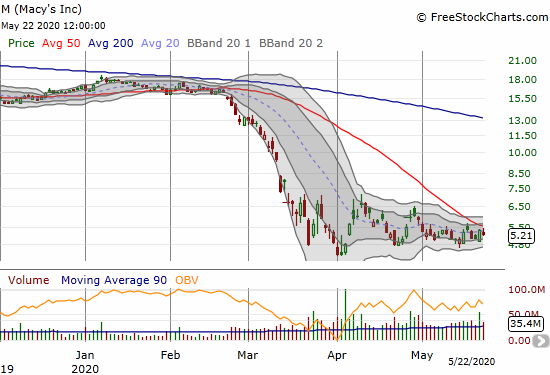
Macy’s (M)
The pattern in Macy’s (M) is the same as Nordstrom’s. However, Macy’s is now facing a moment of truth: its 50DMA is right on top of the price action. Given the lackluster trading action, Macy’s could easily just keep churning through its 50DMA on a “pseudo” breakout. I do not buy those breakouts. In April, Macy’s hit an all-time low (the stock has traded since 1993 when Macy’s came out of bankruptcy at that time). Macy’s hit an all-time high around $72 in July, 2015.
Stock Chart Reviews – Above the 50DMA
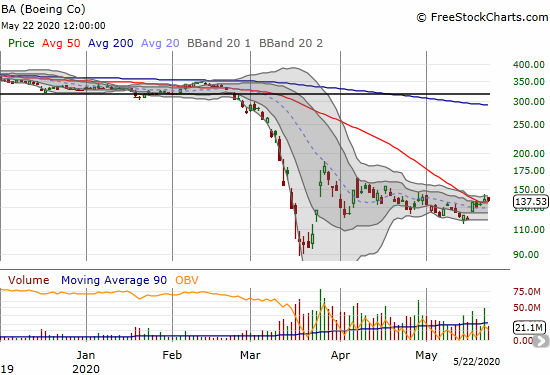
Boeing (BA)
Boeing (BA) slid its way through a pseudo 50DMA breakout. The stock gained 4.3% on Thursday on a gap over the 50DMA, but the price action hardly has upward momentum. Technically, BA is not interesting until it breaks out above its last peak of $180. Of course by then the stock will likely look “expensive” and look like a high-risk trade. It will be easier to buy BA on the next dip to support like the previous April to May downtrend.
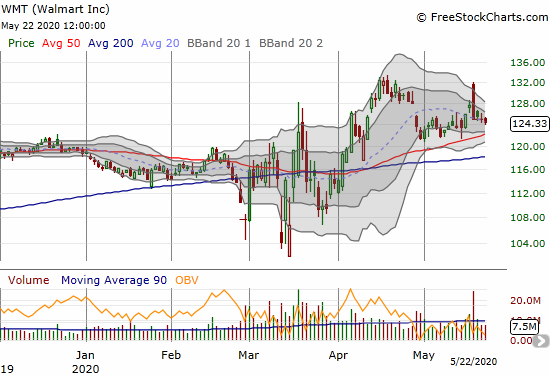
Walmart (WMT)
Walmart (WMT) reported earnings last week. The stock gapped up to challenge its all-time high in April and sellers took over from there. WMT is back to churning above its 50DMA. I do not think the stock is acting well, and I fully expect it to break through support in the coming weeks.
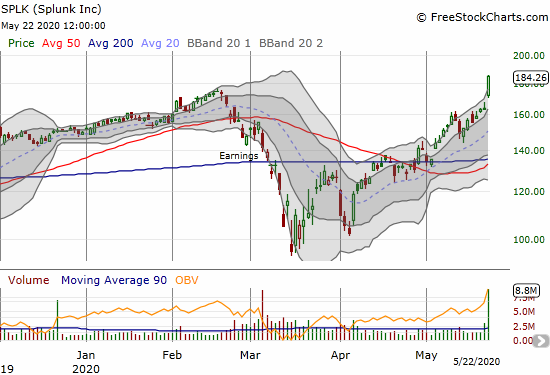
Splunk (SPLK)
Splunk (SPLK) soared 12.7% post-earnings to a new all-time high. This is a stock I should have bought and held on the April or May 200DMA breakout. SPLK is yet one more example of the power of such breakouts. I am trying a new covered call strategy for strong post-earnings stocks. I was able to flip a a weekly $185 call that expired Friday and move right into a fresh $185 weekly.
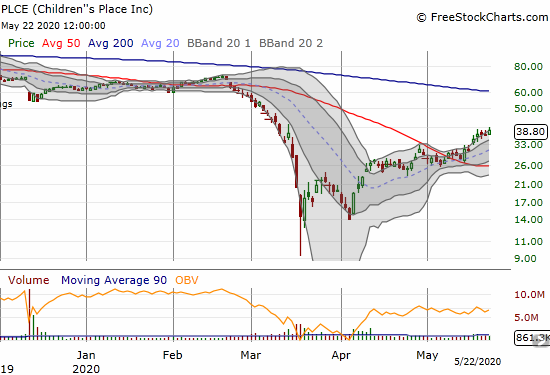
Children’s Place (PLCE)
Children’s Place (PLCE) experienced a pseudo 50DMA breakout and kept churning for 5 more days. A true breakthrough happened on May 18th when the stock gained 12.4% and made a new 2-month high. PLCE is still riding the upper Bollinger Band (BB) in a sign of buying strength. I will be looking to get back into PLCE with a stop below the 50DMA.
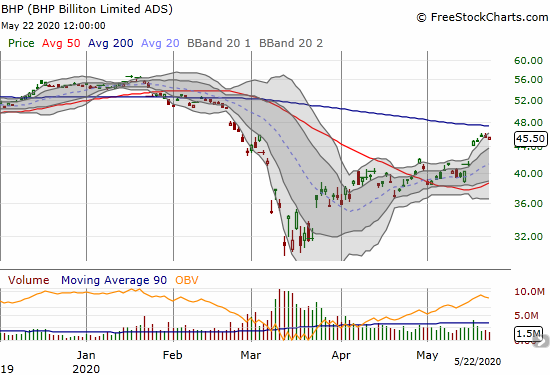
BHP Group Limited (BHP)
BHP Group (BHP) jumped over 8% to start the week. The outburst took me by surprise. I was slow to connect Brazil’s coronavirus troubles with potential disruptions in the supply of iron ore. If this disruption is temporary, then BHP will eventually fade. However, the price action ahead of last week was looking a bit firmer. Traders seem to be anticipating a ramp in infrastructure spending from China – the kind of news that is like a broken record in these markets. BHP is a short down to 50DMA support if it closes below Monday’s intraday low.
Stock Chart Reviews – Bullish Breakout
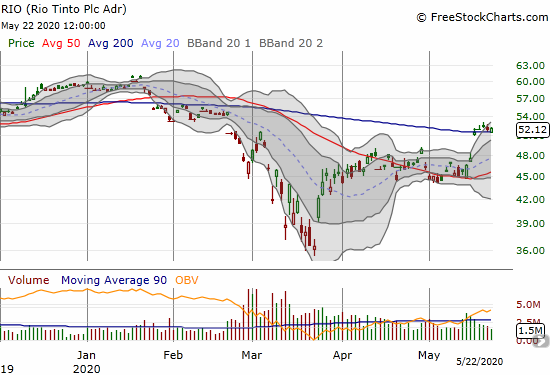
Rio Tinto (RIO)
Rio Tinto (RIO) is a closer play on iron ore than BHP. Yet RIO also jumped 8% to start the week. RIO made a 200DMA breakout that held for the week. I am looking for a higher close as a sign that this new momentum has staying power.
— – —
FOLLOW Dr. Duru’s commentary on financial markets via email, StockTwits, Twitter, and even Instagram!
“Above the 40” uses the percentage of stocks trading above their respective 40-day moving averages (DMAs) to assess the technical health of the stock market and to identify extremes in market sentiment that are likely to reverse. Abbreviated as AT40, Above the 40 is an alternative label for “T2108” which was created by Worden. Learn more about T2108 on my T2108 Resource Page. AT200, or T2107, measures the percentage of stocks trading above their respective 200DMAs.
Active AT40 (T2108) periods: Day #29 over 20%, Day #23 over 30%, Day #21 over 40%, Day #20 over 50%, Day #5 over 60%, Day #3 over 70% (overbought 4 of last 5 trading days and 12 of the last 18 days)
Daily AT40 (T2108)
")
Black line: AT40 (T2108) (% measured on the right)
Red line: Overbought threshold (70%); Blue line: Oversold threshold (20%)
Weekly AT40 (T2108)

*All charts created using FreeStockCharts unless otherwise stated
The T2108 charts above are my LATEST updates independent of the date of this given AT40 post. For my latest AT40 post click here.
Be careful out there!
Full disclosure: long SSO shares, long SPLK shares and short a call
*Charting notes: FreeStockCharts stock prices are not adjusted for dividends. TradingView.com charts for currencies use Tokyo time as the start of the forex trading day. FreeStockCharts currency charts are based on Eastern U.S. time to define the trading day.