
Stock Market Commentary
After writing the last Above the 40 post, I thought the market would soon force me off the fence and onto the bullish side of the pasture. Even with post-Fed churn in play, the market looked like it was digesting inflation fears pretty well. Instead, a rolling interruption for the stock market’s reopen trade suddenly became quite clear. The so-called “re-open” trades are in pullback mode after what I presume is a full digestion of inflation fears. Suddenly, the stock market seems a bit more tentative about the imminent reopening of global economies. Headlines about pandemic regression in Europe are surely helping to grease the skids.
The Stock Market Indices
The S&P 500 (SPY) does not show any signs of stress (yet?). The index meandered its way to a 0.8% loss and continues to trade above its flattening 20-day moving average (DMA) (dotted line below).
The NASDAQ (COMPQX) is showing hints of new stress. The tech-laden index pulled back from 50DMA resistance (red line below). However, the NASDAQ needs to break the lows of last week to confirm fresh bearish behavior.
The iShares Trust Russell 2000 Index ETF (IWM) is showing plenty of fresh stress. Sellers defined the interruption of the reopen trade by taking the index of small caps right through 50DMA support with a whopping 3.6% loss. IWM is back to negative for the month of March. As a result, my play on a rally this week fell flat on its face.
The Select Sector SPDR Trust Financial (XLF) is in a mild descent. Three days of selling confirmed a 20DMA breakdown. The uptrend for financials remains well intact down to a test of 50DMA support. I am a buyer on a successful 50DMA test.
Stock Market Volatility
The volatility index (VIX) looked ready to open the floodgates for the bulls when it closed below 20 to end trading last week. Monday’s immediate rebound kept me from tipping over into the bullish camp. The VIX gained another 2.7% today and experienced a rare close at its high of the day. The VIX is a major bear/bull battleground now.
The Short-Term Trading Call For A Rolling Interruption
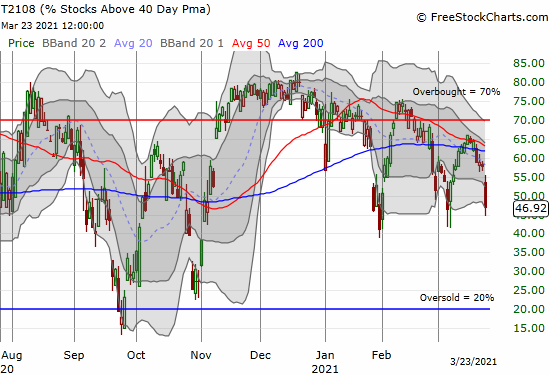
- AT40 (T2108) = 46.9% of stocks are trading above their respective 40-day moving averages
- AT200 (T2107) = 83.9% of stocks are trading above their respective 200-day moving averages (TradingView’s calculation)
- Short-term Trading Call: neutral
AT40 (T2108), the percentage of stocks trading above their respective 40DMAs, plunged all the way down to 46.9% after a week trickling away from the overbought threshold. This move confirmed the bearish implications of the failure to break the threshold. However, the relatively mild behavior of the S&P 500 and the NASDAQ and the prior weakness in the VIX waved me off from flipping bearish. Moreover, I am only just now getting over bullish leanings. Micro-bubbles, the divergences between high-tech stocks and cyclicals/industrials, and tensions over rising rates are all playing havoc with my signals!
While it is not “too late” to get bearish, shorts and puts still need to be very selective given the scattershot of trading action. An AT40 breach of the prior March low will signal soaring odds for a much overdue visit back to oversold trading conditions. A bounce off these AT40 levels would squash my bearish alert just as fast as the swatting of my tentative bullish alert. On balance, the short-term trading call remains neutral and awaits some kind of resolution one way or the other.
The currency market suddenly added its own interruption. The Australian dollar versus the Japanese yen (AUD/JPY) dropped 1.8%. At the time of writing, the indicative currency pair is precariously perched at the edge of a key test of 50DMA support and the February low. A break through these levels will be a clear “risk off”, and thus bearish, signal, especially in combination with other key breakdowns in the stock market. I am accumulating a long position here as part of a larger basket of hedged trades.
Stock Chart Reviews – Below the 50DMA
BHP Group (BHP)
Diversified commodities company BHP Group (BHP) summarizes well the sudden change in sentiment on the inflation trade. It took me until now to notice BHP’s pullback as an early signal of the interruption of the reopen trade. After its last dividend distribution, BHP has continued downward nearly non-stop. The stock is suddenly right back to its February lows. I am waiting for a successful test of this support before refreshing my stash of BHP call options. A breach of February support puts the uptrending 200DMA in play (blue line below).
Stock Chart Reviews – Above the 50DMA
Facebook (FB)
Social media giant Facebook (FB) is back to ignoring the noise – no interruption here. FB represents the other (big cap tech) side of the rotating divergences in the stock market. The stock suddenly burst out of the tightening wedge between the 50 and 200DMAs. Buyers relentlessly took FB just short of a challenge of its all-time high set back in August. For now, the stock remains in an 8-month trading range.
Be careful out there!
Footnotes
“Above the 40” (AT40) uses the percentage of stocks trading above their respective 40-day moving averages (DMAs) to measure breadth in he stock market. Breadth indicates the distribution of participation in a rally or sell-off. As a result, AT40 can identify extremes in market sentiment that are likely to reverse. Above the 40 is my alternative name for “T2108” which was created by Worden. Learn more about T2108 on my T2108 Resource Page. AT200, or T2107, measures the percentage of stocks trading above their respective 200DMAs.
Active AT40 (T2108) periods: Day #110 over 20%, Day #94 above 30%, Day #92 over 40% (overperiod), Day #1 under 50% (underperiod ending 12 days over 50%), Day #4 under 60%, Day #23 under 70%


Black line: AT40 (T2108) (% measured on the right)
Red line: Overbought threshold (70%); Blue line: Oversold threshold (20%). Source: FreestockCharts
Source for charts unless otherwise noted: TradingView.com
Full disclosure: long UVXY calls, long SPY put spread, long IWM calls, long BHP calls, long QQQ calls, long AUD/JPY
FOLLOW Dr. Duru’s commentary on financial markets via StockTwits, Twitter, and even Instagram!
*Charting notes: Stock prices are not adjusted for dividends. Candlestick charts use hollow bodies: open candles indicate a close higher than the open, filled candles indicate an open higher than the close. TradingView.com charts for currencies use Tokyo time as the start of the forex trading day.
Good analysis. Very helpful. Solid.
Thank you
Thanks for reading!