
Stock Market Commentary
After today’s open, the rolling interruption to the reopen trade started to look like the beginning of a real pullback. Sellers got about 90 minutes to enjoy the pressure before buyers took control. The back and forth between selling pressure and buying relief has taken a toll on a swath of the market. However, as the smoke clears on end of quarter positioning by traders and money managers, a (short-term) bottom is trying to form. The sharp rebound in stocks flashed signs of refreshed bullishness.
The Stock Market Indices
The S&P 500 (SPY) briefly broke down below its 50-day moving average (DMA) (the red line below). Buyers soon recaptured the key support line and closed the index out with a 0.5% gain. Sellers have tested 50DMA support three times in the past two months. Each test helped launch the index to a new all-time high. Will this time be any different?
The NASDAQ (COMPQX) is struggling. Trading on Wednesday confirmed 50DMA resistance. Buyers on Thursday barely managed to close the tech-laden index just above flat-line. The NASDAQ now hangs in limbo awaiting a fresh upside or downside catalyst.
The iShares Trust Russell 2000 Index ETF (IWM) confirmed a 50DMA breakdown yesterday. However, buyers showed up in force at today’s intraday low. The rebound off the gap down took IWM to a 2.2% gain. Trading volume was last this high back in June, 2020. At that time, IWM was battling with its 200DMA for the first time after coming off the stock market major lows. The ingredients are here for aa (short-term) bottom. Confirmation starts with a close above the 50DMA.
Stock Market Volatility
The volatility index (VIX) took another beating after trying to launch away from the 20 level. While the VIX bounces in a 2-week trading range, the new ability to close below 20 suggests that the next break will be down.
The Short-Term Trading Call for Refreshed Bullishness
- AT40 (T2108) = 50.5% of stocks are trading above their respective 40-day moving averages
- AT200 (T2107) = 82.3% of stocks are trading above their respective 200-day moving averages (TradingView’s calculation)
- Short-term Trading Call: cautiously bullish
AT40 (T2108), the percentage of stocks trading above their respective 40DMAs, plunged all the way down to 46.9% two days ago and slipped a little further the day after. With a 2-month low in place, my favorite technical indicator looked poise to point the stock market lower. Sure enough, Thursday’s gap down open was consistent with the troubling signs. However, AT40 became extremely stretched at the lows at 35%. Similar to earlier episodes of extreme downward moves, AT40 bounced back like a rubber band. Indeed, in a bull market, I consider AT40 in the low to mid 30s to be “close enough” to oversold.
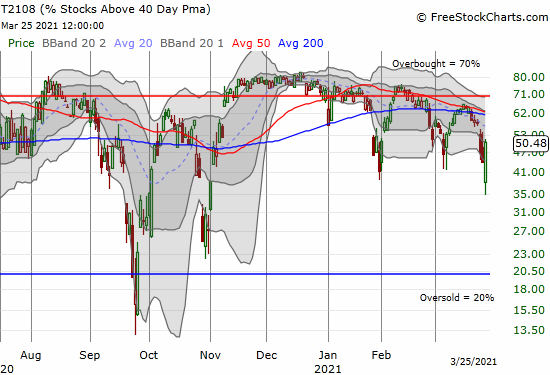
With the S&P 500 re-securing 50DMA support and the VIX closing below 20 multiple times, AT40’s rebound looks even more bullish. So, even with tech stocks mightily struggling, I finally relented with the short-term trading call. A resolution for AT40 finally looks in place with the visit to an extreme and back. I am now cautiously bullish instead of neutral. This change for the trading call will does not bless every dip and pullback in individual stocks. Instead, I will focus on buying above 50DMAs and in some cases rebounds off 200DMA support. My newfound bullishness goes on immediate pause if the S&P 500 closes below its 50DMA.
Stock Chart Reviews – Below the 50DMA
Baidu (BIDU)
The last two days of trading provided a stark reminder of the risks inherent in Chinese stocks. First, yesterday news dropped that the Chinese government is considering taking an active stewardship role over the troves of data managed by its tech companies. Today, the Securities and Exchange Commission (SEC) signaled its concern over listed companies that are under the control of foreign governments. From the press release:
“Consistent with the HFCA Act, the amendments will require any such identified registrant to submit documentation to the Commission establishing that the registrant is not owned or controlled by a governmental entity in that foreign jurisdiction, and will also require disclosure in a foreign issuer’s annual report regarding the audit arrangements of, and governmental influence on, such a registrant. The Commission is seeking public comment on these submission and disclosure requirements.”
The HFCA (Holding Foreign Companies Accountable) Act became law in December, 2020 and includes two provisions for disclosure directed specifically at China:
“The name of each official of the Chinese Communist Party who is a member of the board of directors of the issuer or the operating entity with respect to the issuer;
and Whether the articles of incorporation of the issuer (or equivalent organizing document) contains any charter of the Chinese Communist Party, including the text of any such charter.”
The implications are clear. Baidu (BIDU) for example lost 14.5% a day after losing 8.6%. The U.S. stock market has generally and blithely ignored much of the risks inherent in Chinese stocks, but the enforcement of the HFCA could change sentiment for a more sustained time. Moreover, a fresh descent in US-China relations could have broader (meaning negative) implications for the economy and the stock market down the road.
I was ready to blow off the news from China. After all, Chinese consumers only have domestic options for tech companies that deal in their data. More Chinese government control should not hurt profitability. However, the SEC’s announcement gave me an immediate flashback to my August, 2020 decision to cease trading in Chinese stocks specifically because of geo-political risks. I made a brief exception for Alibaba (BABA) when fallout from anti-monopoly moves by the Chinese government pushed the stock to an extreme.
Stock Chart Reviews – Above the 50DMA
Valero (VLO)
The energy trade is clinging to its bullish uptrends. Oil refiner Valero (VLO) toe-tapped its 50DMA support at the lows of the day. I accumulated April call options in VLO this week. If the economic recovery and reopen trade have any teeth left, a company like VLO should retain its uptrend and preserve this key support.
Be careful out there!
Footnotes
“Above the 40” (AT40) uses the percentage of stocks trading above their respective 40-day moving averages (DMAs) to measure breadth in he stock market. Breadth indicates the distribution of participation in a rally or sell-off. As a result, AT40 can identify extremes in market sentiment that are likely to reverse. Above the 40 is my alternative name for “T2108” which was created by Worden. Learn more about T2108 on my T2108 Resource Page. AT200, or T2107, measures the percentage of stocks trading above their respective 200DMAs.
Active AT40 (T2108) periods: Day #112 over 20%, Day #96 above 30%, Day #94 over 40%, Day #1 over 50% (overperiod ending 2 days under 50%), Day #6 under 60%, Day #25 under 70%


Black line: AT40 (T2108) (% measured on the right)
Red line: Overbought threshold (70%); Blue line: Oversold threshold (20%). Source: FreestockCharts
Source for charts unless otherwise noted: TradingView.com
Full disclosure: long UVXY calls, long SPY put spread, long VLO calls
FOLLOW Dr. Duru’s commentary on financial markets via StockTwits, Twitter, and even Instagram!
*Charting notes: Stock prices are not adjusted for dividends. Candlestick charts use hollow bodies: open candles indicate a close higher than the open, filled candles indicate an open higher than the close. TradingView.com charts for currencies use Tokyo time as the start of the forex trading day.