
Stock Market Statistics
AT40 = 40.2% of stocks are trading above their respective 40-day moving averages (DMAs) (2-month low)
AT200 = 43.0% of stocks are trading above their respective 200DMAs (2 1/2 week low)
VIX = 31.5
Short-term Trading Call: cautiously bearish
Stock Market Commentary
The weeds in the stock market thickened last week. Tech stocks fertilized the thicket as momentum sagged throughout the sector. The trading action looks like a classic case of profit-taking after heady gains.
Still, the weeds have yet to overwhelm the stock market. This pullback stayed in “garden variety” mode since the big indices have not suffered conclusive breakdowns.
The Stock Market Indices
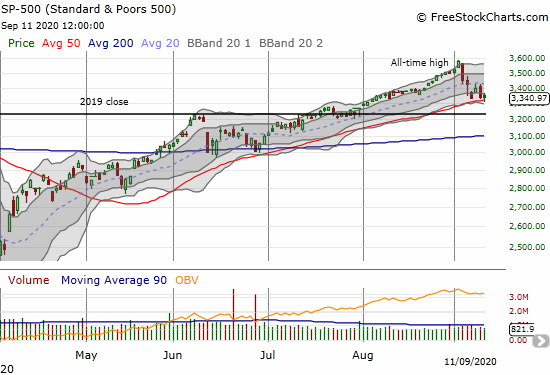
The S&P 500 (SPY) traded below its 50-day moving average (DMA) at one point during trading. Buyers cleared some weeds and took the index above its 50DMA. The S&P 500 is down 6.7% since its one-day parabolic shot to its last all-time high. The index has cooled off but not yet broken down.
Weed whackers were not able to save the NASDAQ (COMPQX) from a 50DMA breakdown. Tech stocks will be in focus this week as further weakness grow a clearer bearish signal for the stock market. If the NASDAQ continues to rebound from here, I will watch 20DMA resistance for a potential point to fade.

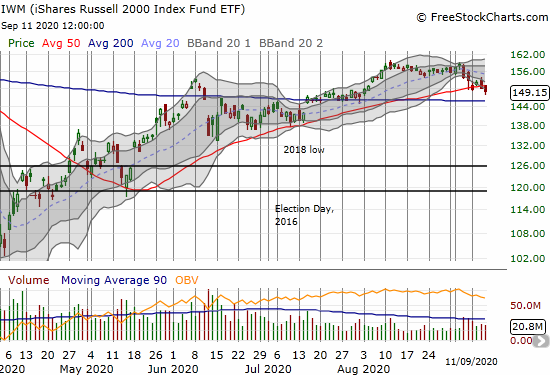
The iShares Russell 2000 Index Fund ETF (IWM) made a bearish move with a 50DMA breakdown and 1-month low. Next test is 200DMA support.
Stock Market Volatility
While buyers took stocks and indices off their intraday lows, fear evaporated from the market with a quickness. The volatility index (VIX) sagged 9.6%. The big surge from September 3rd is almost a distant memory. However, I continue to expect a higher bias for volatility for this month and October. I am looking to buy cheaper put options this week with October expirations.

The Short-Term Trading Call for This Stock Market
AT40 (T2108), the percentage of stocks trading above their respective 40DMAs, closed at 40.2%, a new 2-month low albeit marginal. The short-term trading call stays at cautiously bearish. The caution now is about looking out for a snapback relief rally. I want to fade such rallies.
Stock Chart Reviews: Video Summary
Stock Chart Reviews – Below the 50DMA
Coupa Software Incorporated (COUP)
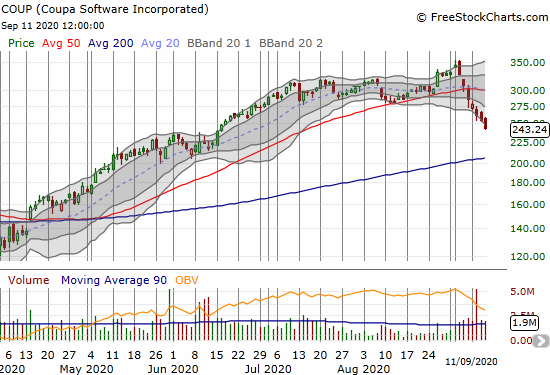
Coupa Software Incorporated (COUP) is one of many high-flying momentum tech stocks in correction mode. COUP signaled a top with a bearish engulfing pattern on September 2nd. Sellers continued the pressure right through earnings. COUP is now down 29.4% from its all-time high.
Lululemon Athletica Inc. (LULU)
The momentum also stopped for Lululemon Athletica Inc. (LULU) ahead of earnings. Earnings brought a confirmed 50DMA breakdown. LULU is now down 21.3% from its all-time high and in a bearish position. I was riding high with a call spread in LULU but failed to exit when trouble first emerged.

Nikola Corp (NKLA)
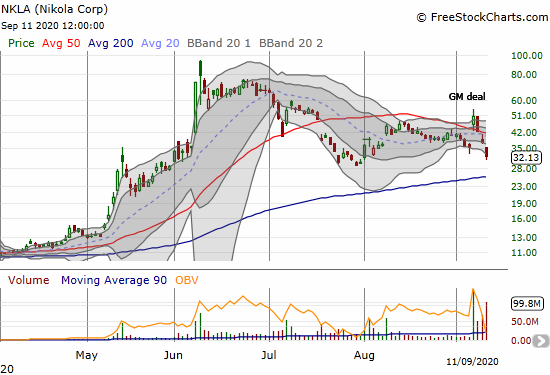
I thought the story on Nikola (NKLA) was done for a while after the company’s OEM deal with GM. A short-seller had different ideas. NKLA gapped down 11.3% on a report from Hindenburg that called NKLA a fraud. The stock was already down 15.4% ahead of the report (perhaps someone got the drop?) After an ineffective defense from Nikola’s CEO, NKLA fell another 14.5% on Friday.
Suddenly, my conservative positioning in NKLA looks just right again. I used Friday’s loss to take profits on one of two put options. That move provides a welcome buffer on the remainder of the hedged position. As a result I can still ride through the hype. I am still targeting next month for closing down the entire position.
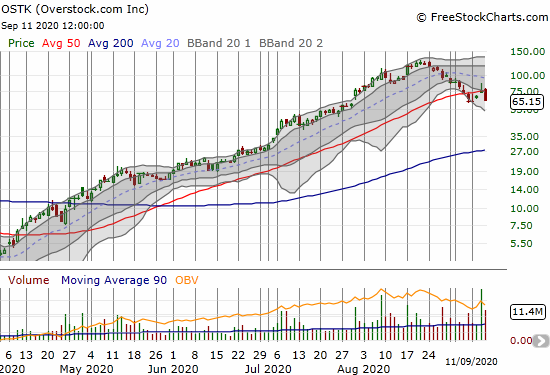
Overstock.com (OSTK)
Overstock.com ran nearly straight up from the March low of $2.65 to the August all-time closing high of $122.32. I blinked three times just writing that price range. After the all-time high, OSTK has lost almost 50% along with a struggle at 50DMA support. Given the run-up, I assume OSTK can fall a lot further from this bearish 50DMA breakdown.
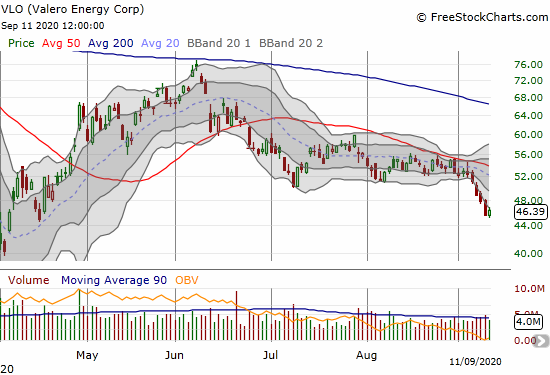
Valero Energy Corp (VLO)
Oil refiner Valero Energy (VLO) caught my interest again. VLO has struggled since the June high and now looks in danger of testing April or even March lows. I am a buyer again at those levels.
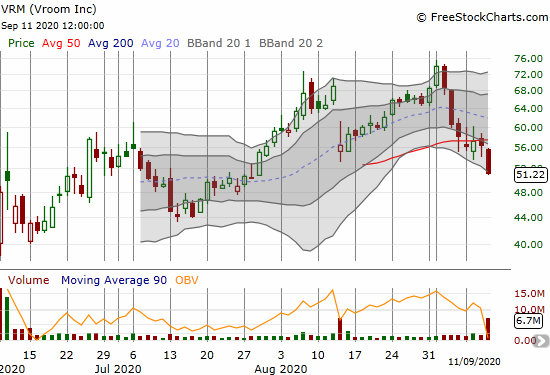
Vroom Inc (VRM)
Online used car seller Vroom Inc (VRM) confirmed a 50DMA breakdown with a 9.0% loss on Friday. The startling momentum is over and the correction looks like it is just getting started.VRM went iPO at $22 and opened at $40.25. On Friday, the company came right back to the stock market for more money with a 10.8M stock offering at $54.50. The subsequent selling below the offer price is a bad sign. I will not be surprised to see VRM testing the $40 in the next few weeks or months.
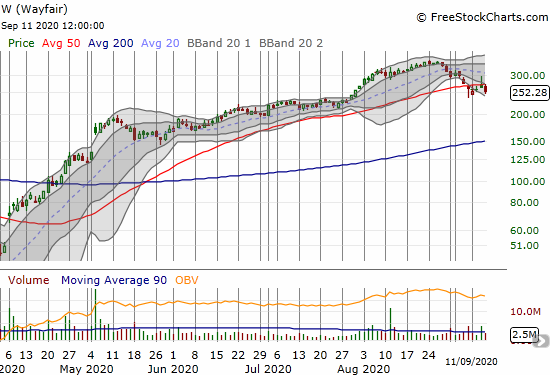
Wayfair (W)
Wayfair (W) increased from around $20 to $340 from the March lows to last month’s all-time high. This run-up is also worth three blinks. Wayfair is another company that greatly benefited from the pandemic. Such a move was not on my radar even as a complement to the pandemic housing boom. On September 4th, Wayfair neatly bounced off support formed by the point of the July breakout. A close below that level gets me chasing the stock downward.
Stock Chart Reviews – Above the 50DMA
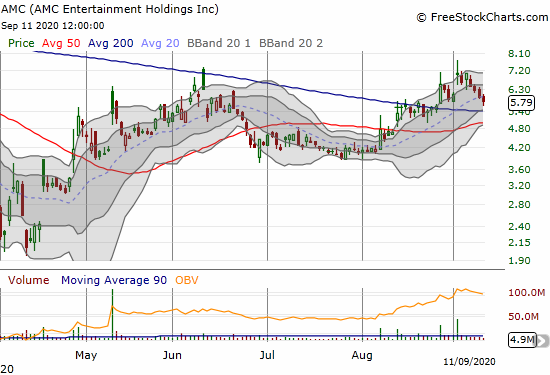
AMC Entertainment Holdings (AMC)
AMC Entertainment Holdings (AMC) is rapidly reopening theaters. The entertainment company rolled out a 30M share offering after announcing another 140 theatre re-opening. Sellers quickly reversed the September 2nd gap up and put 200DMA support back in play. I am watching to see how the stock behaves at 200 or 50DMA support.
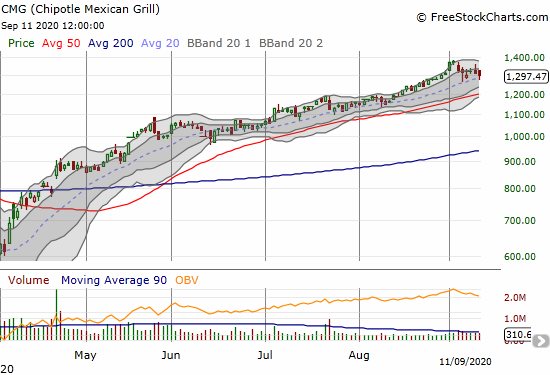
Chipotle Mexican Grill (CMG)
Chipotle Mexican Grill (CMG) hit the pause button this month. Support at its 20DMA is still holding firm. I get interested in a short-term trade (long) on a successful test of 50DMA support or (short) on a 50DMA breakdown.
Carmax (KMX)
Traditional used car dealer Carmax (KMX) also hit the pause button this month. I am watching closely for a test of 50DMA support.

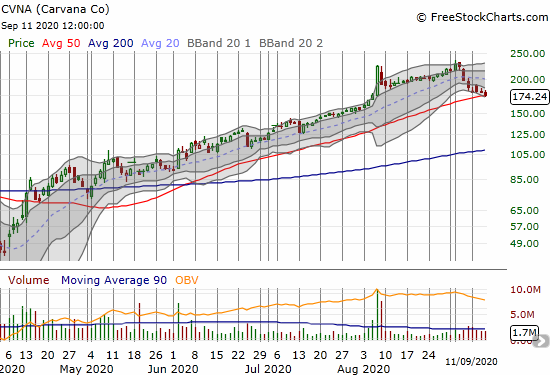
Carvana (CVNA)
If online/”vending machine” used car company Carvana (CVNA) completes a 50DMA breakdown, I will assume the startling trade in used car stocks is truly coming to an end. Just as these stocks soared on the strength of the moneyed part of the economy, watch out if bad news starts coming from the used car industry.
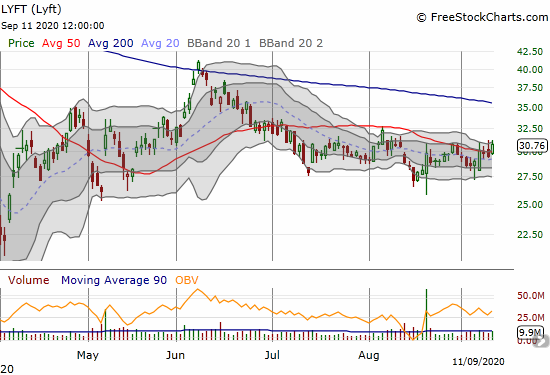
Lyft (LYFT)
Lyft (LYFT) has gone nowhere since July. A fight is raging in California over pending regulations forcing ride share companies to classify their drivers as full-time employees. I am surprised the stock market appears unconcerned about the devastating implications of losing the fight on Proposition 22 in America’s most populous state.
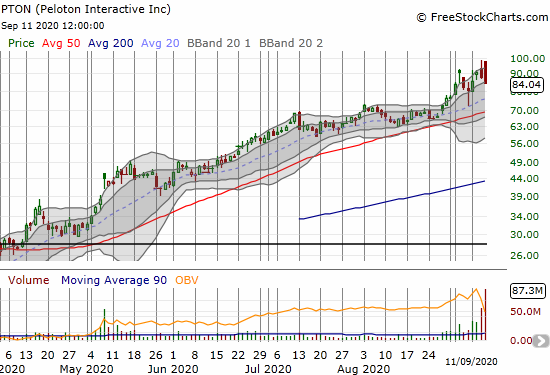
Peloton Interactive (PTON)
Peloton Interactive (PTON) delivered strong earnings results but the gap and crap and 4.2% loss in response suggests the stock market priced in the good news. I placed a weekly call spread at the $100 strike ahead of earnings assuming the stock would respond tepidly. The bearish topping pattern nearly assures a complete loss on the position. An apt punishment for straying too far from my bearish short-term trading call!
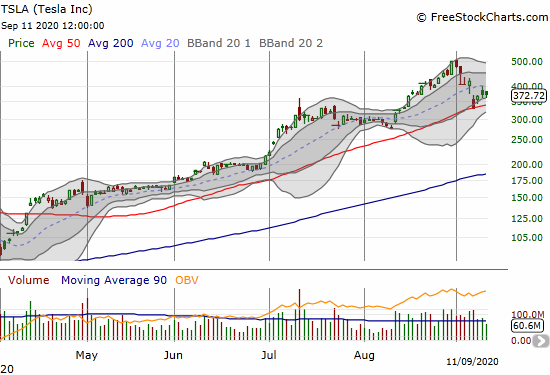
Tesla (TSLA)
Tesla (TSLA) announced a 5:1 stock split that sent the stock soaring last month. TSLA ran into a brick wall this month as the charge ran out. On September 8th, TSLA plunged 20.1% and closed right on top of its 50DMA. Technical traders took over from there starting with a sharp gap up and a gain of 10.9%. TSLA’s volatility makes for great technical trades in either direction. TSLA has its battery day on September 22nd, so I am assuming there will be enough hype to keep the stock from breaking down again before that. General stock market weakness should keep the stock capped at $400 with the 20DMA.
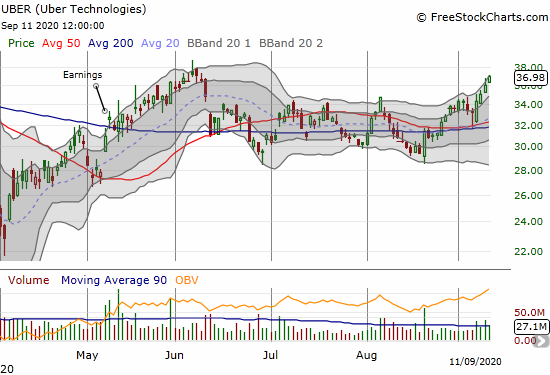
Uber Technologies (UBER)
Uber Technologies (UBER) is leaving LYFT behind. Perhaps the international footprint and food delivery business buffers the company from the risks in California. I am skeptical and am definitely not chasing the stock higher. I plan to go short if the stock pulls back from the June high.
— – —
FOLLOW Dr. Duru’s commentary on financial markets via email, StockTwits, Twitter, and even Instagram!
“Above the 40” uses the percentage of stocks trading above their respective 40-day moving averages (DMAs) to assess the technical health of the stock market and to identify extremes in market sentiment that are likely to reverse. Abbreviated as AT40, Above the 40 is an alternative label for “T2108” which was created by Worden. Learn more about T2108 on my T2108 Resource Page. AT200, or T2107, measures the percentage of stocks trading above their respective 200DMAs.
Active AT40 (T2108) periods: Day #106 over 20%, Day #100 over 30%, Day #45 over 40% (overperiod), Day #4 under 50% (underperiod), Day #6 under 60%, Day #9 under 70%
Daily AT40 (T2108)
")
Black line: AT40 (T2108) (% measured on the right)
Red line: Overbought threshold (70%); Blue line: Oversold threshold (20%)
Weekly AT40 (T2108)

*All charts created using FreeStockCharts unless otherwise stated
The T2108 charts above are my LATEST updates independent of the date of this given AT40 post. For my latest AT40 post click here.
Be careful out there!
Full disclosure: long NKLA shares, short a call, long puts; long CVNA call and put, long OSTK shares and put, long PTON call, long TSLA calls and puts, long LULU call spread
*Charting notes: FreeStockCharts stock prices are not adjusted for dividends. TradingView.com charts for currencies use Tokyo time as the start of the forex trading day. FreeStockCharts currency charts are based on Eastern U.S. time to define the trading day.