
Housing Market Intro and Summary
I asked in my last Housing Market Review whether the housing downturn could already be coming to a swift end. The stocks of home builders delivered that message and more and more earnings reports from home builders are apparently delivering messages of a sharp recovery. A widening divergence between existing and new home sales reveals shifting preferences in the marketplace while pending home sales suggests that existing home sales have a chance to catch up in due time. Overall, the housing market remains quite dynamic and fluid.
In the last Housing Market Review I pointed to a breakout by KB Home (KBH) above its 200-day moving average (DMA) as part of a growing chorus of strong home builder stocks. Last week, KB Home delivered earnings that brought the soaring optimism to a sudden halt.
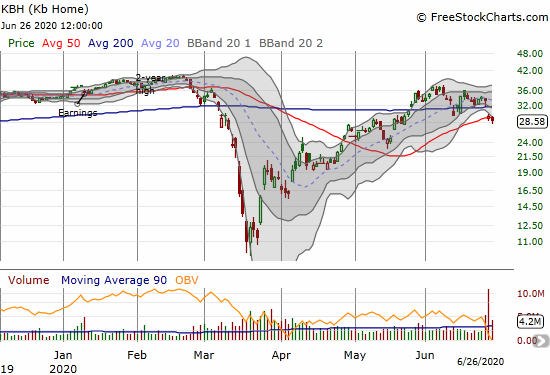
After reading through the transcript of the earnings conference call, I understand that analysts freaked out about housing demand for KBH that was softer than expected given current housing data and strong results from other builders like Lennar (LEN) and Tri Pointe Group (TPH). KBH was also more stark about the realities of an economy with extremely high unemployment. I think the selling in the stock was an over-reaction given the ability to raise prices in 60% of communities, strong margins, and the increasing strength in KBH June sales. Since I already bought a July/August calendar call spread ahead of earnings, I do not need to rush to buy the dip. Moreover, the technicals of KBH are shaky with the stock closing below its 50DMA on Friday. I definitely want to own shares in KBH ahead of the next earnings event if the stock is trading at lower prices.
Of the many interesting data points from KB Home was the following quote which helps to explain how sales can be so strong in the middle of a deep recession (from the Seeking Alpha transcript, emphasis mine):
“Well, I do think there’s still pent up demand, because the country shut down in the strongest selling period of the year, the demographics didn’t go away. And I think the headline employment, unemployment numbers are not necessarily home buyers, it’s low level wage service employees or whatever. So there’s a lot of demand out there from the demographics and the people that are employed and there’s no inventory.”
In other words, unemployment so far is hitting hardest the workers who were not part of the home buying cohort. Today’s buyers not only have jobs and high credit scores, but their survival has given them confidence that their good fortune will sustain through this economic and health crisis. These diverging fortunes will surely become an important story as the pandemic carves lasting changes into the economy.
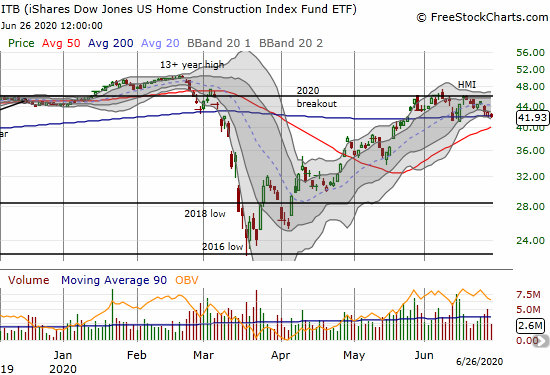
The misfortunes in trading KBH were still enough to translate into a 1.9% drop in the iShares Dow Jones US Home Construction Index (ITB). A general market sell-off helped to drag ITB downward. ITB is clinging to its 200DMA support for the second time in 2 weeks. While a breakdown from here could still be supported by an uptrending 50DMA, the line at the 2020 breakout level is looking more and more like a ceiling.
Source of charts: FreeStockCharts
Housing Data
New Residential Construction (Single-Family Housing Starts) – May, 2020
Housing starts plunged in April in the wake of an historic drop in builder sentiment. A sharp rebound in sentiment had no relative impact on starts for May. Builders are understandably still demonstrating an abundance of caution in their actions. I expect the divergence fortunes between builder sentiment and starts to persist.
May single-family home starts hit 675,000, 0.1% above April’s 674,000 starts (revised upward from 650,000) and 17.8% below levels from May, 2019. April delivered the full impact of shelter-in-place orders. May brought steady relief from these pressures so it makes sense the rate of decline year-over-year improved from April’s -22%.
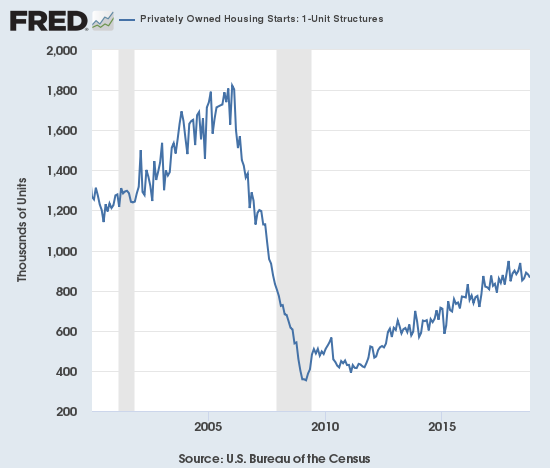
Source: US. Bureau of the Census, Privately Owned Housing Starts: 1-Unit Structures [HOUST1F], retrieved from FRED, Federal Reserve Bank of St. Louis, June 26, 2020.
I remain convinced that cautious builders will not ramp starts back up to pre-pandemic levels anytime soon. Collectively, they are much more concerned with conservative management of their balance sheets and bracing for a potential setback in the pandemic and economy. Recent earnings reports from Lennar (LEN) and KB Home (KBH) provide ample confirmation. The lack of movement in starts in May from April underlines the inertia builders will maintain on housing starts.
For May, the regional changes were decidedly down with the Northeast once again suffering the most. The West delivered a surprise with starts just down single digits. The Northeast, Midwest, South, and West each changed –29.4%, -24.3%, -20.3%, and -3.8% respectively.
Existing Home Sales – May, 2020
The divergence between declining sales and increasing prices for existing home sales grew for the third straight month. The National Association of Realtors (NAR) delivered what has become almost a boilerplate lamentation: “…New home construction needs to robustly ramp up in order to meet rising housing demand…Otherwise, home prices will rise too fast and hinder first-time buyers, even at a time of record-low mortgage rates.” As I noted above, builders have little to no incentive to take on the risk required to try to help solve this inventory shortage.
The seasonally adjusted annualized sales in May of 3.91M were down 9.7% month-over-month from the non-revised 4.33M in existing sales for April. Year-over-year sales plunged 26.2%, higher than April’s year-over-year drop of 17.2%. The NAR remained optimistic by calling May’s plunge a trough given these sales are from contracts signed in the depths of the pandemic-driven shelter-in-place orders in March and April. The coming rebound for existing home sales may disappoint given new home sales managed to start a rebound in May in a reflection of what could be a growing preference for new over existing homes.
Condos once again led the way downward by plunging to levels unseen since at least 1999 (available data). Condo sales will remain a drag on existing home sales as home buyers continue to shift preferences to single-family homes and away from dense urban areas. In the May report, the NAR acknowledged the trend…
“Relatively better performance of single-family homes in relation to multifamily condominium properties clearly suggest migration from the city centers to the suburbs…After witnessing several consecutive years of urban revival, the new trend looks to be in the suburbs as more companies allow greater flexibility to work from home.”
I am surprised the NAR did not also speak to the dramatic nature of the divergence between single-family and condo homes. I will start reporting on these numbers in the last part of this section on existing home sales.

(As of the March, 2018 data, the NAR further reduced historical data to just 13 months. For historical data from 1999 to 2014, click here. For historical data from 2014 to 2018, click here) Source for chart: National Association of Realtors, Existing Home Sales© [EXHOSLUSM495S], retrieved from FRED, Federal Reserve Bank of St. Louis, June 26, 2020.

Inventory levels continued their year-over-year declines. Absolute inventory levels of 1.55M homes actually increased 6.2% from April but declined 18.8% from a year ago (compare to April’s 19.7%, March’s 10.2%, February’s 9.8%, January’s 10.7% and December’s 8.5% year-over-year declines, unrevised). These double-digit year-over-year declines represent an interrupted Spring selling season where sellers feared exposure to coronavirus from buyers visiting their homes. “Unsold inventory sits at a 4.8-month supply at the current sales pace, up from 4.0 months in April and up from the 4.3-month figure recorded in May 2019.” The on-going year-over-year decline in inventory is now on a twelve month streak. The limited inventory helps to drive home prices ever higher.
The median price of an existing home hit $284,600, a year-over-year increase of 2.3% and the 99th straight month of a year-over-year gain. The 0.7% sequential drop from the all-time high set in April, 2020 was the first sequential decline since January, 2020.
The divergence between first-time homebuyers and investors that widened in April reversed in May. In January the share of first-timers bumped up to 32% and stayed there for February. First-timers pushed up their March share to 34% and to 36% in April. For May, first-timers fell back to 34% which was still up 2 percentage points year-over-year. The average share for first-time homebuyers for 2016 was 35%. The NAR’s 2017 Profile of Home Buyers and Sellers reported an average of 34% for 2017, 33% for 2018, and 33% for 2019.
Investors stepped into the breach by going from April’s 10% share to 14% in May. Given the declines in existing home sales, these numbers just mean that first-timers fell from the market faster than investors. This difference makes sense to me given the relative deterioration in fortunes of income versus wealth in the stock market. Investors purchased 13% of existing homes a year ago. I expect these shares to bounce back and forth in an on-going range.
The regional changes in existing home sales for May were led by the West again. For April, the West led the way downward as all regions suffered. In May, the regional changes were: Northeast -29.9%, Midwest -20.2%, South -25.1%, West -35.1%.
From September through April, all regions experienced notable and robust price jumps. The West finally broke that streak with a rare price pullback. Here are the regional year-over-year changes in median home prices: Northeast +7.8%, Midwest +3.0%, South +2.1%, West -0.2%. Overall, these are still exceptional price performances given the steep decline in sales.
Single-family home sales decreased 9.4% from February and decreased on a yearly basis by 24.8%. The median price of $287,700 was up 2.4% year-over-year and down ever so slightly from April’s $288,700. Condo sales fell even further than single-family homes: 12.8% from April and a whopping 41.4% year-over-year decline. The relative retreat from living in multi-family dwellings in dense urban cores looks like it is well underway.
California Existing Home Sales – May, 2020
The drop in sales was again historic in California where existing single-family home sales came to just 238,740, the lowest level since at least March, 2008:
- Down 13.9% from April, 2020
- Down 41.4% from May, 2019, largest year-over-year decline since November, 2007 and surpassing the 30.1% year-over-year decline in April 2019
- Year-over-year losses last hit double-digits 15 months ago
As in April, California’s imploding demand was enough to suppress price gains unlike so many other areas of the country. The median home price of $588,070 was lower 3.0% from April and down 3.7% from a year ago. This year-over-year decline broke a long streak of price gains. The last year-over-year decline was in February, 2012. The average price per square foot also dropped to $281 from $292 a year ago.
The California Realtors Association (C.A.R.) Unsold Inventory Index fell from 3.6 months in February to 2.7 in March and rebounded to 3.4 in April. The inventory index increased again in May to 4.3, up from 3.2 a year ago. Absolute inventory continued its plunge as sellers stepped away from the market: “All major regions recorded a decrease in housing supply of more than 25 percent.” Moreover, “total active listings continued to decline on an annual basis for the 11th consecutive month; the 34 percent year-over-year decrease in listings was the biggest drop since March 2013.”
Pending sales was the main positive from the C.A.R. report. The 67% surge suggests Californian existing home sales should show a large rebound in June.
New Residential Sales (Single-Family) – May, 2020
Although the earnings reports from publicly traded home builders signaled surprising strength in new home sales, I was still unprepared for THIS kind of strength. The strength began with April’s sequential increase while existing home sales slid. The divergence with existing home sales widened dramatically with May’s 676,000 new home sales, a jump of 16.6% from April’s downwardly revised 583,000 (from 623,000). Even more amazing was a robust 12.7% increase in new home sales from May, 2019.
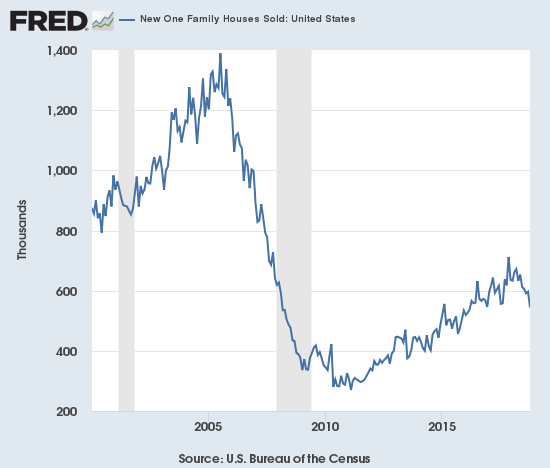
Source: US. Bureau of the Census, New One Family Houses Sold: United States [HSN1F], retrieved from FRED, Federal Reserve Bank of St. Louis, June 26, 2020.
It was telling that ITB could only manage a 0.7% gain on this big news and has traded lower since then. This large jump in sales was not just a release of pent-up demand from the coronavirus lockdowns but also likely cannibalization from existing home sales. April existing home sales were 4.33M compared to 583,000 new home sales in the same month. The 420K decline in existing home sales from April to May was 4.5X the gain in new home sales. In other words, home builders only have to steal a small fraction of existing home sales to show a lot of strength. The housing market will not be in a true recovery mode until existing home sales play significant catch-up with new home sales.
Since hitting a peak in November and December, 2017, the median price of a new single-family home trended slightly downward largely from a ramp in entry-level and lower-priced new homes. April’s $303,000 (revised downward) is close to the lows seen over the last two years. I expected home builders to keep driving prices down in order to move inventory. Instead, builders like KB Homes were actually able to push through price increases in many communities. As a result, median sales prices perked back up 4.9% to $317,900. This price was also a 1.7% year-over-year increase. The mid-range and high-end price points both experienced gains in share from the other price brackets.
The inventory of new homes surged from 5.0 to 6.4 months of sales in March. I expected a further increase in April but demand was strong enough to push the inventory slightly down to 6.3 months of sales. May’s strong demand pushed inventory all the way back to 5.6 months of sales.
All regions registered sales gains with the Northeast and the West leading by far. May year-over-year sales in the Northeast surged 45.5%, the Midwest gained 2.8%, the South hit a third straight month of gains with a 6.3% increase, and the West surged 31.0% after plunging 33.5% the month before.
Home Builder Confidence: The Housing Market Index – June, 2020
In a telling sign for now, the stocks of home builders have continued to decline since the National Association of Home Builders (NAHB) reported a strong rebound in the Housing Market Index (HMI). I explained in a previous post that good news from Lennar (LEN) and an HMI surging from 37 to 58 appeared well-anticipated by the stock market. The stock market may have even rushed ahead of the data.
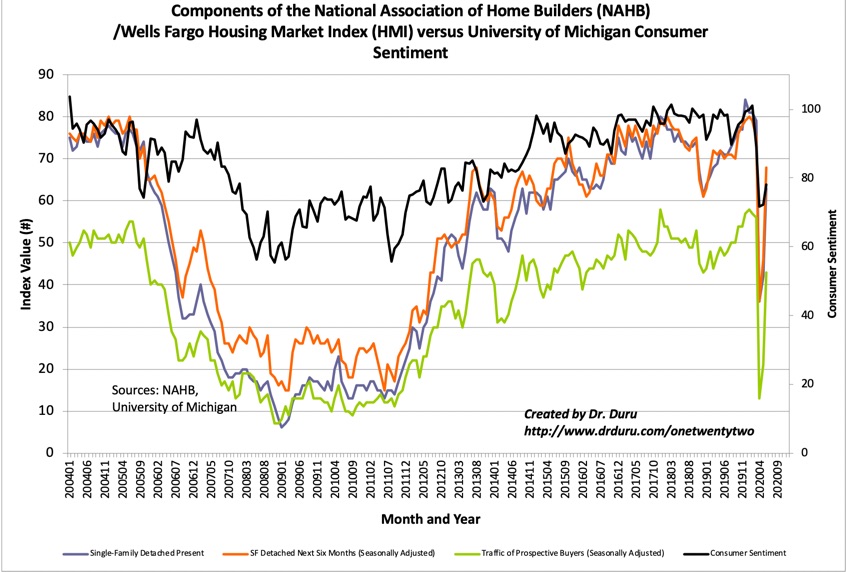
Source: NAHB
Consumer sentiment also experienced a healthy rebound, so sentiment is improving all around. Sentiment is strong enough to get the NAHB confidently pronouncing “As the nation reopens, housing is well-positioned to lead the economy forward.” As I have observed before, housing typically lags an economic recovery, and I would be very surprised if housing leads the way from this kind of deep and sharp recession. A strong housing market requires strong employment. In other words, people need jobs in other industries in order to afford something as expensive as a home. I fully expect that chronically high employment will quickly put a cap on the current housing market rebound as caution inevitably revisits even the home buyers looking to migrate from cities to the suburbs.
Unlike April, all 4 regions rebounded. Surprisingly, the West is closest to its March, pre-pandemic level, following by the South. The Northeast recovered from a fresh 8 1/2-year low and bounced from 17 to 48. The Midwest was up from 32 to 51, the South from 42 to 62, and the West from 44 to 66.
Home closing thoughts
Pending Home Sales
On May 28th, the NAR reported pending home sales that greatly disappointed the stock market even though the NAR expected “April’s pending home sales to be the lowest point for the year, and the month of May to, therefore, be the lowest point for closed sales.” The latest 1-week rolling average of pending home sales, as reported by Redfin (RDFN), have almost recovered to year-ago levels. This picture says it all about the astounding recovery in the housing market.
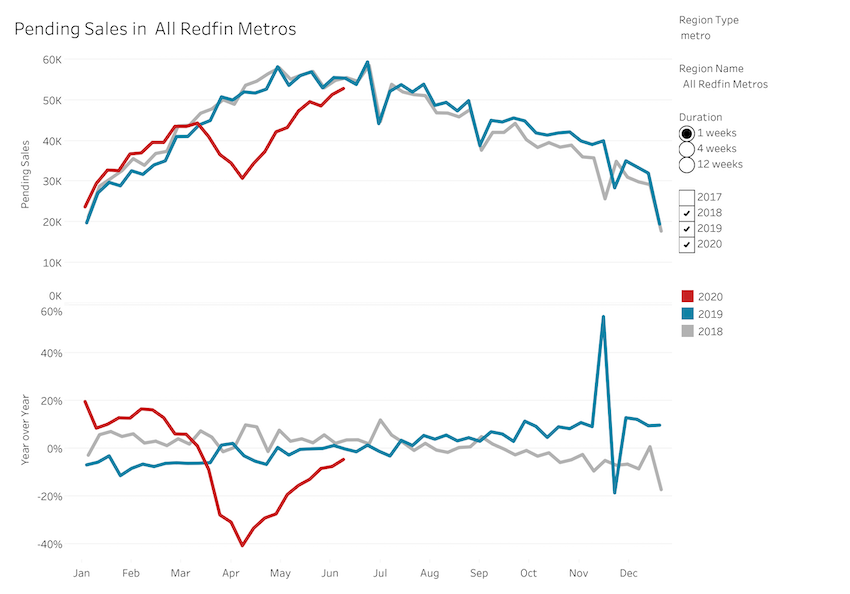
Source: Redfin
While the uptrend is encouraging, pending home sales are still bumping against a seasonal peak. It seems unlikely that the housing market will recover all the lost sales from the period of lockdown, especially with high unemployment threatening to push layoffs into more industries and areas of the economy. Still, my early assumption that an extended housing downturn was unfolding was proven premature. At this point I have to assume almost anything is possible during these unprecedented times.
Home Migrations
The flight from cities to suburbs is not the only migration to watch. Stories about people leaving California are back in vogue. This time people are leaving for affordability and politics. At a minimum, the persistently strong housing numbers in the south (whose housing market includes Texas) demonstrates a real national preference.
Be careful out there!
Full disclosure: long ITB shares, long KBH calendar call spread, long LEN