
The U.S. Dollar Index Breaks Down
The U.S. dollar broke down last week. The weekly chart below shows the U.S. dollar index (DXY) closed last week at a near 2-year low.
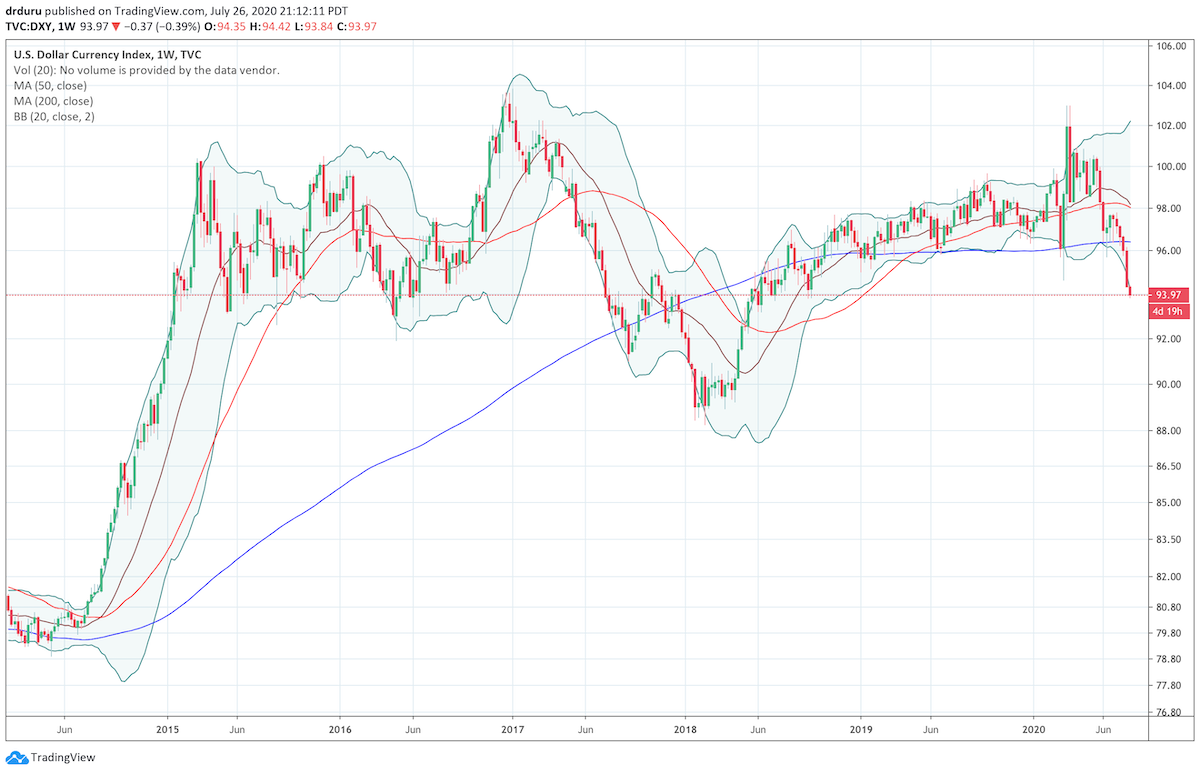
Source: TradingView.com
Numerous anti-dollar bets are gaining fast thanks to the U.S. dollar’s breakdown. The cryptocurrency Bitcoin (BTC/USD) is joining the party.
Bitcoin joins the anti-dollar party
The rumblings began on July 21st when Bitcoin surged into its 50-day moving average (DMA). On that same day, the U.S. dollar index sold off and closed just above its March low. BTC/USD broke out the next day and created the first buy signal. I decided to forgo that signal given 1) two earlier false 50DMA breakouts, and 2) in late May I locked in my last trading profits to sit on the sidelines and await a higher bar of proof with a $10K breakout.
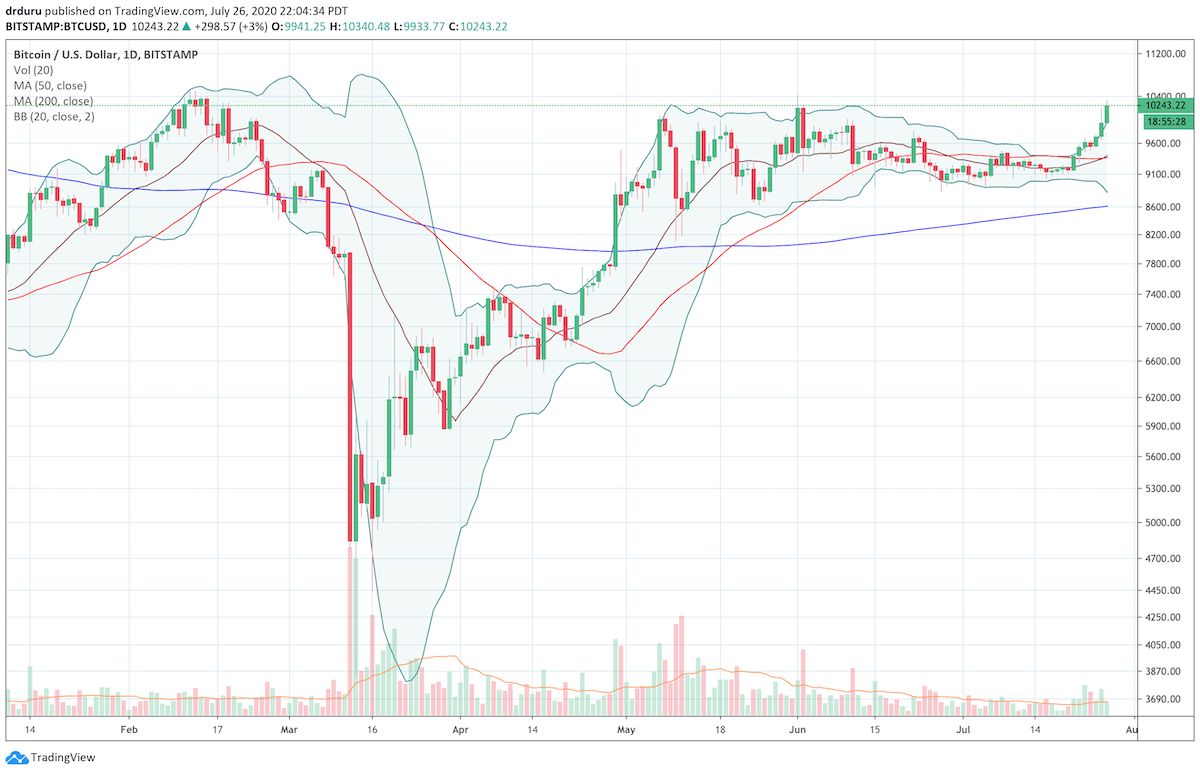
Source: TradingView.com
The $10K breakout came over the weekend. The 15-minute chart below shows an initial surge that brought in the first wave of momentum chasers. A pullback to the $9850 level became solid support for the next launch through $10,000.
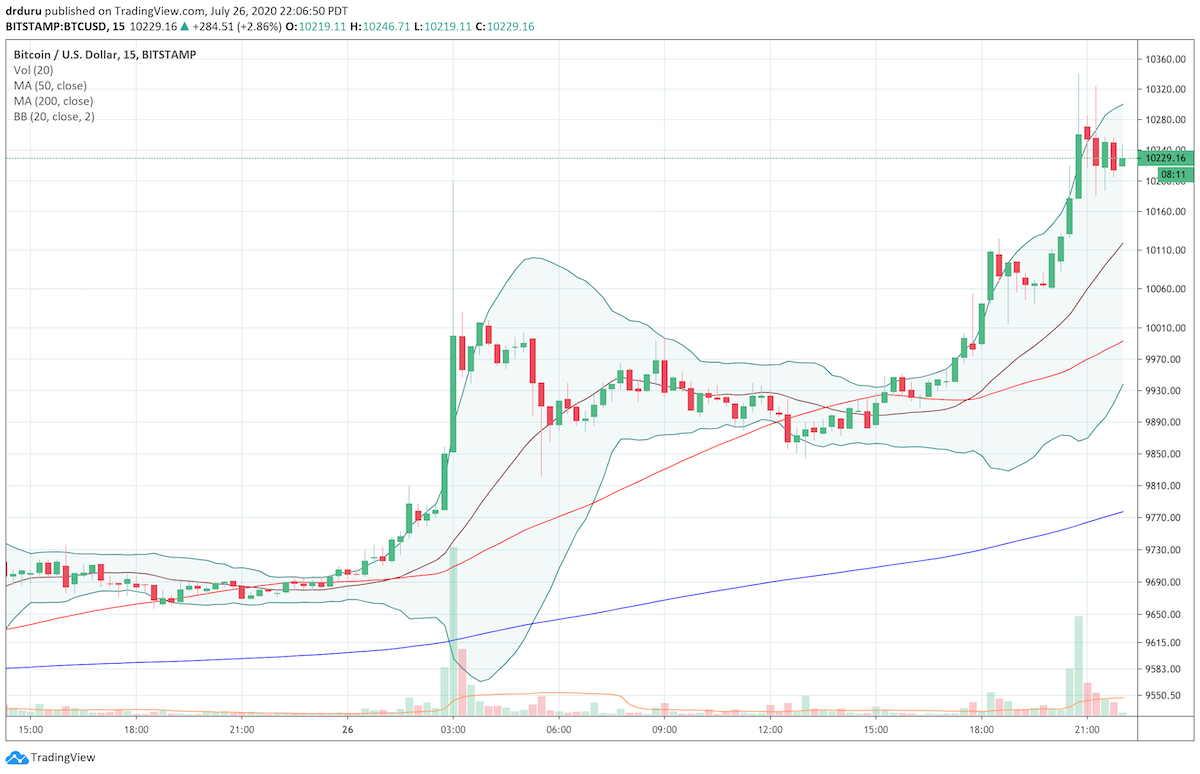
Source: TradingView.com
The Trade
I pulled the trigger on the pullback from the $10,300 level. The latest breakout took BTC/USD above the June 1st intraday high and false breakout. The next proof point sits at $10,500 where BTC/USD topped out just ahead of the pandemic-driven collapse in financial markets.
I am back in Bitcoin with the house’s money, so I am content to watch the action from here until the next entry point appears. Unless Bitcoin plunges to offer a new super-discount (say a reversal of the April, 2020 breakout at $7500), I anticipate joining the momentum chasers after a confirmed $10,500 breakout.
I am also keeping an eye on the Google Trend Momentum Check (GTMC) for signs of a blow-off run-up (a time to take profits if it happens). So far, Google searches for “Bitcoin” are sticking close to their recent languid patterns.
Be careful out there!
Full disclosure: long BTC/USD