
Housing Market Intro and Summary
Could the housing downturn already be coming to a swift end? The stocks of home builders are delivering this message. They have enjoyed a very healthy rally and recovery from the depths of the March stock market crash. The challenges ahead are large: worsening economic conditions, unemployment at historically high levels, and a nation in social and political turmoil.
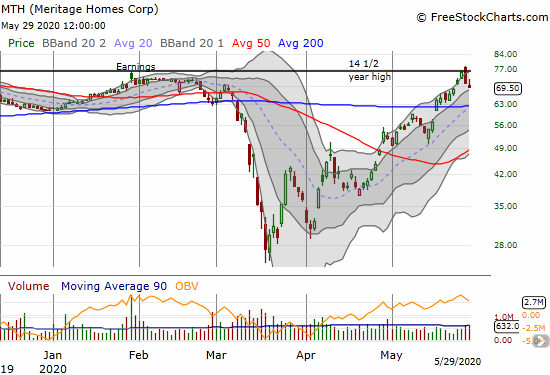
Meritage Homes (MTH) completed its leadership recovery by hitting a new 14-year high before sellers showed up the last two days. MTH is still the poster child of a complete recovery.
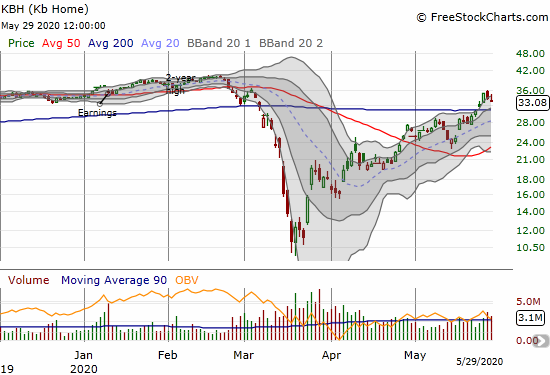
Last week, other builders like KB Home (KBH) joined MTH with breakouts above their respective 200-day moving averages (DMAs). As if the rally was not already bullish enough, the 200DMA breakouts confirm and underline the bullish mood. KBH has almost completed a full recovery from the March crash after pulling off a triple from its March lows.
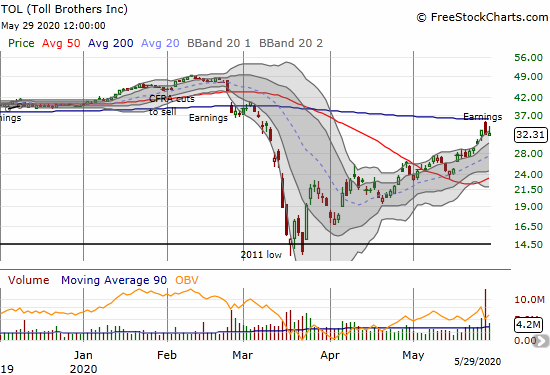
Toll Brothers (TOL) reported earnings ahead of news on pending home sales. The stock opened the day with a gap up right to its 200DMA but sellers took over from there, especially after pending home sales were released (more in the Parting Thoughts section below).
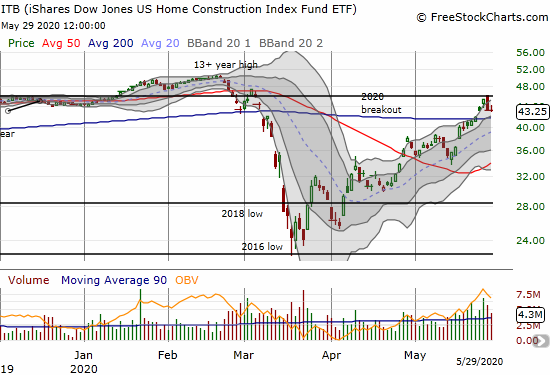
The iShares Dow Jones US Home Construction Index (ITB) summarizes the on-going bullish mood in housing-related stocks. ITB confirmed its 200DMA breakout last week. The ETF slammed into resistance from the line that marks the major breakout in January, 2020. That line also happened to represent a complete recover from the March crash. Again, the pending home sales report catalyzed sellers to step in at the critical juncture. Regardless, ITB now looks like nothing remarkable ever happened.
Source for charts: FreeStockCharts
Just as I was caught by surprise by the animal spirits that sent ITB on a relentless rally to a 13-year high, the latest rally has caught me by surprise. I am accustomed to housing investors and traders exhibiting a brutal kind of skepticism that has them on guard for signs of the next housing downturn or crash. The March crash must have washed away enough negativity for several housing cycles. While my trading strategy for trading market extremes had me loading up on housing-related stocks during the sell-off, I clearly took profits and sold calls against most of my positions far too early!
Still, with the market nearly unfettered in its optimism, I cannot help but take the other side of sentiment. I am very wary. I see tightening lending conditions and historic unemployment as tight caps on overall housing demand. As the system satisfies the demand of households who still have money and jobs, I am anticipating a significant “air pocket” at some point later in the year. The healthy economy that drove robust demand going into March is not the economy the housing market will enjoy going forward. Thus the “math” tells me that housing results will surprise to the downside at some point later this year. In my last Housing Market Review, I wrote about optimism racing ahead of the data. As the data starts to catch up, I think the fuel for optimism will slowly run dry.
Housing Data
New Residential Construction (Single-Family Housing Starts) – April, 2020
The pandemic-driven plunge in housing starts accelerated in April as expected. This drop occurred in the wake of the historic plunge in builder sentiment in April. April starts went from a 1-year low in March to a 5-year low in April.
April single-family home starts hit 650,000, 25.4% below March’s 871,000 starts and 24.8% below levels from April, 2019. April represented the full brunt of shelter-in-place orders that prevented construction in some markets and discouraged building in most others.
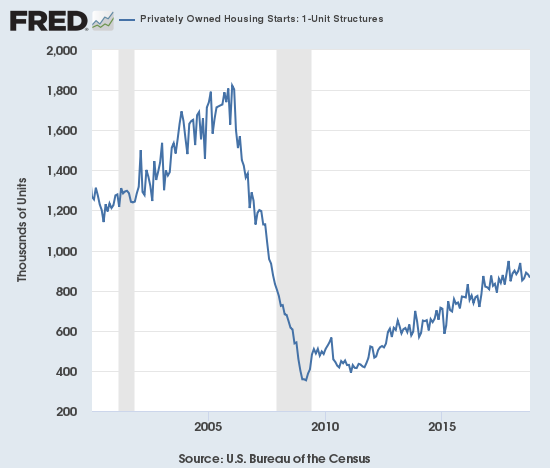
Source: US. Bureau of the Census, Privately Owned Housing Starts: 1-Unit Structures [HOUST1F], retrieved from FRED, Federal Reserve Bank of St. Louis, May 23, 2020.
Cautious builders will not ramp starts back up to pre-pandemic levels. While some builders have claimed they will revamp construction on spec homes a bit to meet the demand of first-time home buyers, I am betting that the macro-economic data and the needs to keep a healthy balance sheet will combine to keep a damper on housing starts. However, if housing starts suddenly start to surge like the stocks of home builders, I may need to adjust my tune! Thus, the starts data for May will be an early tell.
For April, the regional changes were decidedly down with the Northeast suffering the most. Given the previous furious pace of building in the West, I thought the West would be the region to suffer the largest percentage decline. The Northeast, Midwest, South, and West each changed -72.7%, -17.6%, -13.3%, and -37.3% respectively. On a relative basis, the South remains one of the strongest regions for building activity.
Existing Home Sales – April, 2020
The March existing sales numbers showed the early impact from the shutdown of the economy with a very strong divergence between declining sales and soaring prices. That divergence grew even bigger in April. From the National Association of Realtors (NAR): “…the listings that are on the market are still attracting buyers and boosting home prices…more listings and increased home construction will be needed to tame price growth.”
The decline in existing home sales is made more dramatic by the 13-year high set in February. The seasonally adjusted annualized sales in April of 4.33M were down 17.8% month-over-month from the non-revised 5.27M in existing sales for March. Year-over-year sales dropped 17.2%. Condos led the way by plunging all the way to lows last seen during the housing market trough in 2010. Condo sales will likely remain a drag on existing home sales as home buyers are shifting preferences to single-family homes which provide space and comfort for increased time spent working from home, eating at home, and self-entertaining in-home.

(As of the March, 2018 data, the NAR further reduced historical data to just 13 months. For historical data from 1999 to 2014, click here. For historical data from 2014 to 2018, click here) Source for chart: National Association of Realtors, Existing Home Sales© [EXHOSLUSM495S], retrieved from FRED, Federal Reserve Bank of St. Louis, May 23, 2020.

Inventory levels continued their year-over-year declines. Absolute inventory levels of 1.47M homes dropped 1.3% from March and a stunning 19.7% from a year ago (compare to March’s 10.2%, February’s 9.8%, January’s 10.7% and December’s 8.5% year-over-year declines, unrevised). “Unsold inventory sits at a 4.1-month supply at the current sales pace, up from 3.4-months in March and down from the 4.2-month figure recorded in April 2019.” The on-going year-over-year decline in inventory is now at eleven straight months. The limited inventory continues to drive higher home prices.
The median price of an existing home hit $286,800, another large year-over-year increase of 7.4% and the 98th straight month of a year-over-year gain. The median price hit a new record by surpassing the last peak of $285,400 in June, 2019. In my last Housing Market Review I wondered: “As the prospect draws near for ending this stubborn streak, I am not so sure anymore that the market will avoid new highs in price…[the] imbalance between supply and demand could help drive prices to new all-time highs in coming months.” Indeed, the path of least resistance continues to point higher for prices.
The divergence between first-time homebuyers and investors widened in April. In January the share of first-timers bumped up to 32% and stayed there for February. First-timers pushed up their March share to 34%. Investors continue to drop out of the market faster than first-timers as first-timers jumped to 36% of existing home sales in April. The average share for first-time homebuyers for 2016 was 35%. The NAR’s 2017 Profile of Home Buyers and Sellers reported an average of 34% for 2017, 33% for 2018, and 33% for 2019.
Investors only purchased 10% of homes in April, down from 13% of homes in March, and 17% of homes in February, January and December. The share of investors buying existing homes was 16% a year ago. Investors are demonstrating the biggest concerns about the housing market; they are implying the economic environment is providing less and less justification for paying today’s high prices.
The regional changes in existing home sales for February were led by the West. March was mixed with the Northeast leading year-over-year declines. For April, the West led the way downward as all regions suffered: Northeast -18.2%, Midwest -8.3%, South -16.8%, West -27.0%.
Like September through March, all regions experienced notable and robust price jumps in April. Here are the regional year-over-year changes in median home prices: Northeast +8.7%, Midwest +9.3%, South +6.4%, West +6.1%.
Single-family home sales decreased 16.9% from February and decreased on a yearly basis by 15.5%. The median price of $288,700 was up solidly 7.3% year-over-year and up from March’s $282,600.
{video will be posted once available from the NAR}
California Existing Home Sales – April, 2020
Californian buyers of single-family homes left the market faster than sellers in April in a flip from March’s housing dynamics in California. Inventory plunged in March but stabilized in April versus the year-ago level. The California Realtors Association (C.A.R.) Unsold Inventory Index fell from 3.6 months in February to 2.7 in March and rebounded to 3.4 in April. This was the same level as a year ago.
The drop in sales was historic in California where existing single-family home sales came to just 277,440, the lowest level since March, 2008:
- Down 25.6% from March, 2020 largest ever month-over-month decline since C.A.R. started collecting records in 1979.
- Down 30.1% percent from April 2019, largest year-over-year decline since December, 2007.
- Year-over-year losses last hit double-digits 15 months ago
The imploding demand was enough to suppress price gains unlike so many other areas of the country. The median home price of $606,410 was lower 1.0% from March and only up 0.6% from a year ago. Also, the average price per square foot dropped to $284 from the $289 a year ago.
The results of the monthly poll conducted by C.A.R. still showed a fascinating dichotomy in opinions between buyers and sellers:
“…in early April…nearly one-third (29 percent) of consumers said it is a good time to sell, up from 26 percent a month ago, but down from 45 percent a year ago. The market uncertainty has not curbed the optimism for homebuying as much; 31 percent of the consumers who responded to the poll believed that now is a good time to buy a home, sharply higher than last year, when 22 percent said it was a good time to buy a home.”
In March, 28% of consumers thought it was a good time to buy. These consumers are getting a bit more optimistic even as prices remain high and economic conditions worsen. This behavior provides some color on the behavior of the stocks of home builders. However, I cannot imagine this nascent optimism continuing to diverge from sellers if economic conditions fail to experience a dramatic turn-around.
New Residential Sales (Single-Family) – April, 2020
In the last Housing Market Review, I predicted that new home sales had reached a (short-term) peak at a 13-year high in January. I could not of course anticipate the pandemic-related implosion in the housing market, but I was looking at sentiment overly stretched. March’s downwardly revised sales of new single-family homes of 619,000 (previously 627,000) was down 13.7% from February. April’s 623,000 in sales were up 0.6% from March and down 6.2% year-over-year.
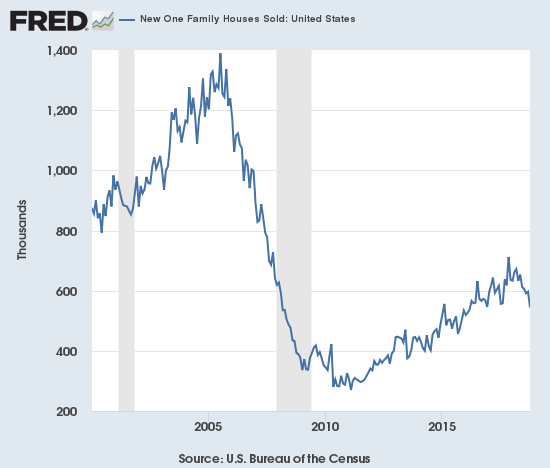
Source: US. Bureau of the Census, New One Family Houses Sold: United States [HSN1F], retrieved from FRED, Federal Reserve Bank of St. Louis, May 26, 2020.
ITB gapped higher ahead of the release of new home sales data (May 26) on a day when the stock market in general opened the week on a strong note. ITB weakened a bit but still finished the day with a 3.2% gain. ITB finished the week at that same level. The conventional financial media outlets like CNBC celebrated the news because consensus expectations pegged a 22% drop from March new home sales. The consensus was clearly not paying close attention to the earnings reports from builders.
Since hitting a peak in November and December, 2017, the median price of a new single-family home trended slightly downward largely from a ramp in entry-level and lower-priced new homes. Revisions significantly reduced February’s median from an all-time high of $345,900 all the way down to $330,100 (now revised slightly back up to $331,400). March’s median was revised up from $321,400 to $326,900. April’s $309,900 is close to the lows seen over the last two years. I expect home builders to keep driving these prices down in order to move inventory to the entry-level market which is still outpacing the rest of the market’s demand for homes.
October’s slight shift toward more expensive homes accelerated in November, but the shift was mixed in December and January (revised). In February, the mid tier of $200,000 to $299,999 fell back to a 10-month low. In March the share of that tier rebounded to the multi-year highs seen last summer. In April, the share downshifted even further to solidly favor homes sold for under $200K. I expect new home sales to hit a wall once these lower tiers of the market are satiated.
The inventory of new homes surged from 5.0 to 6.4 months of sales in March. I expected a further increase in April but demand was strong enough to push the inventory slightly down to 6.3 months of sales.
On a regional basis the West suffered the largest and most dramatic decline, even larger than February’s pullback of 17.2% and MArch’s plunge of 30.8%. The dramatic regional shifts help explain the shift in price tiers. March sales in the Northeast fell 26.5%, the Midwest gained 26.5%, the South managed a second straight month of gains with a 4.7% increase, and the West plunged 33.5%.
Home Builder Confidence: The Housing Market Index – May, 2020
Perhaps in-line with all the nascent optimism reported by home builders in earnings reports, the Housing Market Index (HMI) enjoyed a sharp rebound from April’s historic plunge. The HMI rose from 30 to 37. Sentiment still has a long way to go for a recovery and market conditions remain quite dynamic. From my last Housing Market Review (emphasis added):
“….the publicly traded builders are uniformly optimistic all things considered. They are confident in their virtual sales operations. They are reassuring about their strong financial positions. In some cases, they are pointing to ‘green shoots’ of housing demand, especially with first-time home buyers. I am looking for the HMI to improve substantially in May based on these early pandemic-impacted builder reports. Yet, I am left wondering whether it is the private builders that are most pessimistic.
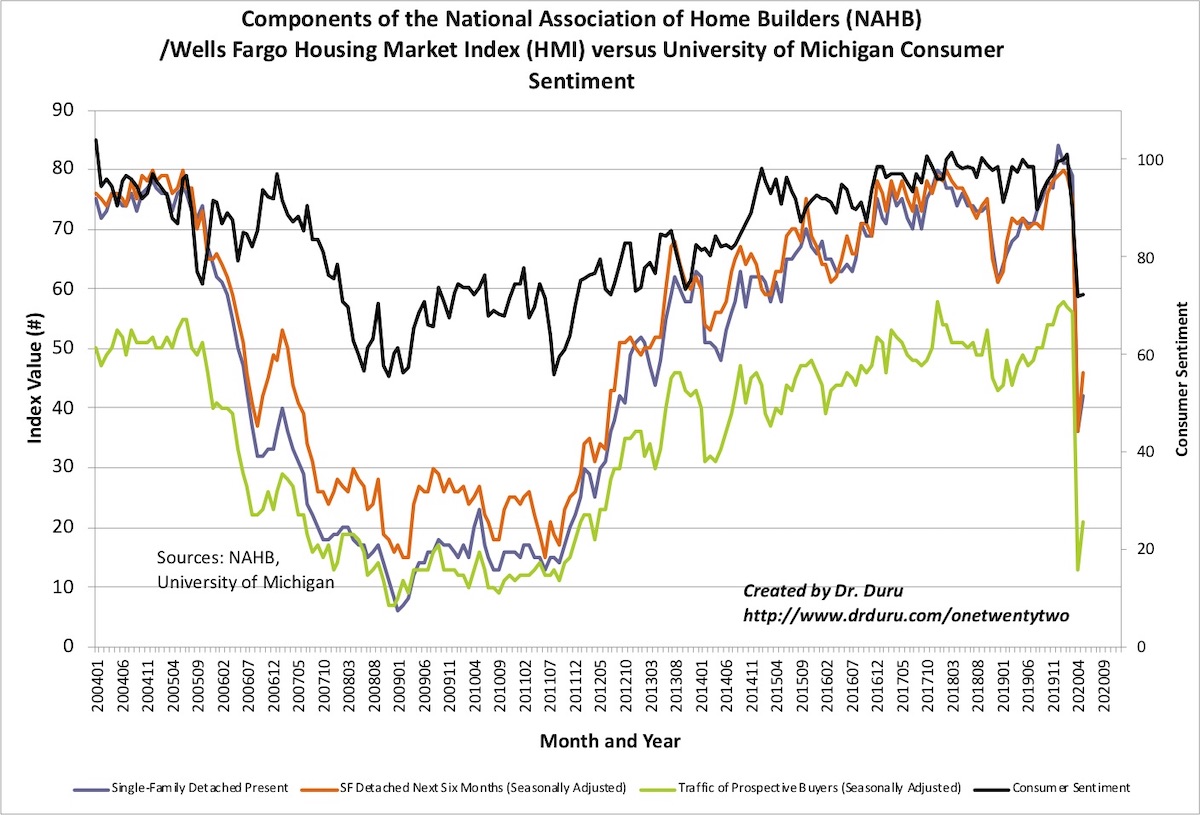
Source: NAHB
Consumer sentiment remained flat with March and did not follow home builders. Given the historic correlations, I expect builders to get slightly less optimistic in June.
On a regional basis, the Northeast actually worsened and created a point of doubt on the sustainability of this rebound in the HMI. The Northeast dropped from 19 to 17, a fresh 8 1/2-year low; Midwest up to 32 from 25; the South up to 42 from 34; and the West up to 44 from 32. The large jump in the West is particularly notable given the particularly poor performance in sales in California and the rest of the West region combined with the plunge in housing starts in April.
Home closing thoughts
Mortgage Constraints
The contraction in mortgage availability continues. So while mortgage applications are on a multi-week rebound, this trend cannot long sustain itself. The Mortgage Credit Availability Index fell from 152.1 in March to to 133.5 in April, now a 5 1/5 year low.

Pending Home Sales
I typically do not pay much attention to pending home sales. The housing market had been stable enough that pending home sales provided no extra insight to the soup of metrics I already follow. With the housing market so dynamic, pending home sales become a lot more interesting to me… and to investors.
On May 28th, the NAR reported pending home sales that greatly disappointed the stock market even though the NAR expected “April’s pending home sales to be the lowest point for the year, and the month of May to, therefore, be the lowest point for closed sales.” April’s pending home sales index fell 21.8% while contract signings fell 33.8% year-over-year. The latest data from Redfin shows that pending home sales hit a low in April and rose throughout May. However, pending home sales in the latest week available remain down 24.2% year-over-year.
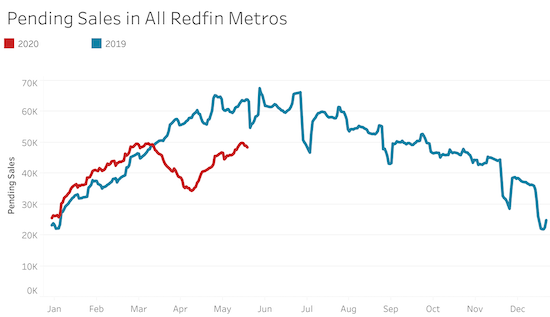
Source: Redfin
While the uptrend is encouraging, pending home sales are now bumping against a seasonal peak. The line from 2019 shows pending sales are downhill from here for the rest of the year. Pending sales are also at the pre-pandemic peak. So in order for pending sales to beat the seasonal trend, the market has to continue making up for lost time. A final peak for the year will all but ensure a peak for the 2020 housing market and for the stocks for home builders. I will at that point return to my typical preparations for the seasonal trade in home builders.
Be careful out there!
Full disclosure: long ITB shares, long MTH shares and short a call option, long TOL shares and short a call option