
Stock Market Statistics
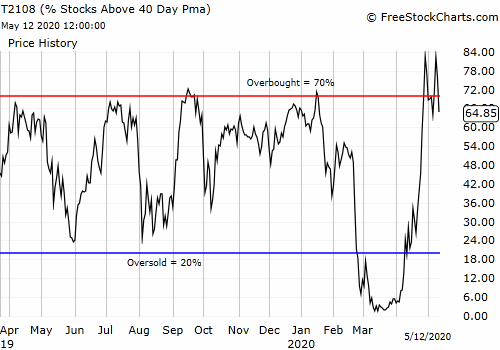
AT40 = 64.9% of stocks are trading above their respective 40-day moving averages (DMAs) (ending 3-day overbought period)
AT200 = 15.4% of stocks are trading above their respective 200DMAs
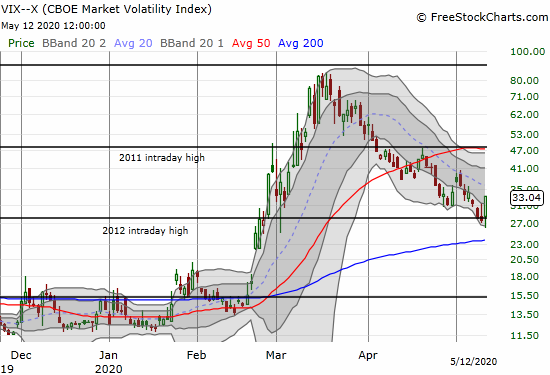
VIX = 33.0
Short-term Trading Call: neutral
Stock Market Commentary
Winners and losers are still becoming ever more distinct in the stock market, but today stock market bears drew a relatively firm line in the sand. The price action appeared to carve out a lasting top that will at least force the market to rest even if it survives a retest of critical support levels. Just three days after launching deeply into overbought territory, the stock market plunged right out of overbought conditions again. The drop was well in-synch with the major indices and has all the markings of a short-term top in the stock market.
The Stock Market Indices
The S&P 500 (SPY) looked like it was on the edge of a major upward push. Instead, the index fell well short of overhead resistance from the 200-day moving average (DMA). Today’s 2.1% loss puts both the 20 and 50DMAs into play given the S&P 500 topped out right at the April high. The index now has a double top that is doubly troublesome given its proximity to 200DMA resistance.

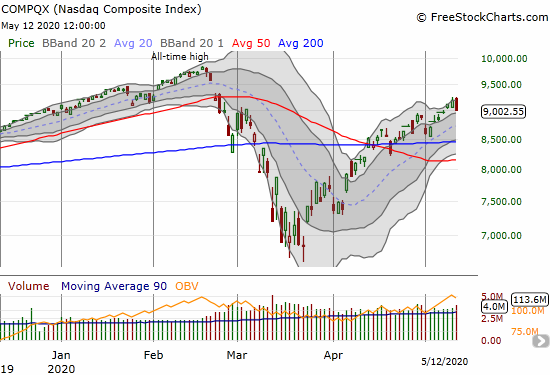
The NASDAQ (COMPQX) lost the same percentage as the S&P 500 but may have formed an even more ominous topping pattern. On Monday the tech-laden index rallied right to the point where it broke 50DMA support in February. Today’s loss formed a bearish engulfing pattern right at key resistance. This is the NASDAQ’s version of double trouble even as it remains well within the upper Bollinger Band (BB).
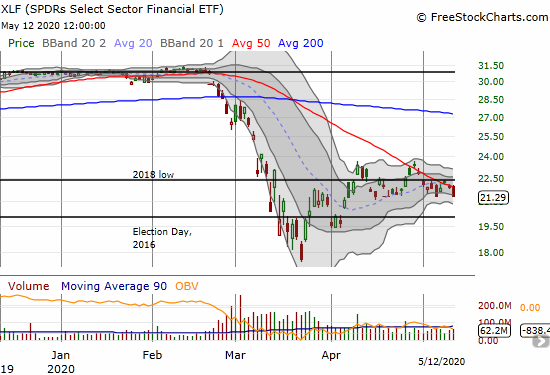
Financials continue to lag. The SPDRS Select Sector Financial ETF (XLF) lost 2.6% on yet another failure at declining 50DMA resistance. XLF closed right at critical support. If this support cracks, XLF should quickly retest its closing price on Election Day 2016. Financials by themselves are undermining the general health of the stock market.
Volatility
The volatility index (VIX) had a wake-up call. The fear gauge bounced off its 2012 intraday high. Bears cannot quite celebrate success as the VIX remains well within a downtrend defined by the 20DMA. Still this move likely keeps volatility at elevated (above 20) levels for many more days, likely weeks, to come.
The Short-Term Trading Call
AT40 (T2108), the percentage of stocks trading above their respective 40DMAs, fell from overbought conditions for the second time in a week.
A fall from overbought conditions is bearish enough. Two drops so close to each other really rings my alarm bells. The topping price action in the S&P 500 and the NASDAQ, combined with tepid financials, and a re-awakened VIX, all converge with the bearish action from AT40 to convince me the odds of a short-term top are now very high. I expect the bears to win this battle to hold a line in the sand.
Still, I am keeping the short-term trading call as the major indices remain well above critical 50DMA support levels. While I am not chasing shorting opportunities, I am definitely a lot less eager to buy dips for now. This topping pattern probably just ruined my neat trade on Tesla (TSLA); it was working out quite well until the sellers lit up their engines going into the close.
Stock Chart Reviews – Below the 50DMA
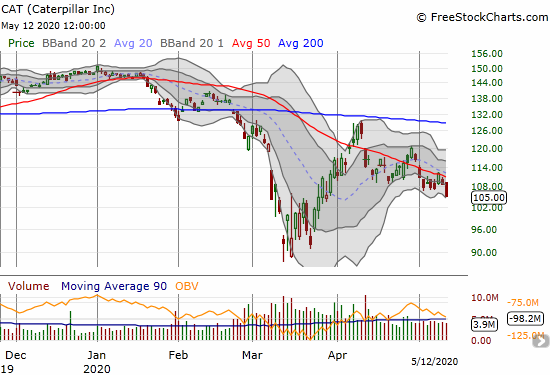
Caterpillar (CAT)
I went after Caterpillar (CAT) with put options on Friday as my typical hedge against bullish positions. I was tempted to take profits on this latest confirmation of resistance. Instead, I decided to wait for one more day as the selling looked strong enough to take CAT down a lot more.
Stock Chart Reviews – Above the 50DMA
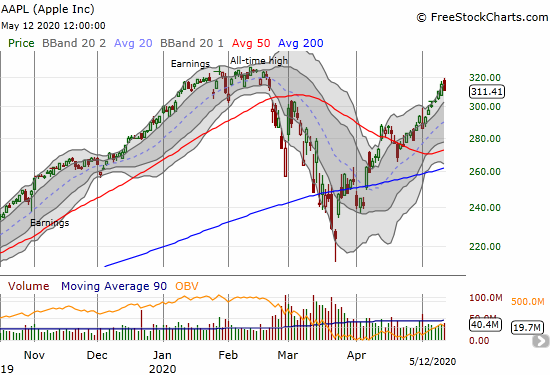
Apple (AAPL)
Apple (AAPL) has come a long way since the market “lost it” on a bearish 200DMA breakdown. Now almost 50% later, AAPL added its own confirmation of the line in the sand drawn by the bears. After streaking nearly straight up since its last 50DMA breakout, AAPL stopped cold right under its all-time high. This is a near perfect setup for bears playing a top in the market as AAPL offers a tight stop-loss above its all-time high…not to mention the stock is in need of a series rest after such a relentless rise.
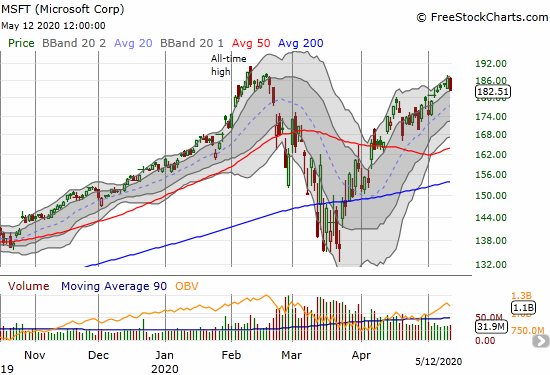
Microsoft (MSFT)
During the market crash and the rebound from the March lows, I crowned Microsoft (MSFT) as more important as a market tell than Apple. So I find it ironic that MSFT apparently topped out in similar fashion to AAPL. MSFT stopped just short of its all-time high as it retreated from the line in the sand drawn by the bears.
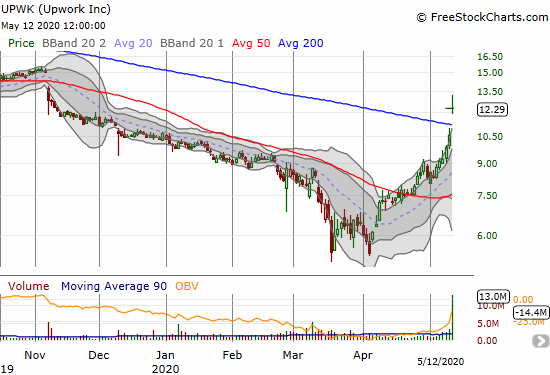
Upwork (UPWK)
I could not find any news to explain the surge in Upwork (UPWK). The company reported earnings on May 6th and rallied into and after that date. The company connects freelancers to potential gigs and perhaps investors are awakening to the possibility of this labor model becoming more popular and critical in the post-coronavirus economy.
Regardless, today’s 16.9% gain and 200DMA breakout is bullish even as it forms a kind of parabolic move. I fully expect a test of 200DMA support in the coming days or more as the stock works off extremely extended trading conditions. I hope market conditions at the time “allow” me to scoop up some shares as I continue to shop for longer-term plays on the new economy.
— – —
FOLLOW Dr. Duru’s commentary on financial markets via email, StockTwits, Twitter, and even Instagram!
“Above the 40” uses the percentage of stocks trading above their respective 40-day moving averages (DMAs) to assess the technical health of the stock market and to identify extremes in market sentiment that are likely to reverse. Abbreviated as AT40, Above the 40 is an alternative label for “T2108” which was created by Worden. Learn more about T2108 on my T2108 Resource Page. AT200, or T2107, measures the percentage of stocks trading above their respective 200DMAs.
Active AT40 (T2108) periods: Day #21 over 20%, Day #15 over 30%, Day #13 over 40%, Day #12 over 50%, Day #11 over 60%, Day #1 under 70% (underperiod ending 3 days overbought)
Daily AT40 (T2108)
")
Black line: AT40 (T2108) (% measured on the right)
Red line: Overbought threshold (70%); Blue line: Oversold threshold (20%)
Weekly AT40 (T2108)

*All charts created using FreeStockCharts unless otherwise stated
The T2108 charts above are my LATEST updates independent of the date of this given AT40 post. For my latest AT40 post click here.
Be careful out there!
Full disclosure: long SSO shares, long CAT puts, long AAPL put, short TSLA shares and long TSLA call spread and calendar call spread
*Charting notes: FreeStockCharts stock prices are not adjusted for dividends. TradingView.com charts for currencies use Tokyo time as the start of the forex trading day. FreeStockCharts currency charts are based on Eastern U.S. time to define the trading day.