
Housing Market Intro/Summary
In the January Housing Market Review, I described a pause in the bad housing data long enough to allow the stocks of home builders to rally sharply with the stock market. The iShares US Home Construction ETF (ITB) was testing resistance at its 200-day moving average (DMA); that moment turned out to be the beginning of a peaking process for the index. The index suffered a 50DMA breakdown that confirmed the overhead resistance from its 200DMA. A deeply dovish statement on monetary policy from the Federal Reserve attracted enough buyers to rally ITB off its lows. Declining mortgage rates helped boost the rally while a recent bounce in bond yields has not yet cooled enthusiasm. The buying push was strong enough to generate a fresh 200DMA breakout that, as of now, has turned into a surprising 6+ month high and confirmed breakout.
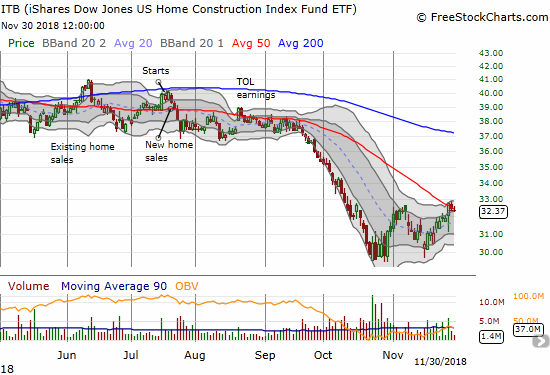
This breakout marks an important shift in the price action for home builders. The price action is stretching ahead of the existing data; I interpret this action to mean that sentiment is improving and giving the benefit of the doubt to the outlook for the sector. The price action could stay decoupled from the data as long as mortgage rates go no higher.
Last week, I sold my ITB call options for a small profit as the index challenged its last high. It was a profit that was not commensurate with the amount of risk I took in buying and accumulating these options over many months. Regardless, that sale brought an official end to my seasonal trade on home builders. Until the season begins again around October, I will only make moves in very special, case-by-case situations with an eye toward evidence that what looked like a peaking recovery has developed some sustained momentum. My threshold will be relatively high given I remain bearish on the overall stock market for now.
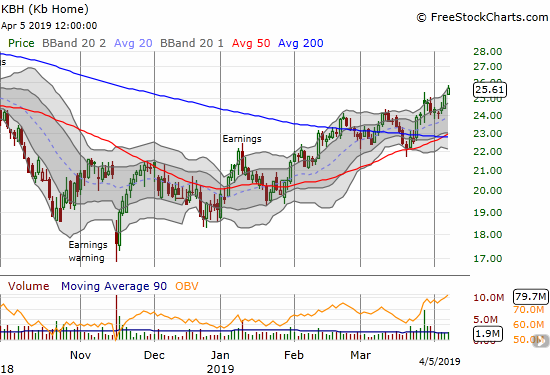
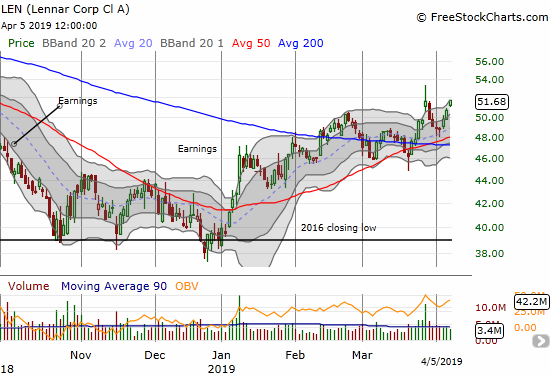
Two special cases are Lennar (LEN) and KB Home (KBH) which both reported earnings last week. Both stocks showed initial gains only to quickly lose them in subsequent days. Suddenly, both stocks have firmed up and KBH even trades now at a 6+ month high alongside ITB. LEN is right behind. If even LEN breaks out, I will likely return to LEN with call options expiring just ahead the next earnings event (presumably in late June).
Source for charts: FreeStockCharts.com
New Residential Construction (Single-Family Housing Starts) – February, 2019
From July to October, 2018 housing starts seemed to stabilize after a period of decline. Plunges in November and December confirmed that housing starts topped out. A January surge delivered fresh prospects of a rebound. Another plunge in February brought January’s hopes to a quick end.
Single-family housing starts for January were revised significantly upward from the already high level of 926,000 to 970,000. February starts plunged month-over-month by 17.0% to 805,000. On an annual basis, single-family housing starts decreased by 10.6%, essentially reversing the entire (short) rebound from November. The recovery in starts came on the heels of a decline that was steep enough to cause grave concerns about the health of the housing market. This new plunge should rev up those concerns all over again, recent price action in related stocks notwithstanding. The earlier decline was the worst drop since starts were regularly dropping double-digit percentages in 2011. Now, some form of stabilization became a bit more precarious.
Last June’s year-over-year decline was the first for housing starts since August, 2016, and June’s level sat as the lowest of the year until the October to December plunge. The market has transitioned from a slow motion breakdown to a break neck breakdown and perhaps to a volatile breakdown.
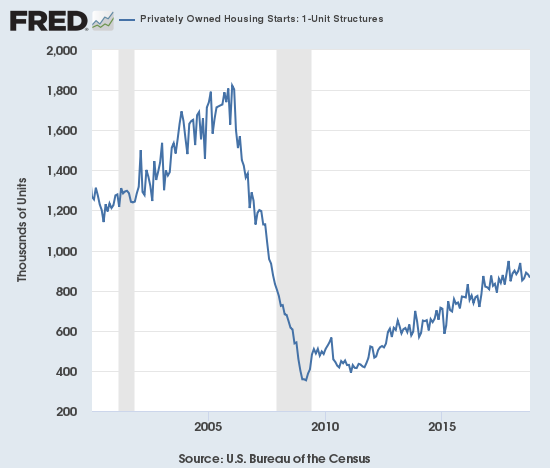
Source: US. Bureau of the Census, Privately Owned Housing Starts: 1-Unit Structures [HOUST1F], retrieved from FRED, Federal Reserve Bank of St. Louis, March 28, 2019.
When overall housing starts plunged in November, three of the four regions experienced sharp declines led by the West. For December, the West and Midwest were the two declining regions both with exceptionally large changes. In the last Housing Market Review I concluded that the wide range in regional changes in January suggested that January’s surge was not likely sustainable; that projection panned out more spectacularly than I could have expected. The on-going decline in the West continues to be particularly concerning; February’s decline took housing starts in the West back to November levels which in turn were the lowest since June, 2016. The Northeast, Midwest, South, and West each changed -27.7%, 0.9%, 0.4%, and -32.0% respectively. The Northeast was likely hurt by severe Winter weather, but then I am surprised the Midwest did not fare worse than it did.
The bump up in last July’s housing starts was less impressive than it appeared given it was mainly driven by the Midwest. For August, only a second month of gains for the West prevented housing starts from looking worse. In September, the regions delivered solid performances outside of the Northeast. The West out-performed for two months with double-digit year-over-year gains and helped prevent the overall starts numbers from looking worse. The West has become the market’s leading red/yellow flag.
Existing Home Sales – February, 2019
The monthly downtrend for existing home sales came to a resounding end in February although year-over-year declines are still in place for the 12th straight month. The National Association of Realtors (NAR) has swung from from a premature celebration of a stabilization of sales in August to today’s cautious and tentative optimism over the one-month rebound in sales. For January’s declines, the NAR did more projecting than usual in claiming that the down cycle had come to an end. At the time, I noted that nothing in the existing home sales data confirmed such an end but certainly February’s abrupt surge suddenly makes the NAR’s expectations for a bottoming much more convincing.
The seasonally adjusted annualized sales in February of 5.51M were up 1.8% month-over-month from the slightly downwardly revised 4.93M in sales for January. Year-over-year sales decreased 1.8%. The monthly gain was the largest such gain since December, 2015. In January, existing home sales were at their lowest level since November, 2015. This high amount of volatility makes expectations even more uncertain than usual.

Source for chart: National Association of Realtors, Existing Home Sales© [EXHOSLUSM495S], retrieved from FRED, Federal Reserve Bank of St. Louis, April 4, 2019.
With sales mostly in decline for so long, the NAR’s typical narrative took shifted in February. In the November report the NAR strained to paint a story of increasing demand. The NAR used the monthly gain in sales to celebrate: “After six consecutive months of decline, buyers are finally stepping back into the housing market…” With buyers still stepping away from the market, the NAR in February reached for a market bottom (emphasis mine): “Existing home sales in January were weak compared to historical norms; however, they are likely to have reached a cyclical low. Moderating home prices combined with gains in household income will boost housing affordability, bringing more buyers to the market in the coming months…Lower mortgage rates from December 2018 had little impact on January sales, however, the lower rates will inevitably lead to more home sales.” I countered that substantial year-over-year declines still indicated that the more meaningful trend remained downward. Now it does indeed appear that a bottom in the cycle has occurred. Year-over-year gains need to confirm that bottom.
The NAR’s explanation for the sudden jump in sales was not quite complete: “A powerful combination of lower mortgage rates, more inventory, rising income and higher consumer confidence is driving the sales rebound.” After all, consumer confidence was high throughout the monthly declines and “rebounded” from already very high levels. Moreover, inventory is up on an absolute basis and barely up on a sales basis. Year-over-year, inventory declined again – see below. I strongly suspect that buyers were primarily motivated by lower mortgage rates and a lot of future demand materialized early.
The NAR continues to point to rising inventories as a positive sign. In the November report, the NAR noted that “increasing housing inventory has brought more buyers to the market.” For December, the NAR declared: “Several consecutive months of rising inventory is a positive development for consumers and could lead to slower home price appreciation.” For January, the NAR spun the shift of market power to buyers as a positive: “Decelerated sales and the increases in inventory will work in favor of potential homebuyers, putting them in a better negotiating position heading into the spring months.” Yet, median prices continue to go up. The inventory picture is very mixed. Absolute levels are up from a year ago but are also down on a month-of-sales basis.
Absolute inventory levels increased from 1.58M a year prior to 1.63M in February. On a basis of months of supply, inventory changes were mixed: “Unsold inventory is at a 3.5-month supply at the current sales pace, down from 3.9 months in January but up from 3.4 months in February 2018.”
In November, the NAR observed that “as more inventory enters the market and we head into the winter season, home price growth has begun to slow more meaningfully…This allows for much more manageable, less frenzied buying conditions.” This description was a good positive spin on slowing price growth although prices are not slowing as much as I would expect in this kind of slowing market. The sudden jump in sales might firm up pricing. While the median price of an existing home stayed effectively flat with January, annual prices continued their ascent with a 3.6% year-over-year increase – above January’s 2.8% year-over-year gain (which was the slowest price growth since February, 2012) and the 84th straight annual increase.
The share of sales going to first-time buyers bounced back from January’s decline. For February, the share returned to 32% from 29% in January (32% in December) and January of last year. This rebound of first-timers further solidifies my opinion that February’s surge is mainly a result of buyers eager to take advantage of lower mortgage rates. The average share for first-time homebuyers for 2016 was 35%. The NAR’s 2017 Profile of Home Buyers and Sellers reported an average of 34% for 2017 and 33% for 2018.
Investors purchased 16% of homes in February, flat with January but down from 17% the year prior. Investor sales averaged a share of 15% in 2017 and 14% in 2016.
February just barely ended a 4-month streak of annual declines across all four regions. In particular, the West suffered an eighth consecutive month in the red. These regional sales changes alone explain the NAR’s caution about February’s monthly surge. Here are the regional numbers with January, December, November, October and September’s year-over-year changes in parentheses respectively listed for comparison (any revisions are not included): Northeast +1.5% (-1.4%, -6.8%, -2.6%, -6.8%, -5.6%), Midwest 0% (-7.9%, -10.5%, -4.3%, -3.1, -1.5%), South -0.4% (-8.4%, -8.7%, -5.6%, -2.3%, -0.5%), West -7.9%, (-13.8%, -15.0%, -15.4%, -11.2%, -12.2%). As usual, regional sale fluctuations had little to no relationship to the on-going price run-ups. The year-over-year price changes for December were surprisingly high given the sales declines but “moderation” finally arrived for January. February picked the pace back up. (January, December, November, October, September in parentheses without accounting for revisions): Northeast 3.8%, (0.4%, 8.2%, 6.5%, 3.0%, 4.1%), Midwest 5.4%, (1.4%, 0.0%, 2.6%, 2.4%, 1.9%), South 2.5% (2.5%, 2.5%, 3.2%, 3.8%, 3.0%), West 3.0% (2.9%, 0.2%, 1.8%, 1.9%, 4.1%).
Single-family sales jumped 13.3% from January and decreased on a yearly basis by 1.4%. The median price of $251,400 was up 3.6% year-over-year.
California Existing Home Sales – February, 2019
According to the California Association of Realtors, sales of existing homes in California hit a 10-year low in January. February’s month-over-month comeback of an 11.8% gain was enough to print a 6-month high and the biggest monthly gain since January, 2011. Still, annual sales were down 5.6% although this was the smallest annual decline since July, 2018. Annual sales dropped in all major regions. Price growth flattened out starting in 2014 but over the past year it has declined.
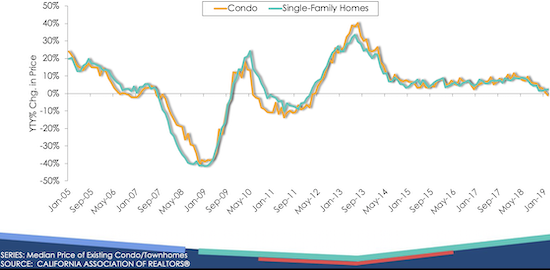
Source: California Association of Realtors (CAR)
New Residential Sales (Single-Family) – February, 2019
In a surprisingly stark contrast to existing home sales, new home sales from May to August increased in each month on a year-over-year basis. September finally unleashed a “pent-up” decline in new home sales that ended with a rebound in November and December. The fresh drop in sales in January provided another confirmation that November, 2017 should continue to stand as a substantial and sustained peak in new home sales. A new contrast has occurred with new home sales moving inversely to housing starts since November. The January surge in starts looked like a delayed reaction to the rebound in new home sales, and my prediction of a quick end to the rebound in starts came to fruition in February.
The Census Bureau revised January sales of new single-family homes upward from 607,000 to 636,000. New home sales for February increased 4.9% month-over-month and increased 0.6% year-over-year to 667,000.
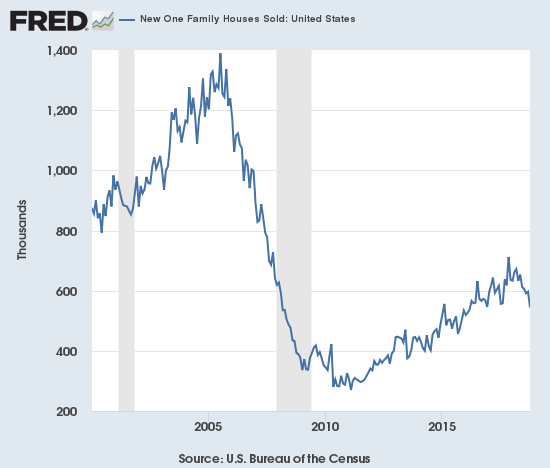
Source: US. Bureau of the Census, New One Family Houses Sold: United States [HSN1F], retrieved from FRED, Federal Reserve Bank of St. Louis, April 3, 2019.
In June, the inventory of new homes for sale jumped to 6.0 months of sales, a perfect balance. Inventory has trended upward from there. October’s inventory jumped to 7.2. After falling down for a few months, inventory bounced back to 6.6 in January. Inventory pushed back to 6.1 in February.
In November, the median sales price of a new single-family home hit its lowest level of 2018 at $308,500 (revised). Prices were last that low February, 2017 ($298,000). February’s median dropped 3.6% year-over-year to $315,300 even as the distribution of sales shifted from the middle (200-299,999) to higher-end (500-749,000) homes month-over-month.
The Northeast suffered another double-digit decline in new home sales with a 28.3% drop (extreme weather likely explains the latest drop just as for existing home sales). For the second month in a row, the South was the only region to gain in sales year-over-year. The Midwest dropped 3.8%. The South gained 6.8%. The West dropped 2.9%.
Home Builder Confidence: The Housing Market Index – March, 2019
The Housing Market Index (HMI) ended 2018 at an average 66.4, just slightly below 2017’s average of 67.8. The HMI fell off a cliff in the last two months of 2018 after finally giving in to the weight of declining components. The year 2019 has delivered relief. The HMI perked back up 2 points to 58 in January, tacked on another 4 points to 62 in February, and held at 62 for March. All the components rose in unison until March. The decline in the traffic of prospective buyers makes me assume that the HMI has topped out again. The NAHB chose not to call-out or explain this decline.
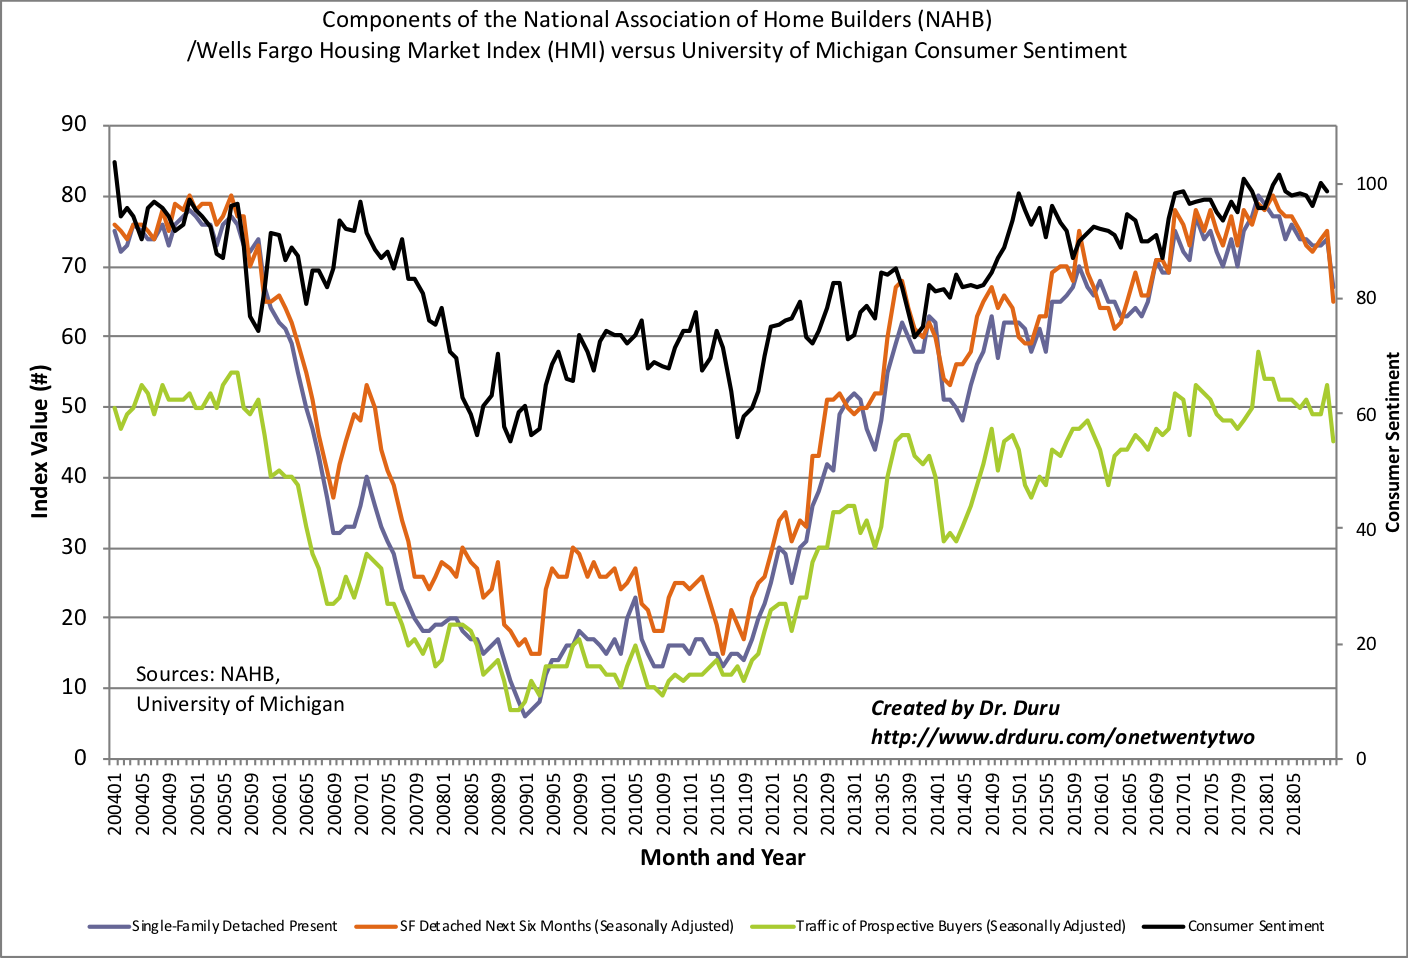
Source: NAHB
The NAHB is still looking forward to the Spring selling season: “Builders report the market is stabilizing following the slowdown at the end of 2018 and they anticipate a solid spring home buying season.” Interestingly, the NAHB also noted that lower-priced homes are selling well. That success could mean margin pressures and belies the health of housing demand.
Although the HMI is recovering, the regional story remains mixed. After all four regions ended 2018 at multi-year lows, just two regions gained in January. At the time, I concluded that it was too early to extrapolate the HMI increase to an imminent improvement in housing data; I was only partially correct. In February, again, only two regions participated. For March, 3 of 4 regions gained, but the Midwest fell back to a 4 1/2 year low, another point of caution to the sustainability of HMI’s gains this year. The Northeast leaped from 45 to 52. The Midwest dropped from 54 and back to 49 where it started 2019. The South gained from 66 to 70. The West increased from 67 to 69.
In the last Housing Market Review, I concluded that HMI was likely to flatten out quickly in coming months. March’s data suggests this estimate is coming to fruition. The stocks of home builders continue to indicate that the rebound in data has a low ceiling.
Parting thoughts
California is suffering steep declines in housing sales. Yet, in some communities sales have frozen because the housing stock is locked up in highly profitable short-term rentals. For example, KQED tracked down a story about the empty homes of Stinson Beach, located on the Marin County coast of the San Francisco Bay Area. The population of this popular tourist destination has declined as a result of rentals. Of the 1000 households between Stinson Beach and next door Bolinas Bay, 130 homes are being rented out by people who do not live in the area.
Given the wealth of the area, this shortage of housing stock looks like a “first world” problem, but the housing dynamics easily price out people who want to live and work in the area. To the south, San Francisco implemented a lot of heavy regulations that finally got enforced starting in 2018. It remains to be seen whether these laws stem the tide of expensive real estate getting transformed into short-term rentals. It is yet one more dynamic helping to drive down the affordability and availability of housing, especially in popular and densely populated areas.
Be careful out there!
Full disclosure: long KBH calls and puts