
AT40 = 31.0% of stocks are trading above their respective 40-day moving averages (DMAs) (was as low 28.1%)
AT200 = 46.7% of stocks are trading above their respective 200DMAs
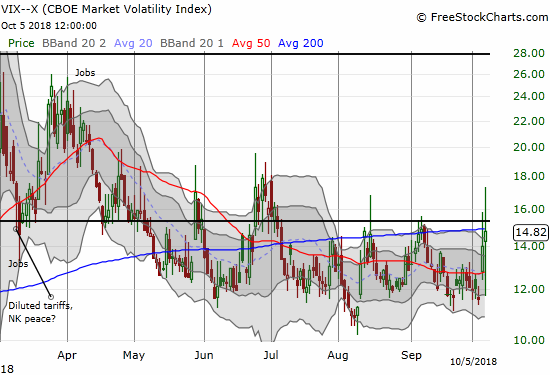
VIX = 14.0 (was as high as 15.8)
Short-term Trading Call: neutral
Commentary
So much for a small bounce before continuing a decline toward oversold conditions!
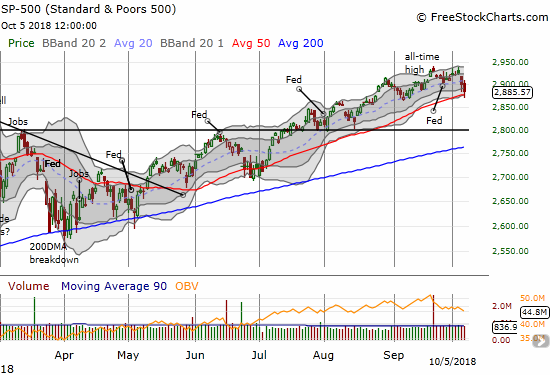
The jobs report for September seemed to be a non-event as the S&P 500 (SPY) opened slightly higher and drifted higher for the first 15 minutes of trading or so. By the second breakdown to an intraday low, it was clear that sellers were eager to hit the exits. For the S&P 500, the selling ended just below its 50-day moving average (DMA). Buyers took over from there and pulled the index back from an ominous 50DMA breakdown.
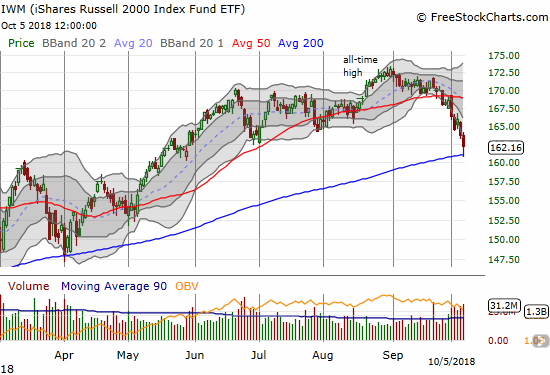
Like the S&P 500, small caps gave some faint hope of a bottom as buyers picked the iShares Russell 2000 ETF (IWM) off the very critical support of an uptrending 200DMA.
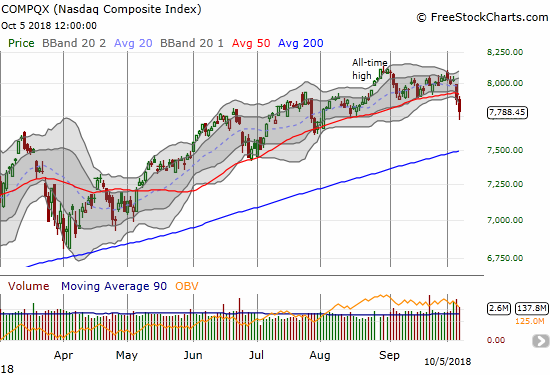
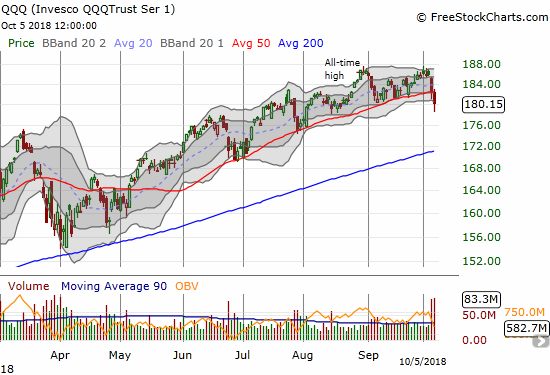
The parallel selling in the NASDAQ confirmed a 50DMA breakdown. The selling in Invesco QQQ Trust (QQQ) created the 50DMA breakdown that the tech-laden index barely avoided the previous trading day.
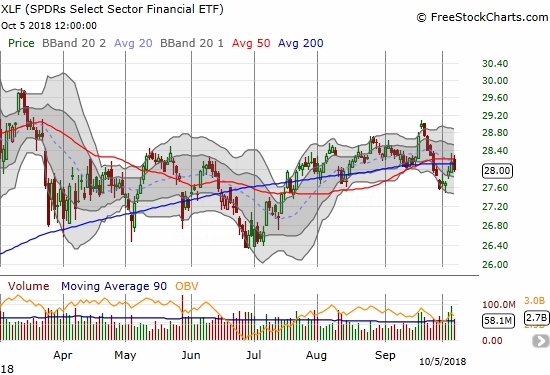
The selling even took down financials which had rallied going into Friday’s jobs report. The Financial Select Sector SPDR ETF (XLF) lost 0.4% after 50DMA resistance rejected it and sent XLF to a fresh 200DMA breakdown.
At the height of the selling, the volatility index, the VIX, soared to a 22.1% gain. This move was below the previous day’s 36.4% intraday high. The VIX closed with an even smaller gain of 4.2% as the volatility faders went into hyperdrive after buyers started defending critical technical levels on the indices. The VIX even closed below the 15.35 pivot in a demonstration of the continued stubbornness of bullish sentiment that keeps tilting toward complacency.
Wall Street's top bull @dwyer_strategy is sounding an alarm. He sees two warning signs indicating a correction is already here. pic.twitter.com/TrNEhzWibs
— CNBC's Fast Money (@CNBCFastMoney) October 4, 2018
Finally, AT40 (T2108), the percentage of stocks trading above their respective 40DMAs, dropped into the 20s for the first time in 6 months. The buying off the lows only took AT40 back to 31.0%. AT200 (T2107), the percentage of stocks trading above their respective 200DMAs, dropped to a 5-month low by closing at 46.7%. So while the shorter-term indicator is at levels that have frequently marked bottoms in this bull market, the longer-term indicator is not yet creating the kind of breakdowns that overwhelm bulls with bargain signs.
This spot is particularly tough for making a short-term trading call. I left the short-term trading call at neutral only because the risk of new short positions is pretty high at this juncture. I closed out some shorts and put positions last week even and have nothing new on my list of shorts. This is a better time to prepare to buy. In other words, I am purposely avoiding getting bearish so that I can be ready to buy the market at lower prices. Recall that October is one of the riskiest months of the year in terms of potential drawdowns. Yet, with November and December offering two of the lowest risk months of the year, October can offer some timely buy-the-dip opportunities.
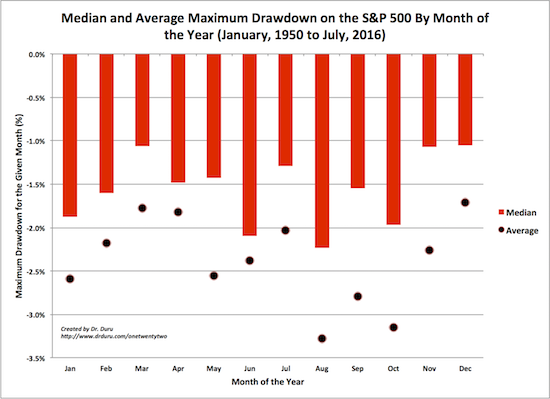
Source for data: Yahoo Finance
I am guessing that October is all the more dangerous this year given the exceptionally strong stock market performance in the third quarter (July to September). In other words, the market is “due” for more than a garden variety 1% or 2% drawdown on the S&P 500.
I think technician Carter Worth made a good case for a retest of the 2800 level on the S&P 500. See below.
After rates rocked the markets this week, Chart Master Carter Worth highlights the key levels for the S&P 500. pic.twitter.com/Dxvfa49FX9
— CNBC's Fast Money (@CNBCFastMoney) October 5, 2018
The 2800 level was important as resistance in June and then important as support from July to August. By the time the S&P 500 gets back to 2800, uptrending 200DMA support should be there to meet the index with a kiss. More importantly, AT40 should also be at or near true oversold levels (20%).
Even with this mental model, I am preparing for the possibility that last week’s selling was about as good as it well get. After all, sellers dramatically failed twice to keep the VIX elevated. If I see enough sign of buying power, small caps, IWM specifically, would be the obvious place to start under the assumption that 200DMA support is holding. A complete reversal of Friday’s losses would be a good first sign.
CHART REVIEWS
Apple (AAPL)
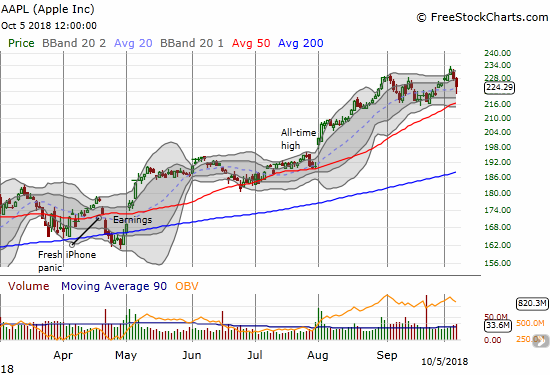
On Wednesday, AAPL broke out to a new all-time high and even closed well above its upper Bollinger Band (BB). At the time, I thought that move confirmed the market’s readiness to rip higher. The subsequent reversal could form the start of a kind of blow-off top. An AAPL at another all-time high would serve as an assurance that the sellers have once again been banished.
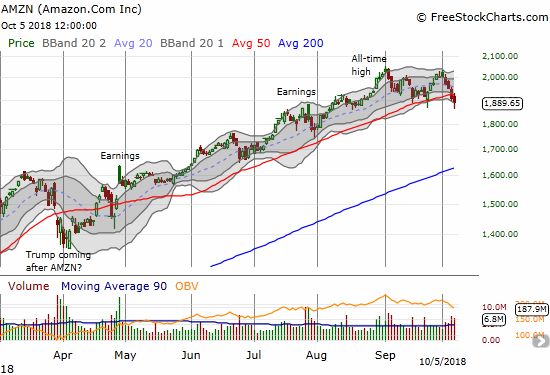
Amazon.com (AMZN)
AMZN is one of the usual suspects that looks dangerous to me. Its last rally stopped cold just under all-time highs. Unlike AAPL, AMZN has struggled to hold onto its $1 trillion market cap. Last week’s 50DMA breakdown seemed to confirm a double top. AMZN has not tested its 200DMA uptrend for an incredible 2 1/2 years. A “real” sell-off could and should force that issue.
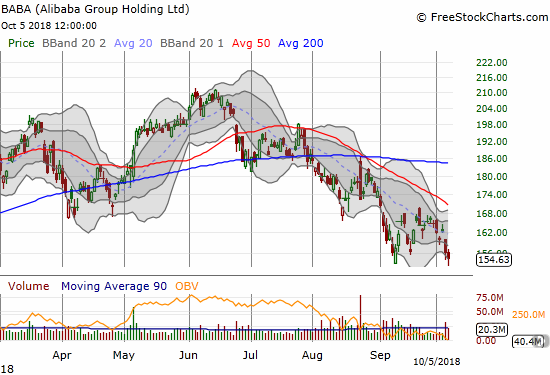
Alibaba Group Holding (BABA)
I made 2018 the year I would finally ride BABA higher into November’s Single’s Day. It looks like Chinese weakness in the face of a withering trade war with the U.S. will thwart my plans.
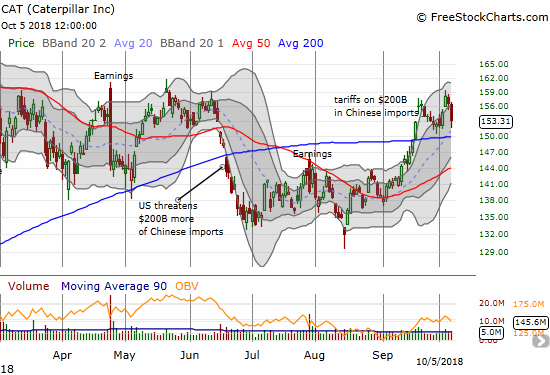
Caterpillar (CAT)
CAT is the perfect hedge on bullishness because it rallied right into resistance that has held for most of 2018. Critical 200DMA support awaits below.
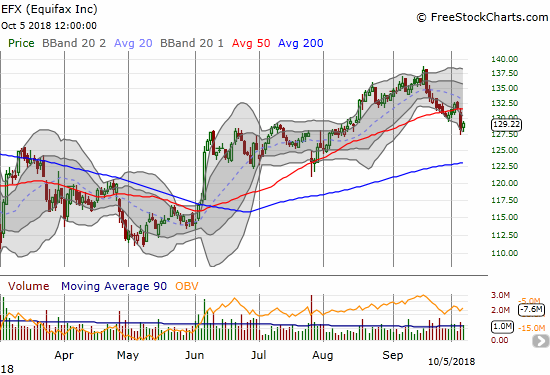
Equifax (EFX)
I just happened to check in on EFX and was blown away that the stock almost closed its gap from last year’s data breach related gap down. I do not think there was much fanfare about the milestone. I assume last week’s 50DMA breakdown ended the upward momentum to a complete gap fill for now.
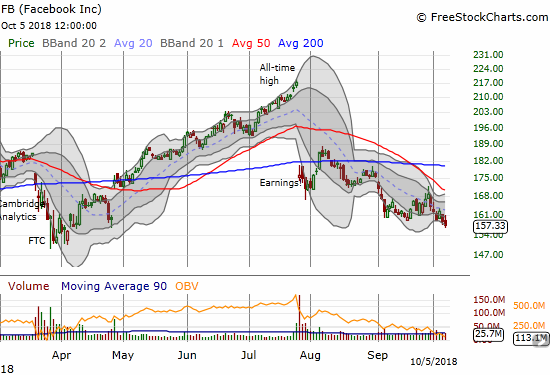
Facebook (FB)
FB’s struggles are very telling. Its under-performance among the “usual suspects” may at some point force it right out of the club.
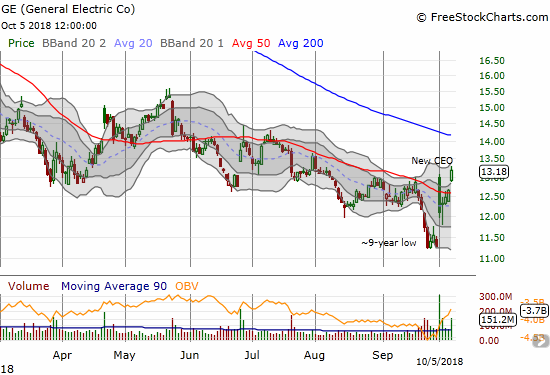
General Electric (GE)
Ironies run deep with GE. Buyers are celebrating a convincing bottoming process just at the point the general market is facing its most oversold levels in 5 to 6 months. The stock has cleared all hurdles that defined for me a confirmed bottom. From here a clear stop is a new low (below $11).
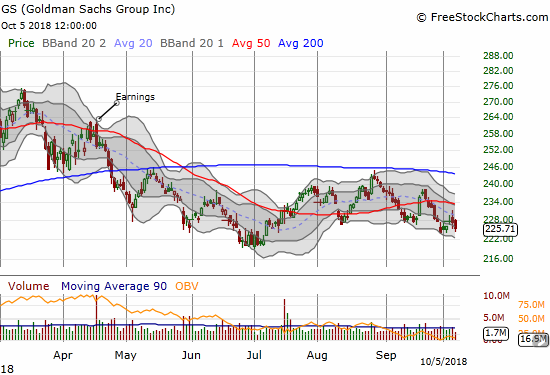
Goldman Sachs (GS)
GS is looking very shaky all over again. A test of 2018 lows seems imminent.
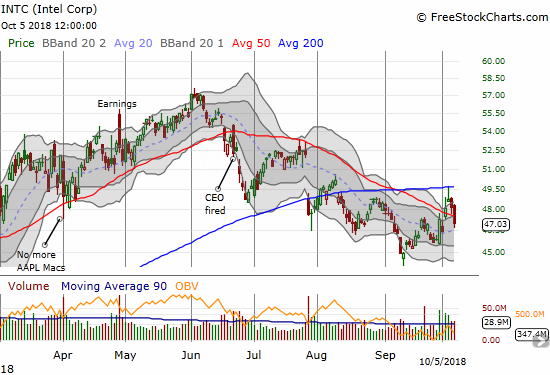
Intel (INTC)
For a few days last week my stubborn persistence on the long side with INTC looked like it would pay off well. If only general market weakness did not interrupt the festivities.
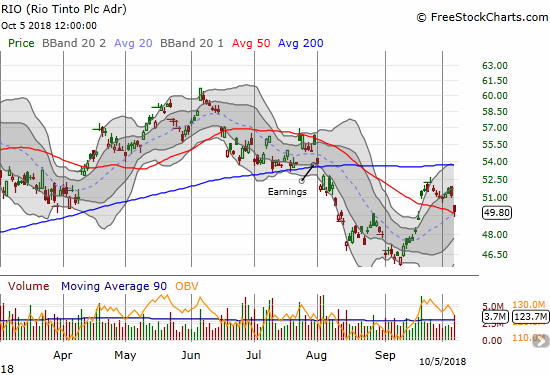
Rio Tinto (RIO)
My pairs trade short RIO versus long BHP worked out again as I chose to pass on the long side. I used Friday’s gap down to take profits on my RIO puts.
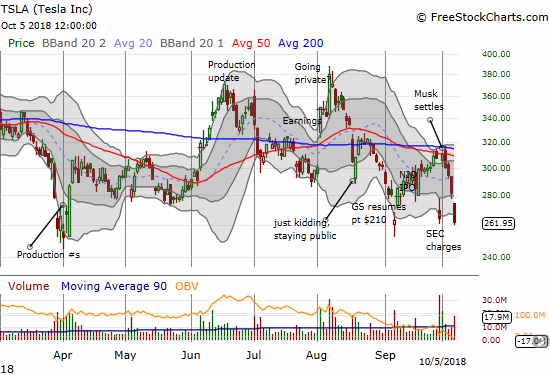
Tesla (TSLA)
Just want to that the Shortseller Enrichment Commission is doing incredible work. And the name change is so on point!
— Elon Musk (@elonmusk) October 4, 2018
I am at a loss for words at this point. There is very little that could convince me to buy shares in this company again – at least not under current management conditions. It seems CEO Elon Musk is not really taking seriously the SEC’s (Securities Exchange Commission) charges of fraud. The settlement agreement is not even legally binding yet, and he is already at work putting his position and stock at risk all over again. The market’s celebration over the settlement lasted all of one day. The selling that preceded Musk’s ill-timed tweet seemed to portend more trouble ahead. I am continuing to trade TSLA around the key technical levels that seem to draw the stock like a magnet. I thought $265 would hold on this latest round of selling though. The 2018 low at $250 still sticks out there like an untested and unrepentant price level.
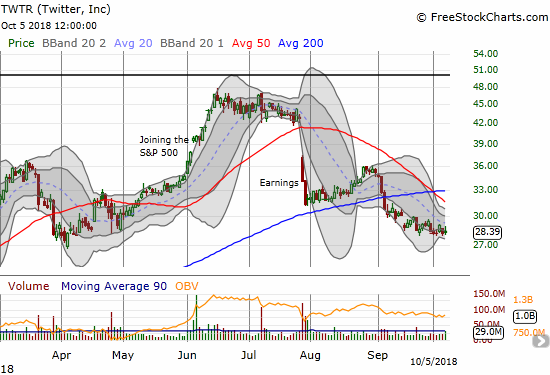
Twitter (TWTR)
I thought the current market weakness would deliver up a very good discount on Twitter shares. Nothing doing yet. I want to load up more in the low 20s.
— – —
FOLLOW Dr. Duru’s commentary on financial markets via email, StockTwits, Twitter, and even Instagram!
“Above the 40” uses the percentage of stocks trading above their respective 40-day moving averages (DMAs) to assess the technical health of the stock market and to identify extremes in market sentiment that are likely to reverse. Abbreviated as AT40, Above the 40 is an alternative label for “T2108” which was created by Worden. Learn more about T2108 on my T2108 Resource Page. AT200, or T2107, measures the percentage of stocks trading above their respective 200DMAs.
Active AT40 (T2108) periods: Day #159 over 20%, Day #128 over 30% (overperiod), Day #5 under 40% (underperiod), Day #10 under 50%, Day #26 under 60%, Day #79 under 70%
Daily AT40 (T2108)
")
Black line: AT40 (T2108) (% measured on the right)
Red line: Overbought threshold (70%); Blue line: Oversold threshold (20%)
Weekly AT40 (T2108)

*All charts created using freestockcharts.com unless otherwise stated
The charts above are my LATEST updates independent of the date of this given AT40 post. For my latest AT40 post click here.
Related links:
The AT40 (T2108) Resource Page
You can follow real-time T2108 commentary on twitter using the #T2108 or #AT40 hashtags. T2108-related trades and other trades are occasionally posted on twitter using the #120trade hashtag.
Be careful out there!
Full disclosure: long SPY calls, long GE calls, long CAT puts, long GS puts, long and short TSLA calls and puts, long AAPL calls, long BABA call spread, long INTC calls, long TWTR calls
*Charting notes: FreeStockCharts.com stock prices are not adjusted for dividends. TradingView.com charts for currencies use Tokyo time as the start of the forex trading day. FreeStockCharts.com currency charts are based on Eastern U.S. time to define the trading day.