
The last Housing Market Review covered data reported in January, 2018 for December, 2017. At the time, I described the ominous breakdown of the iShares U.S. Home Construction ETF (ITB), but I was not yet ready to connect the dots on the bearish implications. I am now.
ITB has continued its breakdown by first severely underperforming the stock market’s rally from oversold conditions and now closing at a fresh 4-month low.
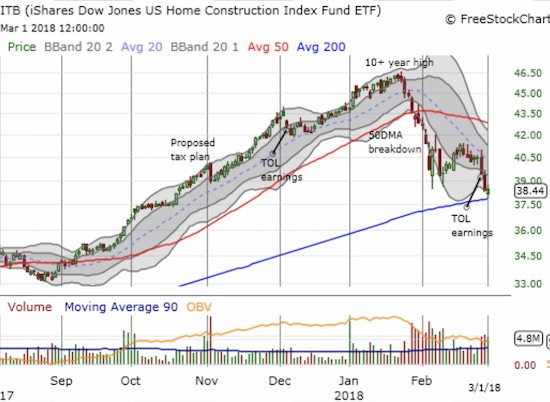
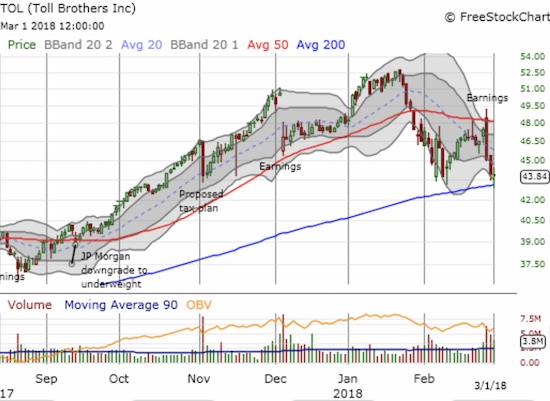
While housing-related stocks were able to power through higher rates and expectations of higher rates, investor sentiment has now turned sour. It seems investors are preparing for a much less favorable rate environment. Risk tolerances seem to be shrinking and turning against home builders. During February, several home builders reported earnings and almost none were received favorably. The most telling churn came from Toll Brothers (TOL) which rallied at first in response to its earnings report but then ended the day down 5.1%. The pattern was a double-whammy as it confirmed resistance at the 50-day moving average (DMA) and created a bearish engulfing pattern. Like ITB, TOL bounced off its 200DMA support, but I have little expectation that the selling ends here.
The housing data in February failed the cause as well. Home builder sentiment held its own. Housing starts gained but are at the bottom of the uptrend. More importantly, sales of existing and new homes faltered notably with existing home sales confirming a deceleration trend. With stocks and data waning, I am warily noting how the current heights of sentiment align with the peak of sentiment before the housing market topped during the last cycle.
This is the point where I should start planning my exit from profitable seasonal trades on home builders. Instead, most of the trades have effectively failed this time around. So I have gone from an excited expectation to a somber realization. I thought the sell-off in home builders presented me with the buying opportunity I did not think would happen this year. Now I am increasingly accepting the possibility that home builders have topped out for the year. Whether this top is THE top for the cycle depends greatly on the macro environment. If economic growth continues to print strong numbers, I think home builders will look a lot less risky. If economic growth falters, home builder stocks will surely be considered an immediate and on-going source of funds.
New Residential Construction (Housing Starts) – January, 2018
Single-family housing starts for December were revised upward from 836,000 to 846,000. January starts increased month-over-month by 3.7% to 877,000. On an annual basis, single-family housing starts increased a healthy 7.7%, representing a marked improvement from December’s 3.5% year-over-year gain.
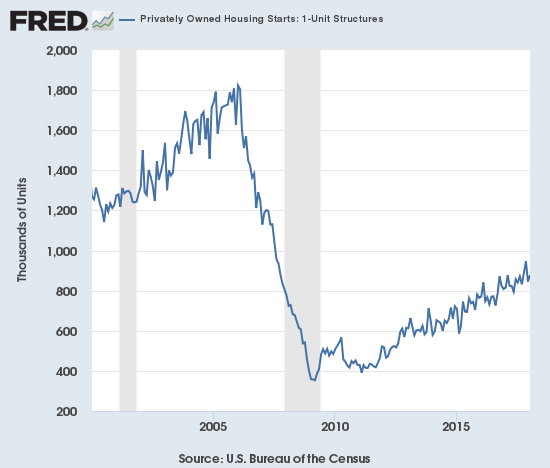
Source: US. Bureau of the Census, Privately Owned Housing Starts: 1-Unit Structures [HOUST1F], retrieved from FRED, Federal Reserve Bank of St. Louis, February 22, 2018.
Over the last five months, regional year-over-year changes in starts have exhibited wide dispersion. The Northeast, Midwest, South, and West each changed 11.9%, -12.4%, 2.0%, and 38.0% year-over-year respectively in January. The West delivered very strong growth yet again as builders are clearly in a rush to serve a thirsting market. I believe this is by far the largest year-over-year gain in housing starts for the West in a very long time.
Existing Home Sales – January, 2018
The existing home sales numbers for January, 2018 had a tough comparison given a year ago sales hit a post-recession high (slightly surpassed in 2017 by March and December sales). Moreover, the month-over-month decline in December closed out the year on a downer and put pressure on the January number to nullify some of the negativity. January failed to deliver relief on the message.
The routine description for existing sales is usually sales decline because of a shortage of inventory and sales increase in spite of inventory shortages. For November, the NAR delivered a twist by distinguishing between the upper-end and the rest of the market to help explain how sales can surge despite the parallel relentless increase in prices. The NAR closed out the year observing that sales could have been better if prices were not so high and inventory more available. To describe the dynamics behind January’s sales decline, the NAR referenced both the lack of inventory and the affordability problem caused by the scarcity.
“The utter lack of sufficient housing supply and its influence on higher home prices muted overall sales activity in much of the U.S. last month…Another month of solid price gains underlines this ongoing trend of strong demand and weak supply. The underproduction of single-family homes over the last decade has played a predominant role in the current inventory crisis that is weighing on affordability…
It’s very clear that too many markets right now are becoming less affordable and desperately need more new listings to calm the speedy price growth.”
During the press conference, the NAR further highlighted the point by contrasting over 5 years the 41% increase in the median price versus the 12% increase in wages.
Strangely enough, the NAR pointed to January’s jump in new home construction and high confidence among home builders as potential positives on the horizon. As the data above show, the absolute value of starts is still at the bottom of the current range of the uptrend. If January’s increase in starts shows promise, there were several months in 2017 that should have drawn outright excitement. Yet, this is the first time in at least recent reports where the NAR looked upon the activity in home construction with such optimism. Similarly, builder optimism was very high through most of 2017 and should have already provided hope for the NAR.
“…there’s hope that the tide is finally turning. There was a nice jump in new home construction in January and homebuilder confidence is high. These two factors will hopefully lay the foundation for the building industry to meaningfully ramp up production as this year progresses.”
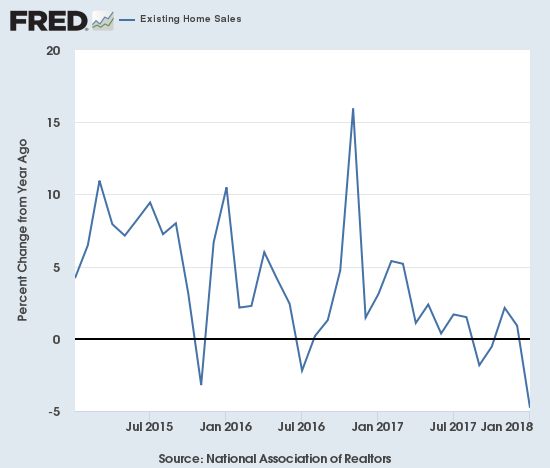
For January 2017, existing home sales rose to levels not seen since February, 2007. In February 2017, existing home sales dropped sharply and then rebounded sharply in March to a new post-recession high. Sales declined through the summer and convinced me that the top was in for the year. November proved me wrong with existing home sales climbing to a new 11-year high. For December, existing home sales declined off that high. The continued decline in December makes the spike in November almost look like an anomaly.
The seasonally adjusted annualized sales of 5.38M were down 3.2% month-over-month from 5.56M in sales for December (revised marginally down from 5.57M). Year-over-year sales decreased 4.8% which plunged the existing home sales back into the deceleration that was in place from April through October, 2017 and may have started from March, 2015 with a trend of lower highs.
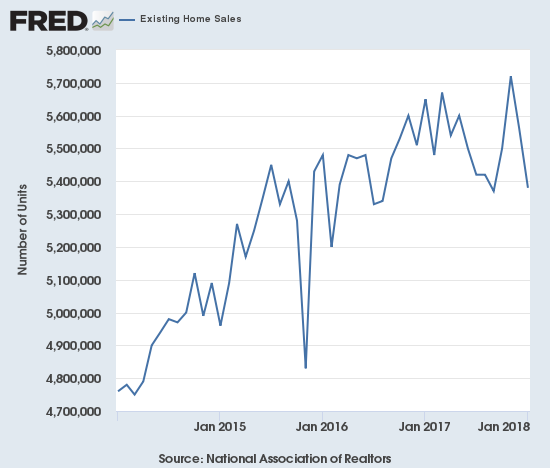
(recall that the NAR no longer makes data available before 2013. For more historical data to 1999 click here)
Source for charts: National Association of Realtors, Existing Home Sales© [EXHOSLUSM495S], retrieved from FRED, Federal Reserve Bank of St. Louis, February 24, 2018.
The share of sales going to first-time buyers dropped back to 29% from 32% in December. This share was also 29% in November and was 33% a year ago. Recall that September was the first time in two years where the share dropped below 30%. So perhaps the NAR’s claim two reports ago that investors are starting to crowd out first-time homebuyers has some credence after all. Recall what the NAR said in the previous report about the prospects for first-timers:
“Rising wages and the expanding economy should lay the foundation for 2018 being the turning point towards an uptick in sales to first-time buyers…However, if inventory conditions fail to improve, higher mortgage rates and prices will further eat into affordability and prevent many renters from becoming homeowners.”
The average share for first-time homebuyers for 2016 was 35%. The NAR’s 2017 Profile of Home Buyers and Sellers reported an average of 34% for 2017. Investors purchased 17% of homes in January. Investor sales averaged a share of 15% in 2017 and 14% in 2016.
The absolute level of inventory of existing homes fell year-over-year for the 32nd straight month. Inventory increased from December to January by 4.1%, but during its press conference the NAR noted inventory “always” increases after the holidays. Recall that during its June press conference, the NAR talked about a housing crisis in supply in some housing markets. The supply crisis continues to run deep at 3.4 months of supply at the current sales rate.
The 1.52M homes for sale represented a 9.5% decrease from the previous December. The string of year-over-year declines is remarkable: for example, starting from 2016…August -10.1%, September -6.8%, October -4.3%, November -9.3%, December -6.3%, January -7.1%, February -6.4%, March -6.6%, April -9.0%, May -8.4%, June -7.1%, July -9.0, August -6.5%, September -6.4%, October -10.2%, November -9.7%, December -10.3%. These are the declines of an increasingly dysfunctional market that, as the NAR continues to imply, is driving prices to levels that will be hard to sustain without a dramatic improvement in the financial standing of potential home buyers.
“The utter lack of sufficient housing supply and its influence on higher home prices muted overall sales activity in much of the U.S. last month…
Another month of solid price gains underlines this ongoing trend of strong demand and weak supply. The underproduction of single-family homes over the last decade has played a predominant role in the current inventory crisis that is weighing on affordability…”
For January, all regions experienced year-over-year declines in existing home sales: Northeast -7.6%, Midwest -3.8%, South -1.7%, West -9.5%. As usual, regional sale fluctuations had no relationship to the on-going price run-ups; for example, the West has the largest sales decline along with the largest price hike. All regions logged substantial year-over-year jumps in their median price: Northeast 6.8%, Midwest 8.7%, South 4.3%, West 8.8%.
December’s 5.8% year-over-year increase in the overall median price of an existing home delivered the 70th consecutive month of year-over-year increases. The median price of $246,800 is slightly down from November’s $248,000. The last record median price was set in August at $253,500.
Single-family sales declined 3.8% on a monthly basis and decreased on a yearly basis by 4.8%. The median price of $241,700 was up 5.7% year-over-year.
During its press conference, the NAR noted its pleasant surprise at the apparent lack of impact of tax reform on housing sales. Demand and foot traffic remains very high, and realtors even in the Bay Area are not hearing about tax reform as a factor in buying decisions. What COULD further impact inventory is the decision by some homeowners not to list their homes because they do not want to buy their next home at a higher interest rate.
New Residential Sales – January, 2018
New single-family home sales in November essentially confirmed a tremendous resurgence in new home sales that was synchronized with a resurgence of existing home sales. Similar to existing home sales, new home sales dropped sharply from November’s high level. While year-over-year performance, and thus the uptrend, remained strong in December, January’s new home sales dropped on both a monthly and annual basis.
The Census Bureau revised December sales of new single-family homes upward from 625,000 to 643,000 (ending three consecutive months of downward revisions). New home sales for January decreased 7.8% month-over-month and declined 1.0% year-over-year to 599,000. Year-over-year gains have regularly hit double digits since 2012; November’s 26.6% jump was the highest since February, 2015 when new home sales soared 29.8% year-over-year. So January’s slight decline is notable. Moreover, the uptrend from the trough no longer looks solid. In the coming months, I will be looking for signs that new home sales have stalled out.
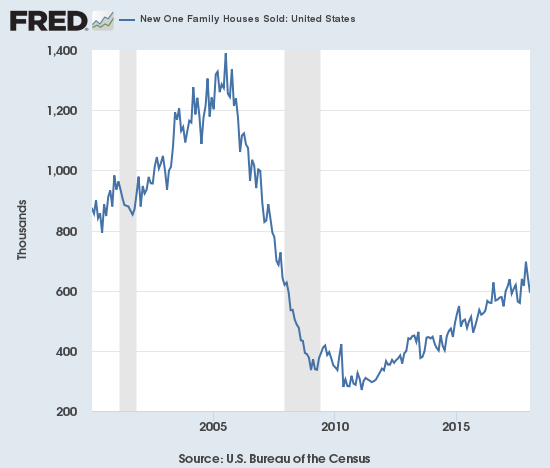
Source: US. Bureau of the Census, New One Family Houses Sold: United States [HSN1F], retrieved from FRED, Federal Reserve Bank of St. Louis, February 26, 2018.
In September, new home sales were strong enough to plunge inventory from 6.1 months of supply to 5.0 months. October’s inventory slipped slightly to 4.9 months of supply. The exceptionally strong sales volume of November pushed inventory to 4.6 months of supply. December’s pullback sent inventory jumping back to 5.7 months of supply. A market for homes is in balance at 6 months of supply, so the market’s recent unbalance came to an abrupt end in December. January’s inventory increased further to 6.1 months.
Because new home sales jumped in October, I was surprised that the median price of a new home actually fell 3.3% from September. For November, the median fell slightly from October to November’s $318,700, a 1.2% year-over-year gain. In December, the median price jumped to $335,400, a 2.4% year-over-year gain. January’s median price of $323,000 is a decline from December but still a 2.5% year-over-year gain.
On a regional basis, new home sales were extremely divergent again. After a string of very strong gains since August, the Northeast finally ran out of gas with a 44.2% year-over-year plunge. The Midwest gained 2.7%. The South dropped 10.9% year-over-year. The West took over the lead spot with a very strong 33.2% year-over-year gain.
Home Builder Confidence: The Housing Market Index– February, 2018
While housing data stalled across the board, home builders remained extremely confident. In January, the HMI dropped to 72 from 74, still higher than it was for most of 2017. The HMI remained steady at 72 in February. The NAHB expressed an enthusiasm that was very similar to January’s.
“Builders are excited about the pro-business political climate that will strengthen the housing market and support overall economic growth.”
Although HMI stayed flat, the component for the Single Family (SF) Detached Next Six Months managed to increase 2 points. At 80, this component was last this high in June, 2005. This was at the very peak of sentiment. The HMI was even 72 at this point. If the housing data fail to regain their previous momentum, I strongly suspect home builder sentiment will quickly peak around these levels again.
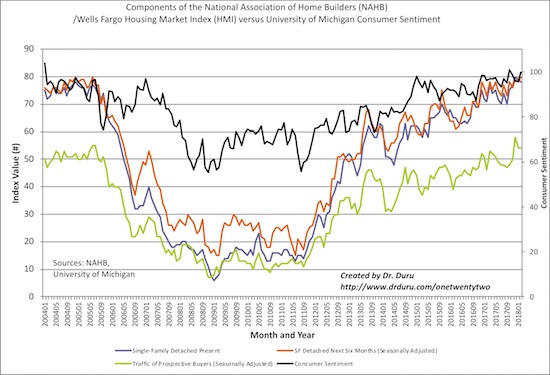
Source: NAHB
In the December Housing Market Review, I concluded from the recent history of regional HMI that a large pullback in the West would drag down the overall HMI. The West did not decline in January, but it did plunge in February…from 83 to 77. Yet, the aggregate HMI stayed flat. The December-January surge in sentiment now looks like an anomaly as the West returned to its average for 2017. The Northeast also declined (from 60 to 56). The Midwest gained from 69 to 70 while the South stayed flat at 73. It seems the South must have an outsized influence on the HMI.
Parting thoughts
I have not completely given up on making successful trades on home builders during the Spring selling season. The return of automatic skepticism has made investors turn blind to some truly good news that could lead to great trades and investments in a positive scenario.
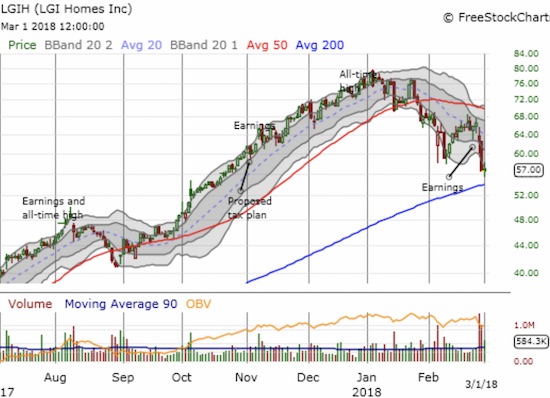
For example, LGI Homes, Inc. (LGIH) RAISED its guidance and the stock still sold off. LGIH is now down 27.6% from its all-time high just two months ago (to start the year). LGIH was of course red hot last year with a 161.2% gain, so this bad start to the year is like an overdue cooling. Valuation is also not a friend to LGIH as it is very rich compared to its peers with a 2.8 price/book ratio. Fortunately, its forward P/E is only 7.9 and price/sales is a very reasonable 1.1. I will be watching LGIH closely. I am willing to buy it on strength if it can survive the current test of its 200DMA support.
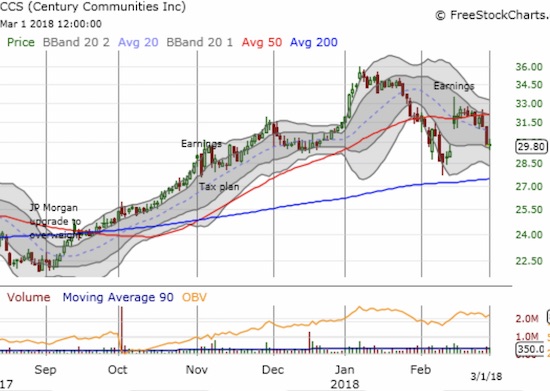
Century Communities (CCS) was one of the few home builders to get an initial positive response to earnings. Unfortunately, CCS could not generate enough momentum to avoid the recent 50DMA breakdown that managed to close the post-earnings gap. In a “worst case” scenario I can see CCS going through months of consolidation between $27 and $32.
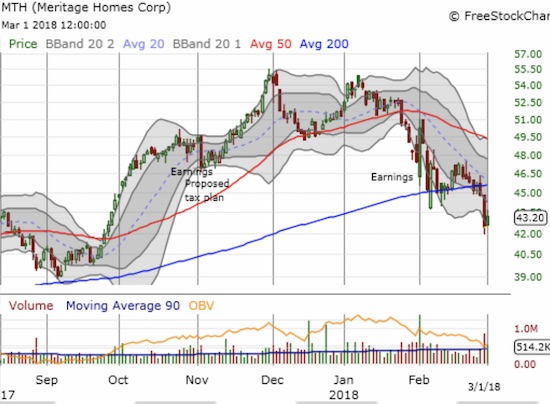
Meritage Homes (MTH) is still of interest to me. I will write about its earnings report in a future post. MTH increased its focus on first-time buyers with a late recognition of the buying potential of this segment. However, if economic growth begins to falter like the home builder stocks, MTH will find itself turning with the wind just as the wind shifts direction! Yet, I cannot resist as MTH’s valuation is amazingly attractive for a company that just reported strong financial results: forward P/E 7.6, price/sales 0.5, and price/book 1.1. The last two ratios resemble a stock mired in an economic slump!
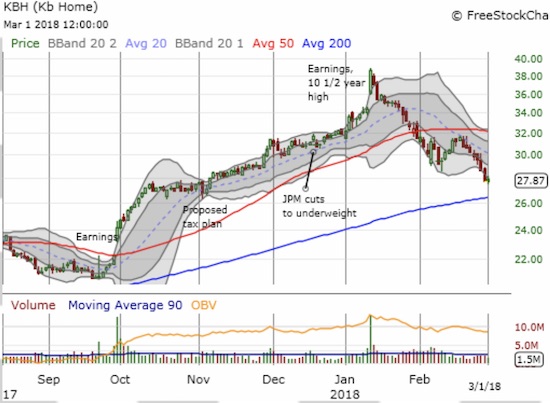
KB Home (KBH) has completely broken down from the parabolic post-earnings move in January. Sellers have barely relented along the way to a 27.8% pullback from its 10-year high. KBH confirmed 50DMA resistance with a lower low. The stock’s breakout from the first announcement of tax reform is now history. Yet, KBH had a banner 2017 with a 102.1% gain. So, like LGIH, KBH’s sharp sell-off is not yet a big deal relative to recent gains. Still, it needs to survive a potential test of 200DMA support to avoid tumbling to the next range of likely support from $22 to $24 where KBH gapped after September earnings.
Be careful out there!
Full disclosure: long TOL calls, long KBH calls, long ITB calls, long MTH shares and calls