
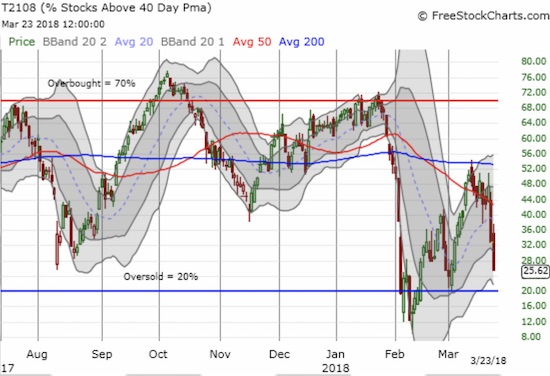
AT40 = 25.6% of stocks are trading above their respective 40-day moving averages (DMAs)
AT200 = 37.5% of stocks are trading above their respective 200DMAs (2-year closing low)
VIX = 24.9
Short-term Trading Call: neutral
Commentary
On Friday, President Trump characterized the pre-Trump stock market as something “from another planet.” Surely he meant the last two months of action must be from another planet?
Dow and S&P 500 extend losses, both now down for the year. Trump not tweeting so much about stocks these days – 40 times between Oct 1 and Jan 26 when Wall Street was chalking up record high after record high… only once since. pic.twitter.com/umo01sNyao
— Jamie McGeever (@ReutersJamie) March 22, 2018
{And THIS is the exact time the stock market could use some cheerleading!}
It was a manic week that featured some bursts of optimism intraday, but sellers prevailed almost every single time. The S&P 500 (SPY) sold off 4 of 5 days and 8 of the last 10. On Friday, it lost 2.1% and pushed right to its 200-day moving average.
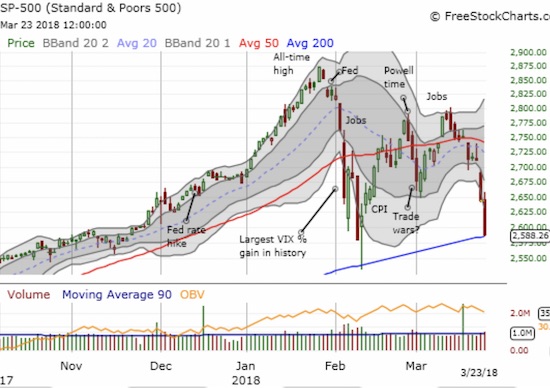
The S&P 500 is at one of its more important and critical junctures since perhaps the early 2016 sell-off or even the sell-off just ahead of the 2016 Presidential election. The index is at coinciding support from the February closing low and its 200-day moving average (DMA). However, unlike the February low, AT40 (T2108), the percentage of stocks trading above their respective 40DMAs, is NOT yet oversold (below 20%). AT40 closed the day at 25.6% and is far above where it traded during the February trough.
The S&P 500 could fall a LOT further from Friday’s close before reaching another trading bottom. In this scenario, the S&P 500 would be in official bear territory where rallies get sold until the index closes above its 200DMA.
On the optimistic side, if the S&P 500 can somehow survive this latest test of support, a subsequent bounce will come from a stronger point than the last two bounces. Moreover, the S&P 500 is well below its lower-Bollinger Band (BB) and is thus over-stretched. The lower the index stretches below its lower-BB, the more likely it will bounce back regardless of AT40’s level. I chose the more optimistic side when I decided to add to my SPY shares ahead of the 200DMA test.
Starting to (re)accumulate $SPY as it careens to another 200DMA test. % stocks > 40DMA down to 33% (oversold is <20%). #AT40 #T2108 pic.twitter.com/0dccZ36ejH
— Dr. Duru (@DrDuru) March 23, 2018
Either way, trading will be subject to more churn and sharp reversals. I am maintaining my neutral short-term trading call in order to stay braced for the potentially violent trading action. I am planning to do mostly hedged trading with calls and puts that should pay off very well if/once the market moves a lot in a particular direction. I will also be prone to take profits quickly on these trades.
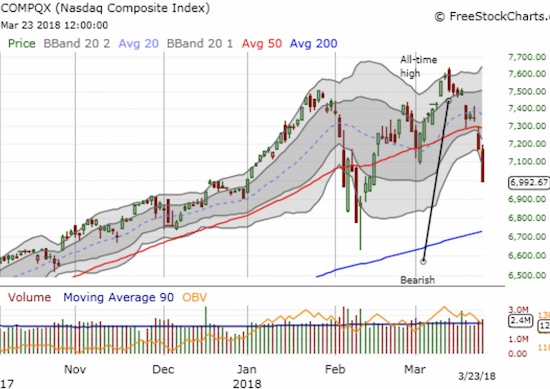
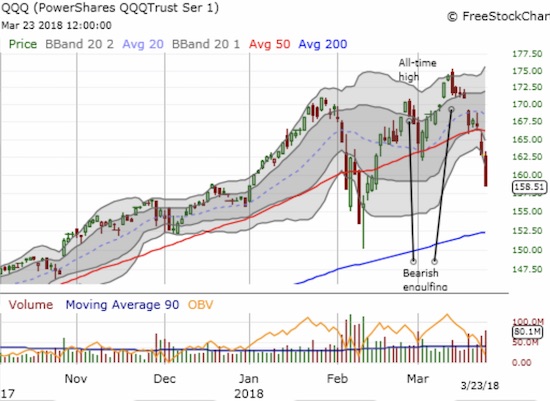
The NASDAQ and the PowerShares QQQ ETF (QQQ) lost 2.4% and 2.6% respectively and each closed well below its lower-Bollinger Band (BB). Unlike the S&P 500, both indices are still well above critical tests of the February low or the 200DMA.
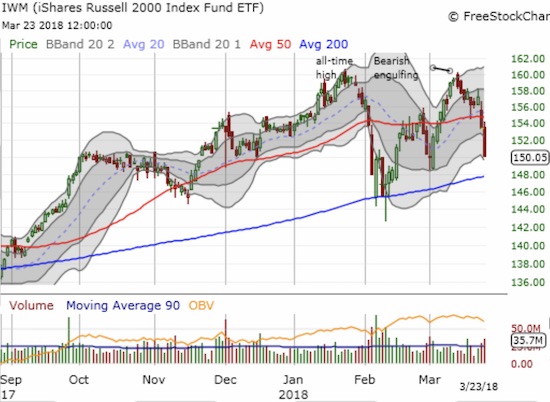
Small-caps are no longer out-performing to any degree that matters. The iShares Russell 2000 ETF (IWM) lost 2.2% and looks ready to slide right past the March low on its way to a rendezvous with 200DMA support.
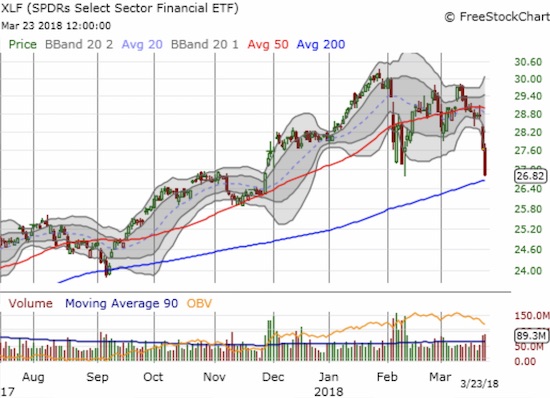
Financials are also experiencing a very critical test.
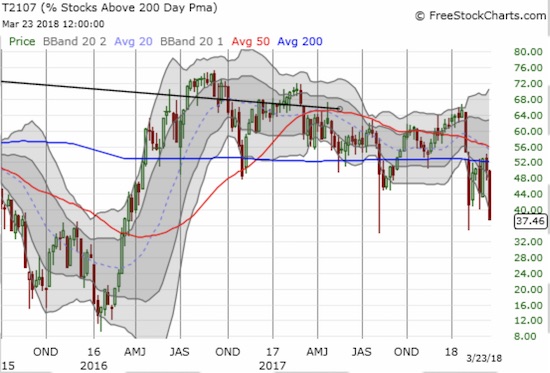
AT200 (T2107), the percentage of stocks trading above their respective 200DMAs, is tempering my optimism. This indicator closed at 37.5%, its lowest close in two years. This breakdown implies the longer-term prospects for the market have deteriorated. A lot of long-term damage continues to occur to stocks. This damage is likely exhausting investors who keep betting on longer-term trends only to see positions take fresh dives. Note well that AT200 has trended downward since its late 2016 peak – the rally in the stock market is slowly but surely leaving behind more and more stocks. The chart below is a weekly view…
The volatility index, the VIX, rose 57.4% for the week. The Federal Reserve’s rate hike was in the middle of this run-up. At one point, the VIX erased all its gains for the week. I shorted iPath S&P 500 VIX ST Futures ETN (VXX) ahead of the Fed anticipating a post-Fed volatility implosion. With the VIX plunging ahead of the Fed, I figured there was too much risk of the opposite of my expectations, so I took my profits. As the VIX soared post-Fed, I re-accumulated a new short position. This time, I am anticipating a volatility implosion after this latest sell-off ends.
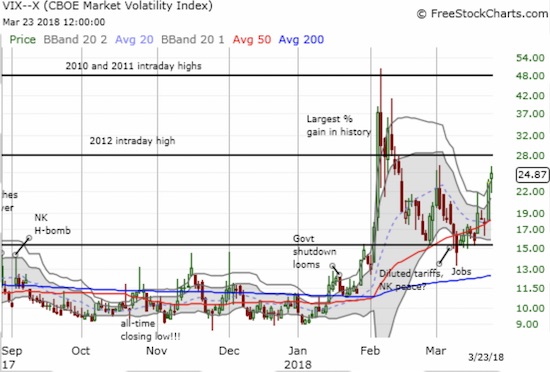
CHART REVIEWS
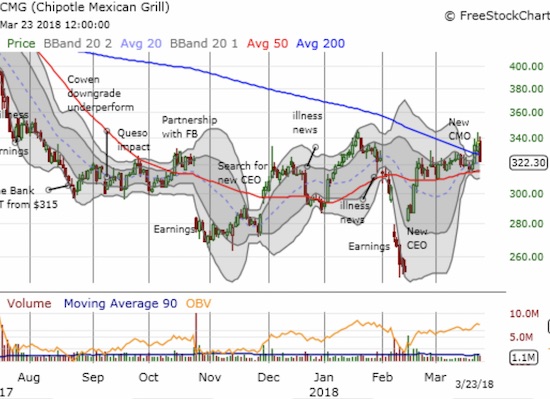
Chipotle Mexican Grill (CMG)
CMG had a promising week until Friday. The stock broke out from its 1-month consolidation range and closed above its downtrending 200DMA. On Thursday, the stock even well out-performed the market. I was able to flip a call option on that move. On Friday, I went back to work assuming the 200DMA would hold as support. Instead, sellers snuffed out CMG’s breakout and submerged under its 200DMA once again. I will now be watching out for a false breakout that launches a fresh wave of selling. A breakdown below the 50DMA will be very bearish under these circumstances.
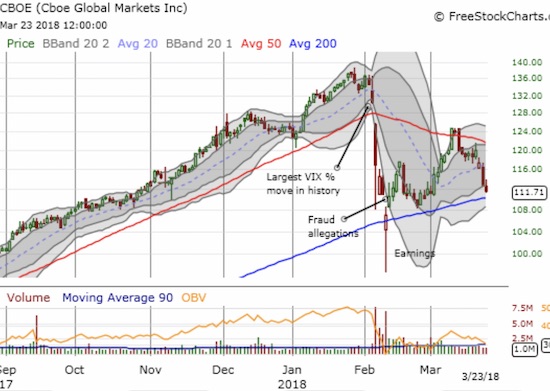
Cboe Global Markets (CBOE)
I still think CBOE is the best way to trade volatility, that is the trade in volatility products. So I consider this current pullback to be a golden opportunity to grow a position. While I am playing for a hold of 200DMA support, I am keeping my stop wide by holding it underneath the post-earnings low.
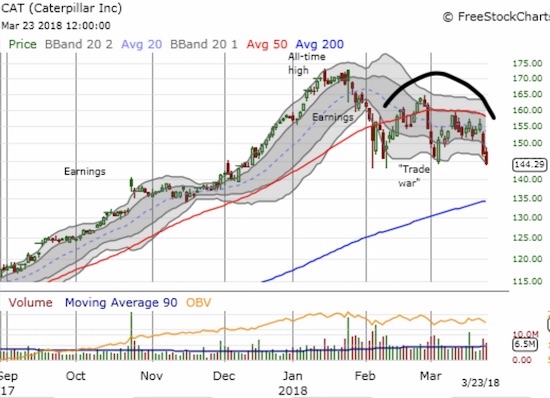
Caterpillar (CAT)
CAT filled its roll as a hedge on bullishness. CAT closed at a 3+ month closing low. The stock looks poised to drop all the way to 200DMA support after confirming resistance at its 50DMA with what is called a “rounded top.” The pattern is almost like a mini head and shoulders top. Needless to say, I did not cover my CAT short last week…
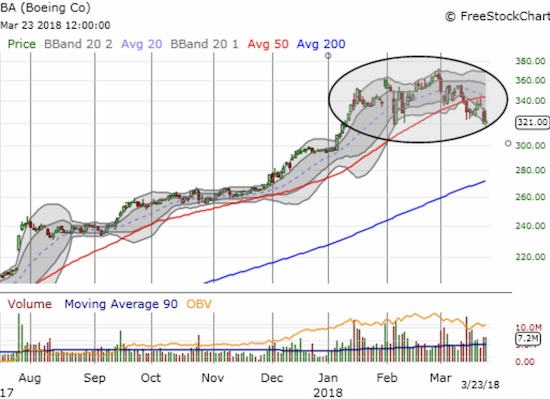
Boeing (BA)
CAT is not the only industrial stock in trouble. I see a LOT of charts like CAT’s and like that of Boeing (BA). BA is a highly loved stock so its fate is very important. The bullish story is well-known and the company’s order book is overflowing with profits for as far as the eye can see. So if sellers are willing to take down BA, they will surely exhibit no mercy on the scores of lesser stocks in the market! On Friday, buyers tried again to defend BA with a sharp out-performance. Buyers took the stock up as much as 2% or so succumbing to sellers. I took this opportunity to get a better price on adding BA to my list of shorts as a hedge against bullish positions. BA ended the day with a 0.4% gain, well ahead of the closes of the major indices. The bulls remain hopeful…
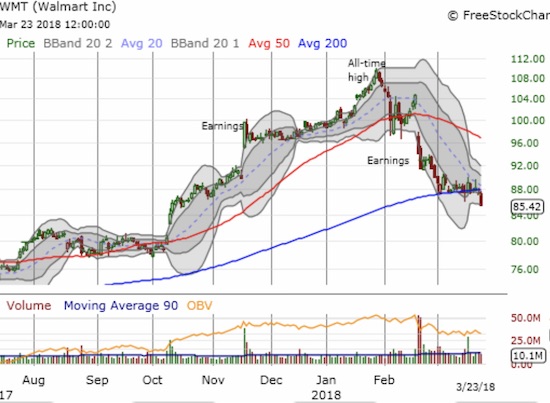
Walmart (WMT)
WMT closed at a 5+ month low and confirmed a breakdown below its 200DMA. The stock is 22.3% off its all-time high and officially in bear territory. This move puts an exclamation point on the end of my 2018 trading theme for retail stocks.
Other trades related to previous posts: flipped more puts on QQQ
— – —
FOLLOW Dr. Duru’s commentary on financial markets via email, StockTwits, Twitter, and even Instagram!
“Above the 40” uses the percentage of stocks trading above their respective 40-day moving averages (DMAs) to assess the technical health of the stock market and to identify extremes in market sentiment that are likely to reverse. Abbreviated as AT40, Above the 40 is an alternative label for “T2108” which was created by Worden. Learn more about T2108 on my T2108 Resource Page. AT200, or T2107, measures the percentage of stocks trading above their respective 200DMAs.
Active AT40 (T2108) periods: Day #26 over 20% (overperiod), Day #1 under 30% (underperiod ending 13 days over 30%), Day #2 under 40%), Day #9 under 50%, Day #34 under 60%, Day #40 under 70%
Daily AT40 (T2108)
")
Black line: AT40 (T2108) (% measured on the right)
Red line: Overbought threshold (70%); Blue line: Oversold threshold (20%)
Weekly AT40 (T2108)

*All charts created using freestockcharts.com unless otherwise stated
The charts above are my LATEST updates independent of the date of this given AT40 post. For my latest AT40 post click here.
Related links:
The AT40 (T2108) Resource Page
You can follow real-time T2108 commentary on twitter using the #T2108 or #AT40 hashtags. T2108-related trades and other trades are occasionally posted on twitter using the #120trade hashtag.
Be careful out there!
Additional disclosure: long CMG calls, long BA put, short CAT, long SPY shares, long CBOE
*Charting notes: FreeStockCharts.com uses midnight U.S. Eastern time as the close for currencies. Stock prices are not adjusted for dividends.