AT40 = 69.0% of stocks are trading above their respective 40-day moving averages (DMAs)
AT200 = 63.3% of stocks are trading above their respective 200DMAs
VIX = 9.9
Short-term Trading Call: cautiously bullish
Commentary
Last week, I complained about the stock market’s “rubber band” getting stretched. I claimed that AT40 (T2108), the percentage of stocks trading above their respective 40-day moving averages (DMAs), had to push into overbought territory (above 70%) and/or the volatility index, the VIX, had to push to new all-time lows to enable a push higher for the S&P 500 (SPY). The S&P 500 made another all-time high today, but AT40 rallied just short of the overbought threshold by closing at 69.0%, and the VIX closed with a gain 5 out of the last 6 trading days. AT40 jumped from 63.5% to 69.0% and firmly confirmed today’s rally in the stock market.
On the way here, the S&P 500 delivered a small bearish divergence on Tuesday that looked like the beginning of a confirmation of my concerns (the S&P 500 rallied while AT40 declined). Sure enough, the S&P 500 took a dip next. Yet, faithful buyers rallied the index off its low of the day and kept up the pace by creating today’s 0.7% gain and new all-time high.
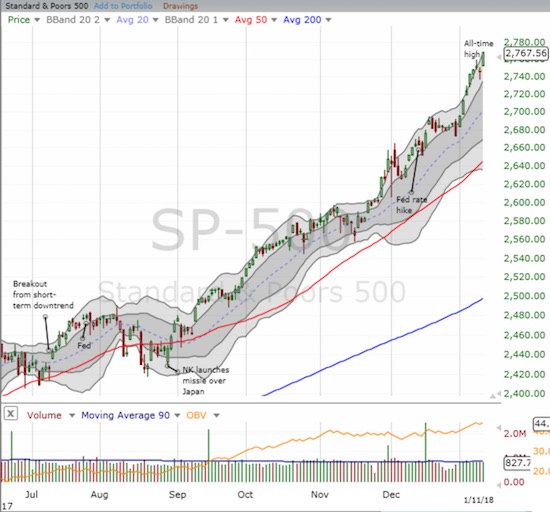
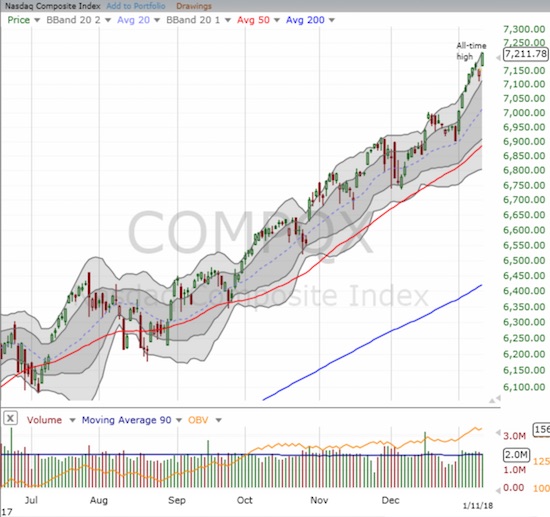
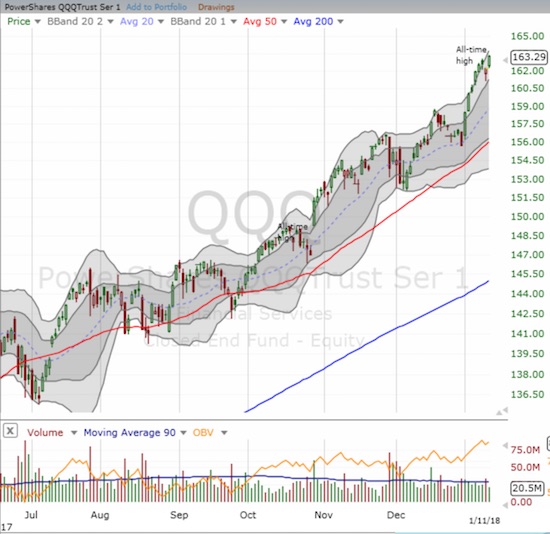
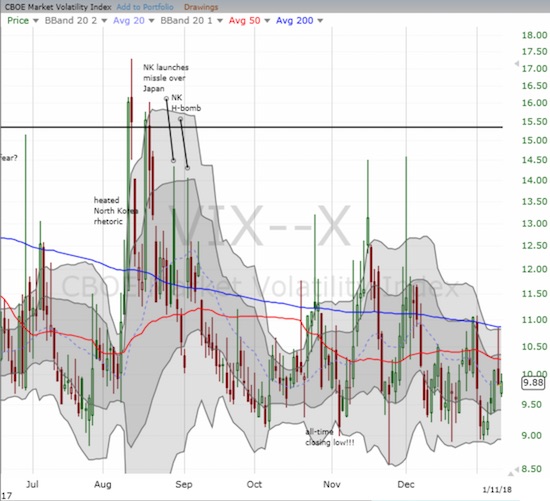
The brevity and shallowness of the dip is part of a months-long pattern. I was amused by the conventional financial media that assigned great weight to the selling and went on expeditions to explain the losses. Most, if not all, of those explanations appear meaningless now.
My short-term trading call remains at “cautiously bullish.” If AT40 fades from here, I will get a lot MORE cautious and likely even downgrade to no better than neutral. A close for the S&P 500 below Wednesday’s intraday low would take me quickly to bearish. However, I assume now that the market’s momentum will carry it confidently into overbought territory before any bearish signals trigger. I fully recognize that a bearish signal in this context is much less a selling trigger than it is a “stop buying and wait for the next entry” trigger.
STOCK CHART REVIEWS
Axovant Sciences (AXON)
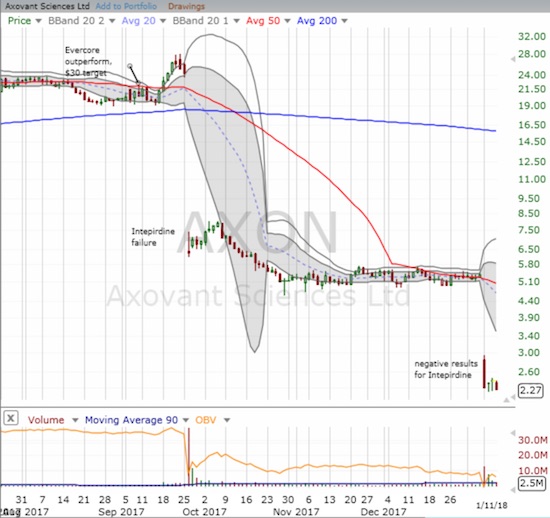
AXON was slammed again this week on poor testing results. I laid out my trading rule on AXON three months ago. AXON failed the test, and I bailed. Another lesson learned and confirmed in risk management.
Caterpillar (CAT)
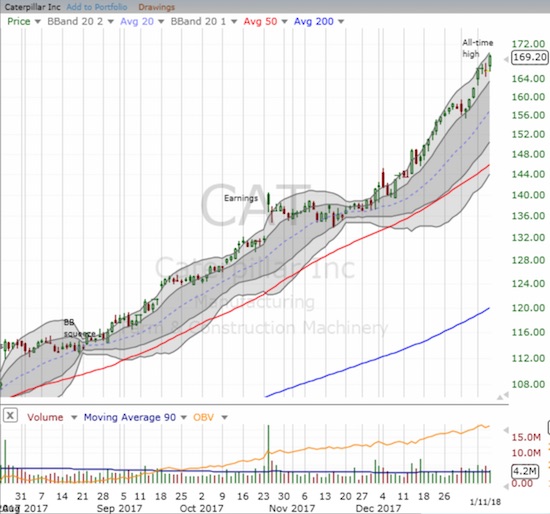
CAT is “enough said.” Its relentless drive higher continues and underlines the raging bullish sentiment in the stock market. My call options sold right after the open on Monday. I am eagerly awaiting the next dip to the lower part of the upper Bollinger Band (BB) uptrending channel.
First Solar (FSLR)
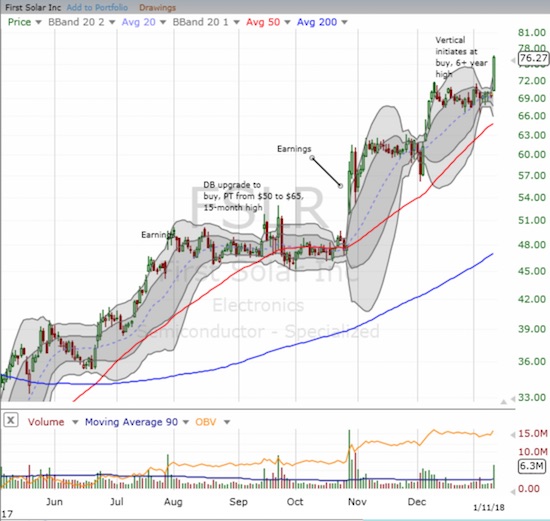
FSLR is by far my favorite solar stock, so I am kicking myself for not having a fresh position. Today, FSLR achieved a MAJOR breakout to an amazing 6+ year high. There was a time not long ago that I thought FSLR might never reach this point, at least not for many more years. It is now time to more aggressively buy the dips.
KB Home (KBH)
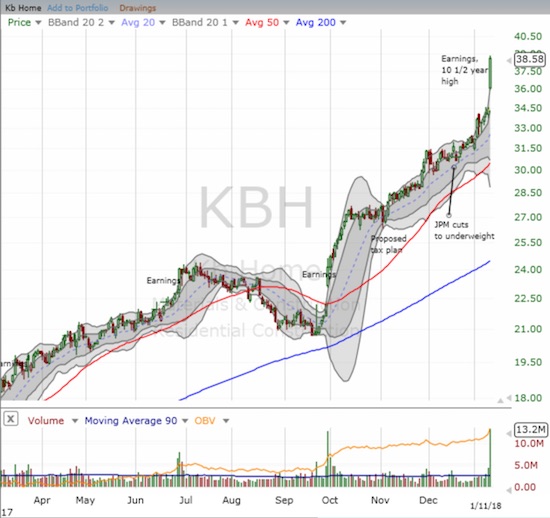
It is hard to believe that KBH still sports a float where 22% is sold short. Today’s post-earnings result announced as loudly as possible that home builders remain as strong as ever. KBH gapped up post-earnings to the top of its upper-BB and did not look back. The 12.3% gain took KBH to a 10 1/2 year high. I cannot wait to review this month’s housing data with KBH as context.
Dominos Pizza (DPZ)
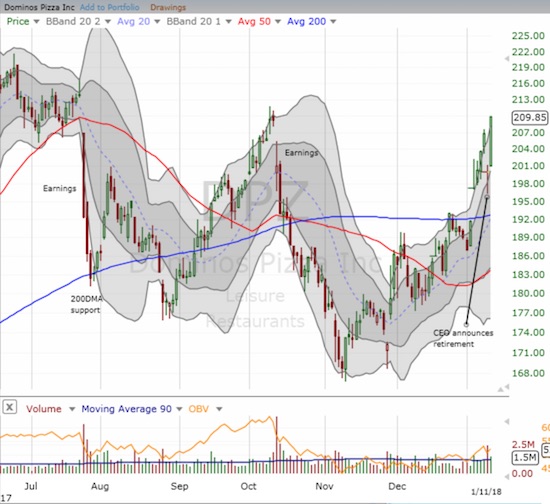
In this market, I play the dips where they get served. Yesterday, the CEO of Dominos announced he will retire mid-year. The stock gapped down after the open and bounced back after it traded lower. I rushed in to load up on a call option given the stock’s prior strength rallying off the November lows and its 200DMA breakout a week ago. I was rewarded much faster than expected as the call option nearly doubled with the stock ripping to a 4.9% gain. It was like the stock picked up where it left off.
DPZ closed the gap down from October earnings. I locked in profits on this trade (per rule to sell after realizing a quick double), but DPZ is solidly locked into the buy-the-dip list.
SPDR S&P Retail ETF (XRT)
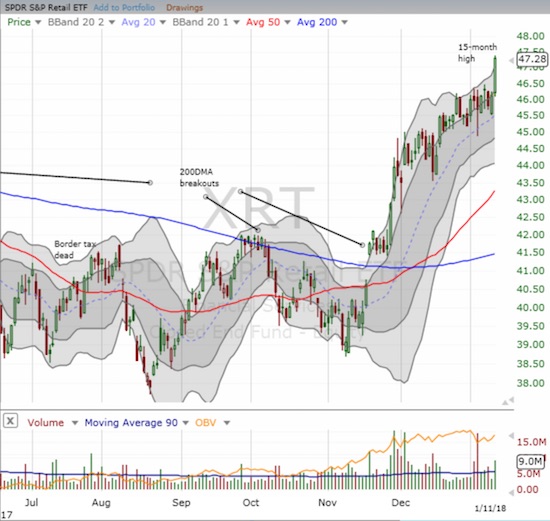
At some point I will stop pounding the table for retail as a trading and investing theme for 2018…but today is not that day. XRT is up 4.6% year-to-date versus the S&P 500’s 3.5% year-to-date gain.
Ulta Beauty (ULTA)
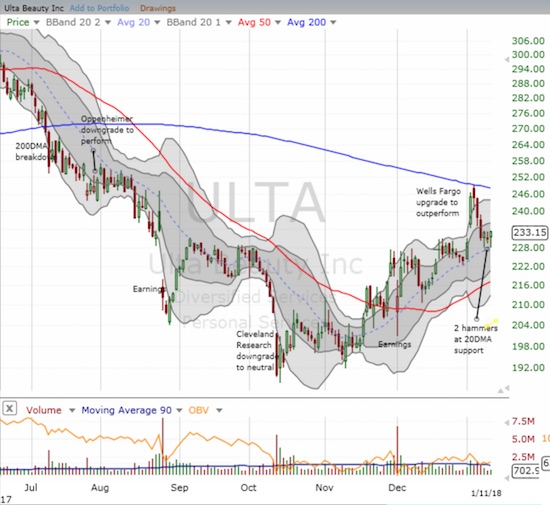
ULTA was tricky to play this week. The stock has yet to regain its momentum after traders quickly faded the gains from the entire Wells Fargo upgrade. Still, the past 3 days generated two hammer patterns with the lows neatly testing support at the uptrending 20DMA. The stock looks ready to lift again.
My options for this week will (very likely) go out worthless. I bought shares to ride what I think will be an eventual resumption of old momentum. I am also looking to replay call options for the next few weeks. If ULTA closes below its 20DMA, the next stop will be a visit to 50DMA support.
— – —
FOLLOW Dr. Duru’s commentary on financial markets via email, StockTwits, Twitter, and even Instagram!
“Above the 40” uses the percentage of stocks trading above their respective 40-day moving averages (DMAs) to assess the technical health of the stock market and to identify extremes in market sentiment that are likely to reverse. Abbreviated as AT40, Above the 40 is an alternative label for “T2108” which was created by Worden. Learn more about T2108 on my T2108 Resource Page. AT200, or T2107, measures the percentage of stocks trading above their respective 200DMAs.
Active AT40 (T2108) periods: Day #473 over 20%, Day #287 over 30%, Day #87 over 40%, Day #35 over 50%, Day #26 over 60% (overperiod), Day #61 under 70%
Daily AT40 (T2108)

Black line: AT40 (T2108) (% measured on the right)
Red line: Overbought threshold (70%); Blue line: Oversold threshold (20%)
Weekly AT40 (T2108)

*All charts created using freestockcharts.com unless otherwise stated
The charts above are my LATEST updates independent of the date of this given AT40 post. For my latest AT40 post click here.
Related links:
The T2108 Resource Page
You can follow real-time T2108 commentary on twitter using the #T2108 or #AT40 hashtags. T2108-related trades and other trades are occasionally posted on twitter using the #120trade hashtag.
Be careful out there!
Full disclosure: long UVXY calls, long ULTA
*Charting notes: FreeStockCharts.com uses midnight U.S. Eastern time as the close for currencies. Stock prices are not adjusted for dividends.
