
AT40 = 65.7% of stocks are trading above their respective 40-day moving averages (DMAs)
AT200 = 63.2% of stocks are trading above their respective 200DMAs
VIX = 9.2 (was as low as 8.9)
Short-term Trading Call: cautiously bullish
Commentary
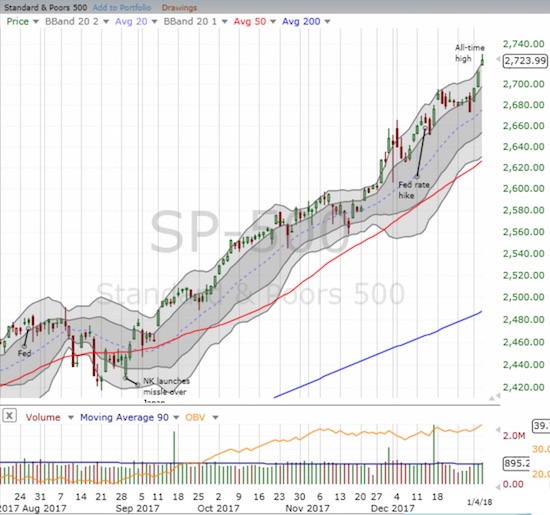
The S&P 500 (SPY) burst higher yet again and spent most of the day at or above its upper-Bollinger Band (BB). Technically, the index is getting stretched. Combine that move with a volatility index, the VIX, which barely closed above its all-time low for the second day in a row, and conditions are ripe for a pause and a pullback for the stock market.
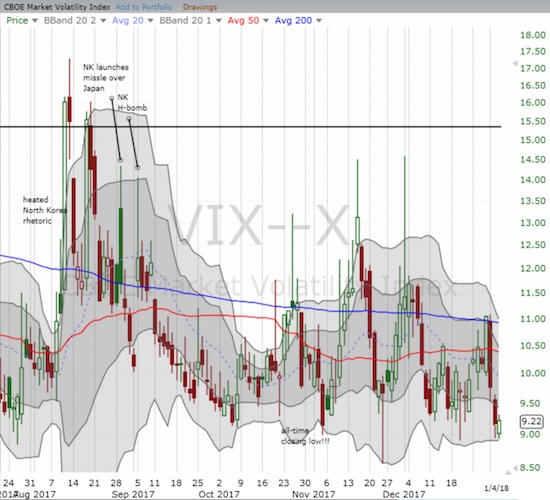
Given the short amount of time the VIX typically spends at these low levels, I promptly bought a fresh tranche of call options on ProShares Ultra VIX Short-Term Futures (UVXY). Per the trading strategy, I plan to sell these calls at the first large spike in volatility. The volatility faders still dominate trading and have been quite effective at grinding volatility back into extremely low levels.
AT40 (T2108), the percentage of stocks trading above their respective 40-day moving averages (DMAs), is still struggling to gain momentum and challenge the overbought threshold at 70%. Thus, the S&P 500 is once again outstretching the field. The inability of buyers to expand breadth on the stock market’s latest march higher is a classic AT40 sign of buyer exhaustion for the general stock market. The longer AT40 spends churning below 70%, the less likely it will break into overbought territory before it pulls back. Of course, recall that AT40 can decline for quite some time before the major indices (aka the biggest stocks) decide to follow suit.
The raging bull market has turned the anticipation of pullbacks into a quaint exercise in nostalgia. I am not even changing the short-term trading call and expect the next dip to be quite buyable even if all that awaits around the corner is a pause and another shallow pullback. The coming earnings season is the most likely catalyst for the next pause/pullback.
STOCK CHART REVIEWS
Caterpillar (CAT)
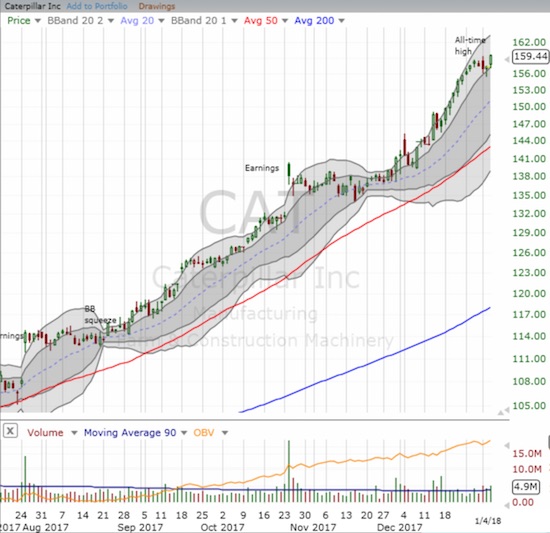
CAT is still one of my favorite individual stocks for flagging market sentiment. The stock has experienced a near relentless rally since last summer interrupted by the briefest of pauses and shallowest of dips. I have long since stopped using CAT put options to hedge my bullish positions. This week, I decided to take a swing with a call option as CAT took a pause at the bottom of its uptrending Bollinger Band (BB) channel. Today’s 1.4% gain seems to validate that move. I am targeting more all-time highs and an eventual trip to at least $162.50 before the next pause.
— – —
FOLLOW Dr. Duru’s commentary on financial markets via email, StockTwits, Twitter, and even Instagram!
“Above the 40” uses the percentage of stocks trading above their respective 40-day moving averages (DMAs) to assess the technical health of the stock market and to identify extremes in market sentiment that are likely to reverse. Abbreviated as AT40, Above the 40 is an alternative label for “T2108” which was created by Worden. Learn more about T2108 on my T2108 Resource Page. AT200, or T2107, measures the percentage of stocks trading above their respective 200DMAs.
Active AT40 (T2108) periods: Day #468 over 20%, Day #282 over 30%, Day #82 over 40%, Day #30 over 50%, Day #21 over 60% (overperiod), Day #56 under 70%
Daily AT40 (T2108)
")
Black line: AT40 (T2108) (% measured on the right)
Red line: Overbought threshold (70%); Blue line: Oversold threshold (20%)
Weekly AT40 (T2108)

*All charts created using freestockcharts.com unless otherwise stated
The charts above are my LATEST updates independent of the date of this given AT40 post. For my latest AT40 post click here.
Related links:
The T2108 Resource Page
You can follow real-time T2108 commentary on twitter using the #T2108 or #AT40 hashtags. T2108-related trades and other trades are occasionally posted on twitter using the #120trade hashtag.
Be careful out there!
Full disclosure: long UVXY calls, long BHP calls
*Charting notes: FreeStockCharts.com uses midnight U.S. Eastern time as the close for currencies. Stock prices are not adjusted for dividends.