
AT40 = 64.5% of stocks are trading above their respective 40-day moving averages (DMAs)
AT200 = 62.6% of stocks are trading above their respective 200DMAs
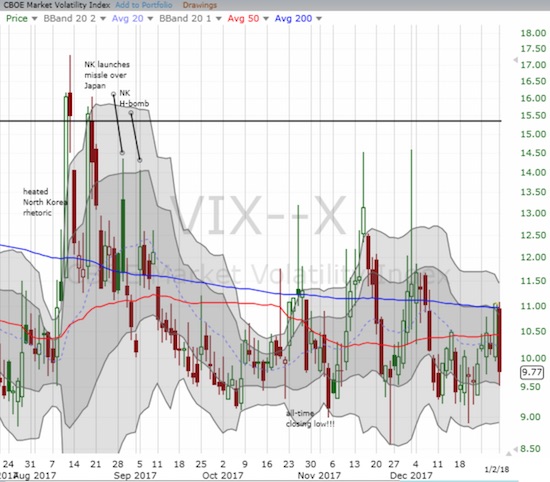
VIX = 9.8
Short-term Trading Call: cautiously bullish
Commentary
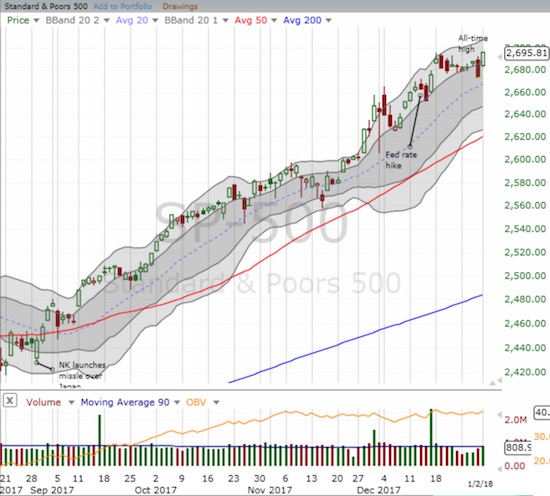
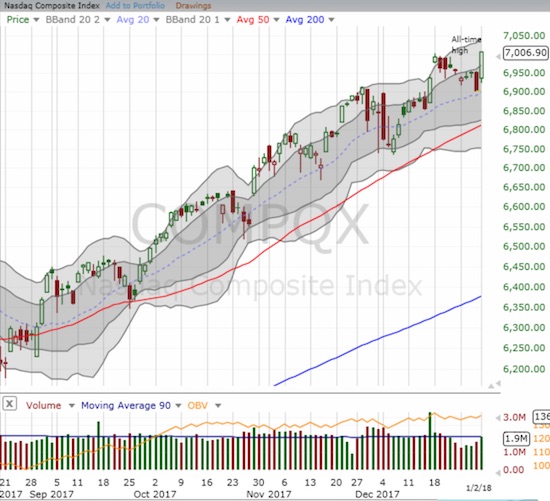
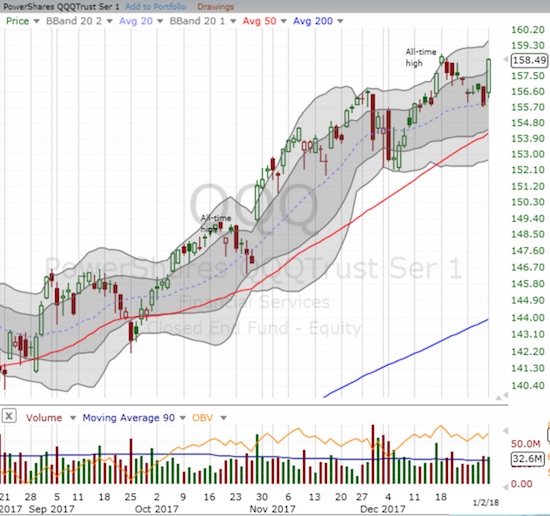
The New Year started with fireworks with the S&P 500 (SPY) gapping up to a 0.8% gain and new all-time high. The NASDAQ gapped up and sprinted to a 1.5% gain and closed above 7,000 for the first time. The PowerShares QQQ ETF (QQQ) gained a stellar 1.7% yet managed to stop just short (by a fraction of a point) of a new closing all-time high.
The volatility index, the VIX, confirmed the bullish sentiment with a fresh plunge under 10 and back into “extremely low” territory.
Despite these fireworks, my favorite technical indicator, AT40 (T2108), the percentage of stocks trading above their 40-day moving averages (DMA), did not share in much of the excitement. AT40 only increased from 60.6% to 64.5%. For the past two weeks, AT40 has churned just below the overbought threshold of 70%. As a reminder, until AT40 pushes into overbought territory, my bullish trading call stays qualified as “cautious.”
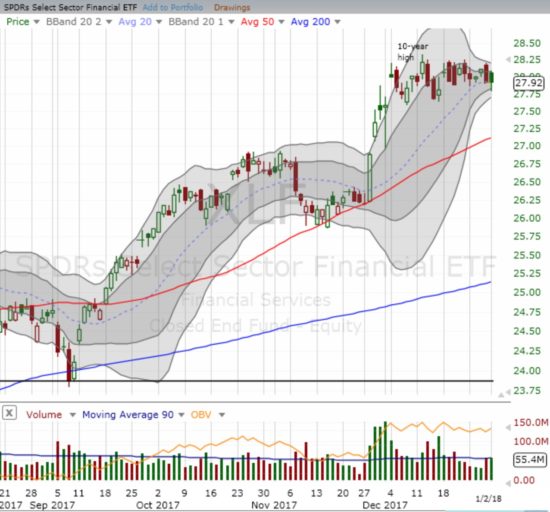
The most conspicuous non-participants in the beginning of the year fireworks were financials. The Financial Select Sector SPDR ETF (XLF) closed the day essentially flat and even spent part of the day in negative territory.
Still, the year could hardly have started better for financial markets.
STOCK CHART REVIEWS
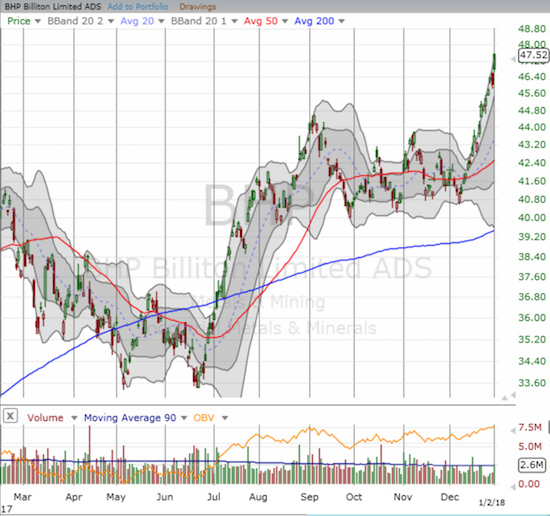
BHP Billiton Limited (BHP)
Commodities are on fire in a sign that global growth is truly kicking it into high gear. BHP Billiton Limited (BHP) practically says it all as a diversified commodities player. It is also the winning half of a pairs trade I recommended in late September.
Iron ore prices kicked it into an extra gear going into this year as well.
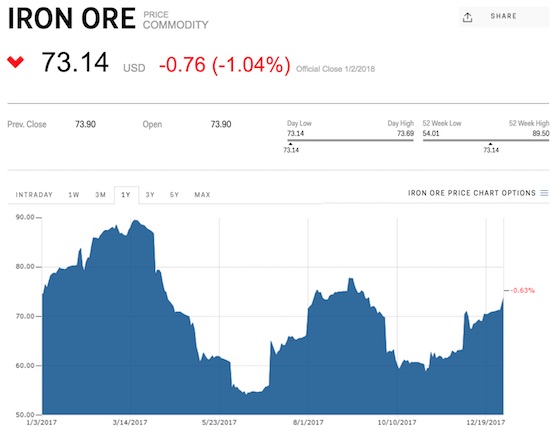
Source: Business Insider
In future posts this month, I will play catch-up on some of the key stocks I wrote about in the past several months. In particular, I will keep pounding the table for retail as more and more companies funnel tax windfalls into employee bonuses and raises and minimum wage limits increase in several states. The SPDR S&P Retail ETF (XRT) gained 1.8%. I am also planning a fresh review and update of the AT40 trading model and statistics.
— – —
FOLLOW Dr. Duru’s commentary on financial markets via email, StockTwits, Twitter, and even Instagram!
“Above the 40” uses the percentage of stocks trading above their respective 40-day moving averages (DMAs) to assess the technical health of the stock market and to identify extremes in market sentiment that are likely to reverse. Abbreviated as AT40, Above the 40 is an alternative label for “T2108” which was created by Worden. Learn more about T2108 on my T2108 Resource Page. AT200, or T2107, measures the percentage of stocks trading above their respective 200DMAs.
Active AT40 (T2108) periods: Day #466 over 20%, Day #280 over 30%, Day #80 over 40%, Day #28 over 50%, Day #19 over 60% (overperiod), Day #54 under 70%
Daily AT40 (T2108)
")
Black line: AT40 (T2108) (% measured on the right)
Red line: Overbought threshold (70%); Blue line: Oversold threshold (20%)
Weekly AT40 (T2108)

*All charts created using freestockcharts.com unless otherwise stated
The charts above are my LATEST updates independent of the date of this given AT40 post. For my latest AT40 post click here.
Related links:
The T2108 Resource Page
You can follow real-time T2108 commentary on twitter using the #T2108 or #AT40 hashtags. T2108-related trades and other trades are occasionally posted on twitter using the #120trade hashtag.
Be careful out there!
Full disclosure: long UVXY calls, long BHP calls
*Charting notes: FreeStockCharts.com uses midnight U.S. Eastern time as the close for currencies. Stock prices are not adjusted for dividends.