
AT40 = 57.2% of stocks are trading above their respective 40-day moving averages (DMAs)
AT200 = 57.6% of stocks are trading above their respective 200DMAs
VIX = 11.2 (volatility index)
Short-term Trading Call: cautiously bullish
Commentary
The cats were particularly frenetic in the last week of trading for the second quarter of 2017.

The major indices made some major moves, but it was hard to get a handle on why these moves happened. Why was the market a nut job in one direction one day, and then a nut job in the exact opposite direction the next day? The major indices swung wildly up and down and up and down and up and down again. Sure, I could cherry pick a good news item or a bad news item on any given day and force feed a correlation, but I think such an exercise is much less important than the end results. The simplest explanation is best: the market is fighting to make an adjustment that may remain unclear until we have sufficient hindsight.
The Bond Market
Interest rate dynamics may provide a good source for the churn. Long-term rates marched higher all week. For example, the iShares 20+ Year Treasury Bond ETF (TLT) declined each day of the week after gapping down significantly on Monday. The contrary gap UP created by the Fed’s last rate hike has almost filled.
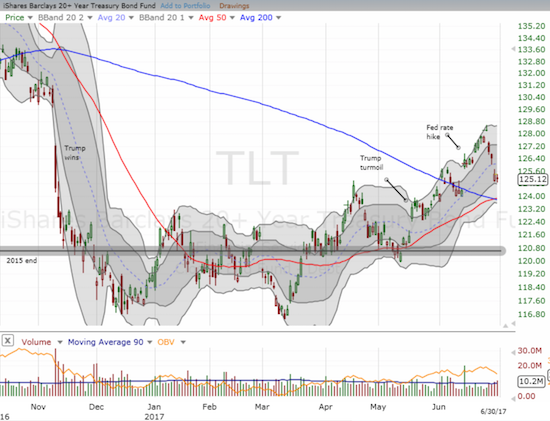
The 30-Day Fed Fund Futures confirmed the move in rates by reverting back to timing the next Fed rate hike for December.
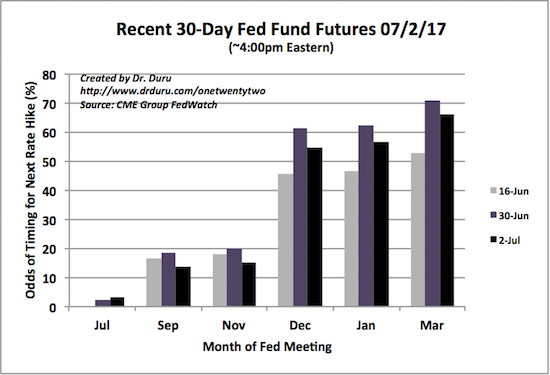
Source: CME FedWatch Tool
June 16th was two days after the Fed hiked interest rates and announced its plan to start reducing teh size of its balance sheet. Note that July 2nd is the time of writing, and the CME updated its market data past Friday, June 30th. The large drop in odds since Friday suggests the market rushed to an extreme last week. I will be watching to see what unfolds in the coming and more.
Forex
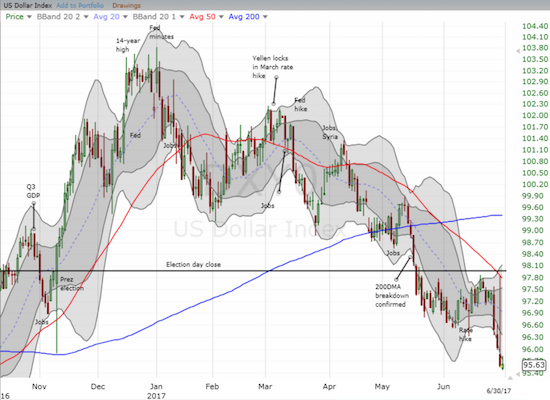
Strangely enough, the higher rates and rate expectations did not help the U.S. dollar index (DXY0) as stronger forex forces beyond the dollar dominated. This absence of the usual correlation likely added to the chaotic behavior of stocks, especially the big caps that have significant international exposure. The Fed has hiked rates three times in the last 6 months, yet the dollar sits at a 9-month low.
With these breakdown in correlations and flip-flopping about the impact of Fed rate hikes, no wonder the stock market was so sensitive and frenetic.
Stock indices
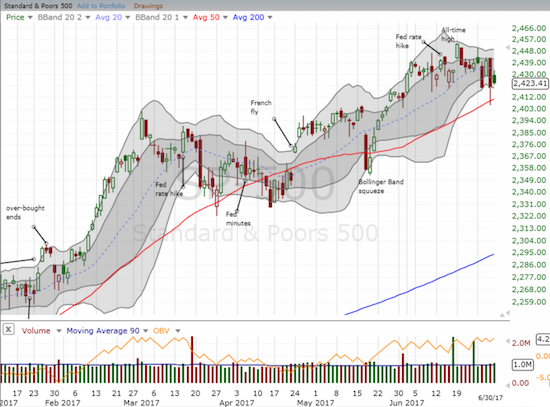
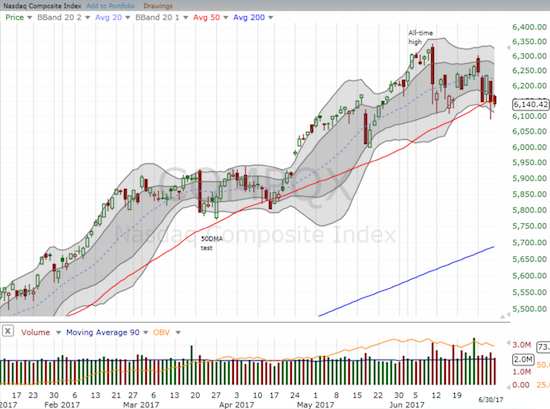
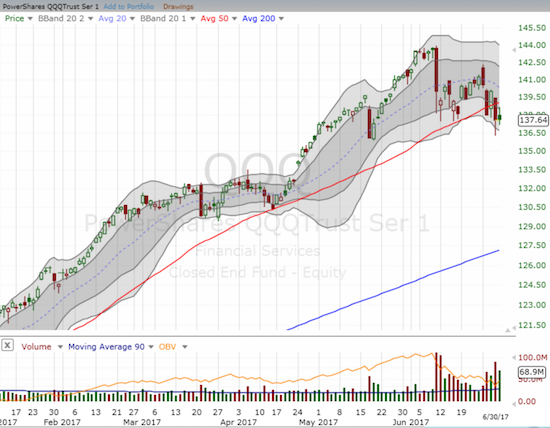
In my last Above the 40 post (for Wednesday June 28th), I marveled at the market’s immediate healing process that erased most of the damage from the previous day’s selling. In particular, the 50DMAs on the NASDAQ and the PowerShares QQQ ETF (QQQ) held as support, and the S&P 500 (SPY) completely reversed its losses. AT40 (T2108), the percentage of stocks trading above their respective 40DMAs, confirmed the rapid return to bullish pastures. The technical picture deteriorated from there and into the close of the week.
The S&P 500 was hammered on Thursday and at one point cracked 50DMA support. The index somehow closed at Tuesday’s low. Friday’s attempt at a rally was met with a fade.
The NASDAQ also cracked its 50DMA on Thursday but failed to close above it. The tech-laden index lost more ground on Friday. QQQ even more definitively failed at its 50DMA support. The bias toward selling on QQQ is clear from the surge in trading volume since the June 9th swoon that has caused on-balance volume (OBV) to plunge.
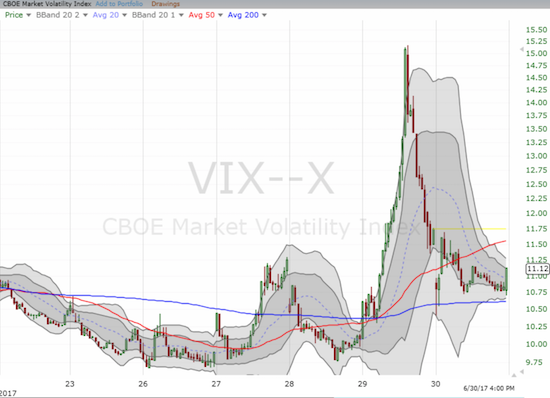
While tech stocks experienced their roughest relative patch of the year, the volatility index, the VIX, was the true highlight of the week. On Thursday, the panic was strong enough to send the VIX soaring to just under the all-important 15.35 pivot. As suddenly as it spiked, the VIX imploded. The VIX closed at 11.4, a 14.1% gain that reached 51% at its height!!! On Friday, the VIX lost 2.3%, but an attempt to reverse all of Thursday’s gains was actually repelled by the bears.
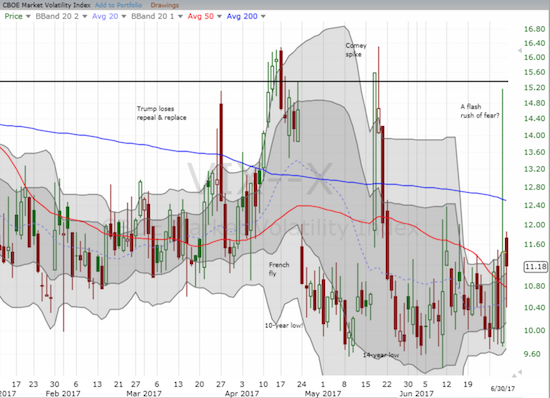
AT40 held remarkably steady – demonstrating that the latest damage being done to the market is still selective with big cap tech falling as the latest victim. AT40 closed the week at 57.2%. Even when the VIX was at its peak on Thursday, AT40 only got as low as 49.2%. I associate such surges with massive selling and oversold trading conditions. AT200 (T2107), the percentage of stocks trading above their respective 200DMAs, performed similarly well but with a tighter range. In other words, the technicals look bad for tech, but I have little reason to downgrade my short-term trading call from “cautiously bullish.” The S&P 500 stands as the final judge.
Trading through the thicket
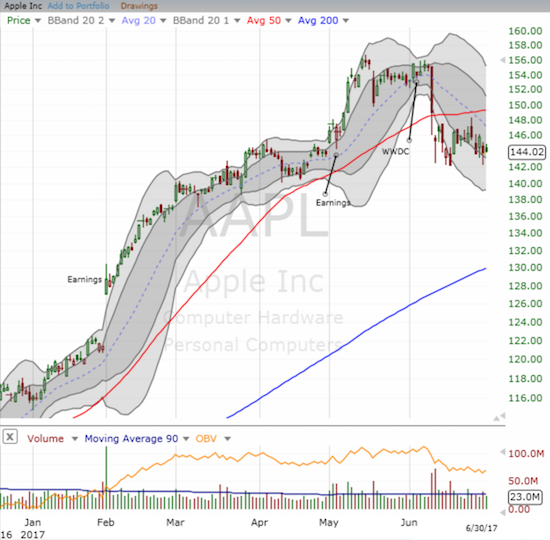
It is hard for me to describe how I traded through this madness. I had a combination of good luck, bad luck, good and bad positioning, and slow and quick responses. I made money when I was willing to move quickly. My trading in the “usual suspects” felt the same as the previous week: trying to herd cats into my wallet. I failed on all counts to make money on the long side (call options on NFLX, FB, and QQQ), but two large tranches of put options on Apple (AAPL) helped defray those losses. I faded AAPL one more time to end the week.
Ironically, of the usual suspects now in bearish position, AAPL is the most steady. AAPL confirmed its breakdown first but has subsequently churned in a tight range between about $142.30 and $148. In the list below, I describe the setups for the other usual suspects along with a short-term bull/bear call (ALL of these stocks are still in bullish, long-term uptrends).
- Facebook (FB): Bullish. Traded below its 50DMA 3 times this past week. FB did not close at its low of the week but hovers directly above 50DMA support.
- Amazon.com (AMZN): Barely bullish. Traded slightly below its 50DMA once. Ended the week at its lowest close of the week and exactly on top of 50DMA support.
- Nvidia (NVDA): Neutral. Closed the week at a 4-week low and right above its lower-Bollinger Band (BB). A retest of 50DMA support looks like it is in the cards.
- Netflix (NFLX): Bearish. Closed the week at a 2-month closing low. It spent 4 of 5 days of the week trading below its 50DMA and confirmed the breakdown.
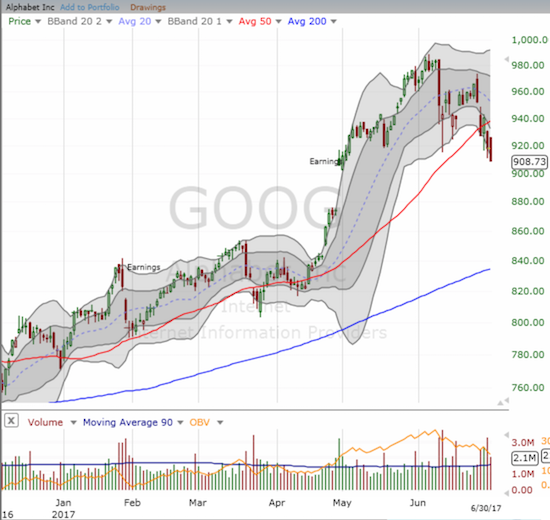
- Alphabet (GOOG): Bearish. Closed at its low of the week with selling on Friday confirming a 50DMA breakdown.
With hindsight, I should have targeted GOOG for bearish action. GOOG even had a bearish news catalyst in the form of a massive fine and regulatory action from the European Union that could hinder the company’s revenue growth in the region.
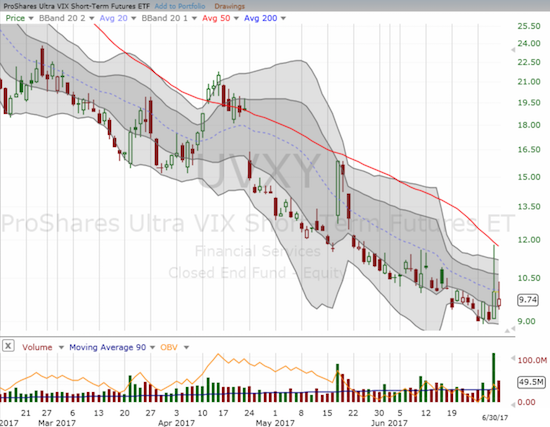
I was most successful trading around the moves in volatility, but the trades were all concentrated on Thursday’s remarkable action. Seeing tech breaking down, I bet that volatility had to increase. After profiting from the surge, I turned to a standard rule: large spikes in volatility are not sustainable. A surge over 50% within a few hours is the equivalent of extreme panic and tips the scale of non-sustainability. The subsequent implosion was more complete than I could have imagined, and I failed to capitalize on the full extent of it. I ended the week refreshing my volatility positioning with call options on ProShares Ultra VIX Short-Term Futures (UVXY) expiring this Friday and put options expiring the following Friday. I am expecting new fireworks somewhere in this period.
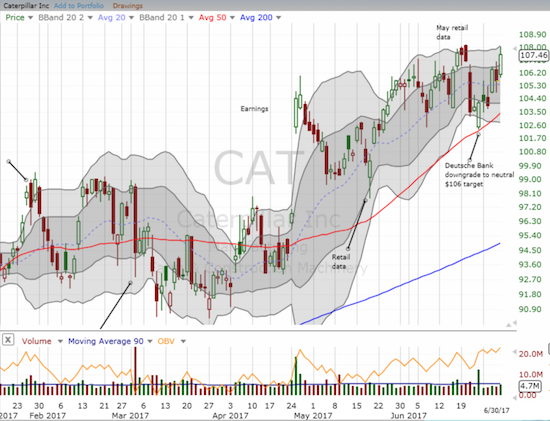
Last week, I noted my desire to collect more put options on Caterpillar (CAT). I thought I was too late after a Deutsche Bank downgrade gapped CAT down to its 50DMA. Yet, that rapid pullback appeared to be a sufficient catalyst to wash out the motivated sellers and turn 50DMA into golden, picture-perfect support. CAT rallied last week right through Desutsche’s $106 price target. I accumulate more put options in the middle of this rally to give me a comfortable hedge against my market bullishness.
(Addendum 7/3/17: I neglected to note that I bought QQQ and SPY calls as well. I reasoned that the massive spike and rapid implosion in volatility washed out a lot of short-term sellers in the market).
Semiconductors
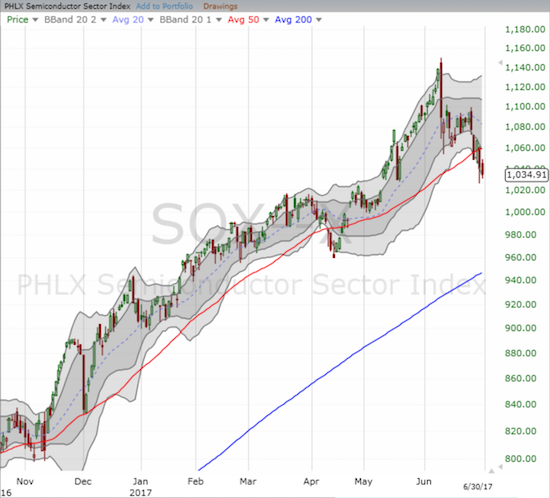
Speaking of tech that has yet to recover from the June 9th swoon, the PHLX Semiconductor Sector Index (SOX) has closed higher just once since that day. Last week, the index broke down below its 50DMA support and confirmed the breakdown.
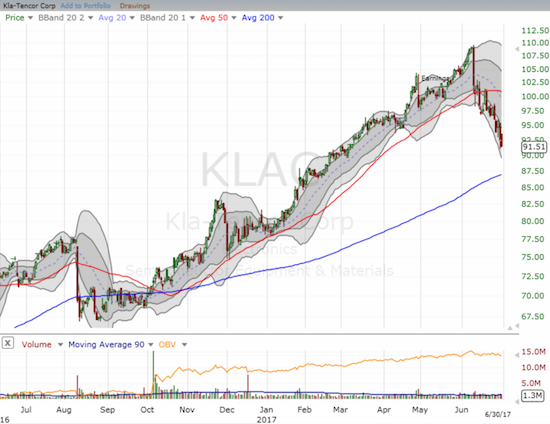
Intel (INTC) and KLA-Tencor Corporation (KLAC) are two notable examples of significant semiconductor stocks that have struggled recently.
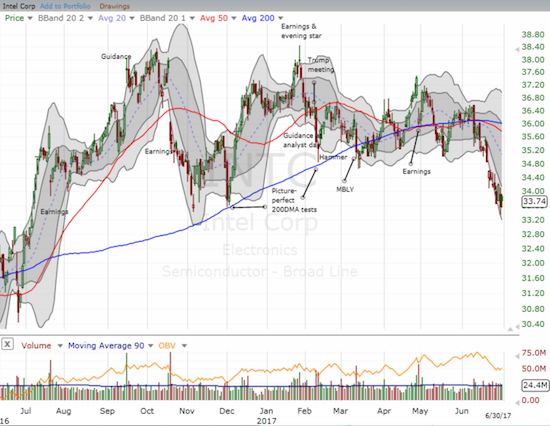
I am so tempted to refresh my between earnings bullish bet on INTC, but I will stand down for now. I may still bet on earnings itself.
Agriculture
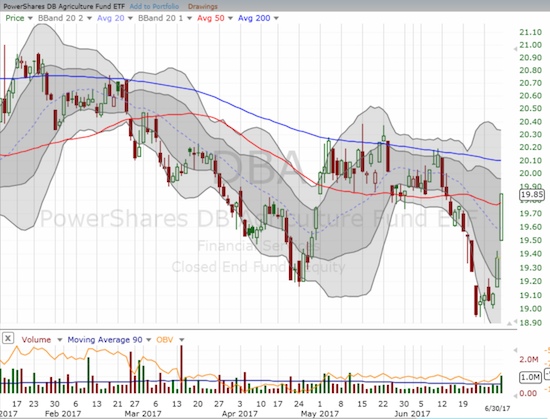
Last week, I took a quick look at how several agricultural related stocks were suffering near synchronized selling. The frenetic trading continued from there as the PowerShares DB Agriculture ETF (DBA) soared over the last two days in a move so sharp it looked like shorts heading for the exits all at once.
I managed to make a short-term trade in Path Bloomberg Cocoa SubTR ETN (NIB) after it hit my $22 price point. Unfortunately, I sold on the very next pop and missed Friday’s truly big move (NIB increased 4.6% while DBA increased 2.5%). Seeing this confirmation of my thesis on the ag trade has heightened my focus. I also bought call options in Deere & Company (DE). So far, it looks like buying interest may have returned to DE. Overall, I like the ag trade here because it promises to have little to no correlation to the rest of the stock market as it slogs through this apparent adjustment period.
Be careful out there!
— – —
FOLLOW Dr. Duru’s commentary on financial markets via email, StockTwits, Twitter, and even Instagram!
“Above the 40” uses the percentage of stocks trading above their respective 40-day moving averages (DMAs) to assess the technical health of the stock market and to identify extremes in market sentiment that are likely to reverse. Abbreviated as AT40, Above the 40 is an alternative label for “T2108” which was created by Worden. Learn more about T2108 on my T2108 Resource Page. AT200, or T2107, measures the percentage of stocks trading above their respective 200DMAs.
Active AT40 (T2108) periods: Day #345 over 20%, Day #159 over 30%, Day #26 over 40%, Day #5 over 50% (overperiod), Day #8 under 60% (underperiod), Day #105 under 70%
Daily AT40 (T2108)
")
Black line: AT40 (T2108) (% measured on the right)
Red line: Overbought threshold (70%); Blue line: Oversold threshold (20%)
Weekly AT40 (T2108)

*All charts created using freestockcharts.com unless otherwise stated
The charts above are my LATEST updates independent of the date of this given AT40 post. For my latest AT40 post click here.
Related links:
The T2108 Resource Page
You can follow real-time T2108 commentary on twitter using the #T2108 or #AT40 hashtags. T2108-related trades and other trades are occasionally posted on twitter using the #120trade hashtag.
Be careful out there!
Full disclosure: long QQQ call options, long AAPL put options, long UVXY call and put options, long INTC call options, long TLT call options, long SPY call options
*Charting notes: FreeStockCharts.com uses midnight U.S. Eastern time as the close for currencies.