
(T2108 measures the percentage of stocks trading above their respective 40-day moving averages [DMAs]. It helps to identify extremes in market sentiment that are likely to reverse. To learn more about it, see my T2108 Resource Page. You can follow real-time T2108 commentary on twitter using the #T2108 hashtag. T2108-related trades and other trades are occasionally posted on twitter using the #120trade hashtag. T2107 measures the percentage of stocks trading above their respective 200DMAs)
T2108 Status: 64.6%
T2107 Status: 73.2%
VIX Status: 11.3
General (Short-term) Trading Call: neutral
Active T2108 periods: Day #129 over 20%, Day #35 over 30%, Day #34 over 40%, Day #33 over 50%, Day #10 over 60% (overperiod), Day #12 under 70%
Commentary
Friday, August 19th, 2016 was another day where the buyers insisted on buying the smallest of dips and preserving the 20-day moving average (DMA) as firm support for the S&P 500.
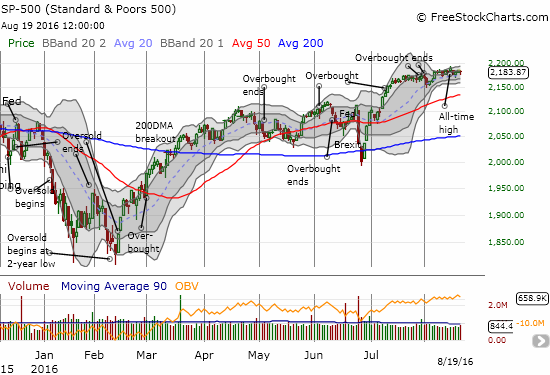
Interestingly, T2108, the percentage of stocks trading above their respective 40DMAs, failed to keep pace again. While the S&P 500’s bounce brought it to near flat, T2108 ended the day with a small loss to close at 64.6%. While the S&P 500 remains a hair below its all-time high, T2108 continues to struggle to break the overbought barrier at 70%. This disparity sits at the edge of a bearish divergence.
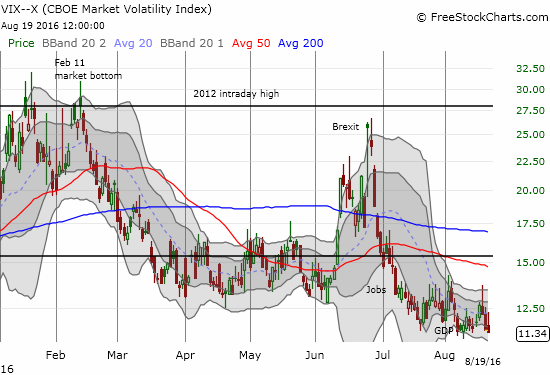
The volatility index, the VIX, was interesting. At its high of the day, the VIX managed to erase all of its previous losses, but by the close it made a marginal new low for the year. At 11.3, the VIX is at a new closing 25-month low.
So, overall, the market is in limbo, looking for the next catalyst with the path of least resistance pointing upward toward complacency. As usual, the relatively quiet trading belies some dramatic stories in individual stocks. In this T2108 Update, I provide a wide swath of interesting charts and stories and stock plays for now and for the next pullback in the stock market. In all these charts, pay particularly close attention to trading volume. In most cases, it has fallen off, sometimes dramatically, this month. So where volume is high, we have very significant moves. Also note how many bottom-fishing plays suddenly look pretty solid.
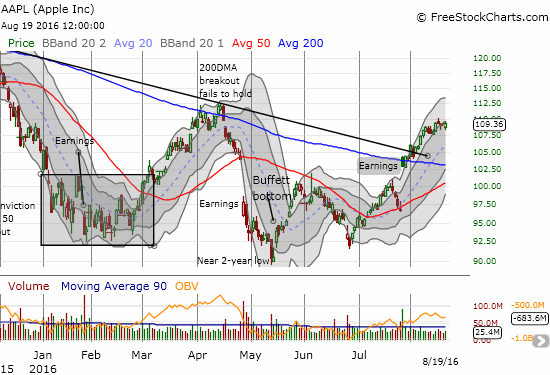
Apple (AAPL). On Monday of last week, Berkshire Hathaway (BRKA, BRKB) released Q2 regulatory filings showing the investment company increased its stake in AAPL by 55%. AAPL rallied on the news by jumping off support from the Bollinger Band (BB) but the stock gained no further ground the rest of the week. Clearly this news was not as dramatic as news of the first purchase; at that time, the reaction created the Buffett Bottom for AAPL.
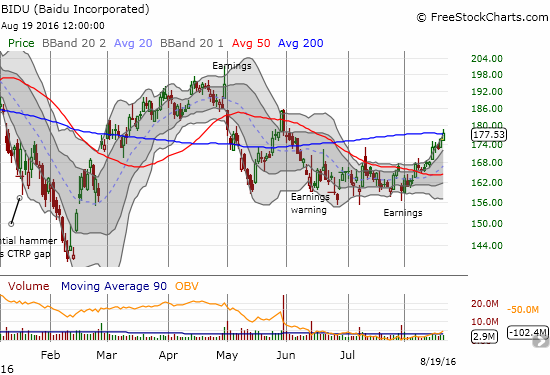
Baidu (BIDU). BIDU has experienced some drama and trauma in recent months. The stock’s fortunes may be changing with a small 200DMA breakout on Friday. This move follows a bullish 50DMA breakout that has led to a relatively swift run-up. It looks like “buy the dip” time on BIDU.
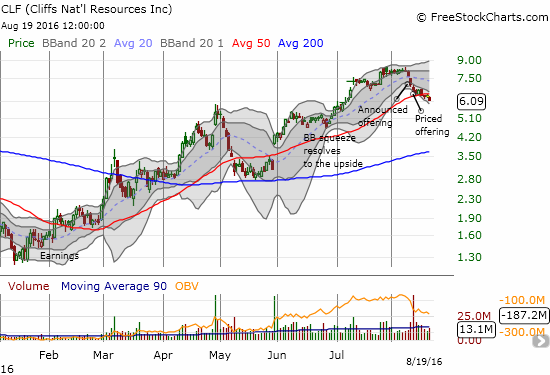
Cliffs Natural Resources (CLF)
I have watched CLF closely the past several months as a great speculative play on a recovery in iron ore. An even more important catalyst has been the implementation of steel tariffs in the U.S. which has boosted CLF’s American-based customers. However, a stock offering may have capped the rally for now. I took a chance by buying October call options when I thought the 50DMA would hold as support. Instead, CLF broke down last week and continues to follow a neat and tidy downtrend channel through the lower-Bollinger Bands (BBs). I hedged my trade a bit with put options. If iron ore sells off anew, the downside for CLF could run down quick, fast, and in a hurry.

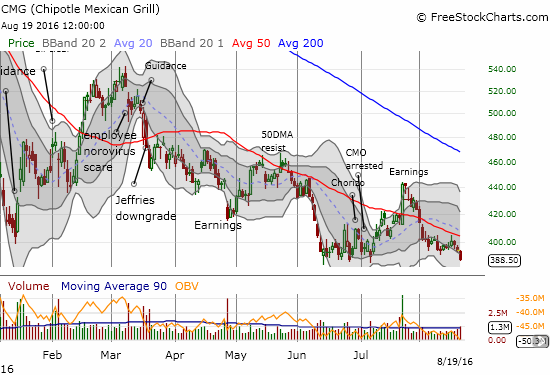
Chipotle Mexican Grill (CMG)
For several weeks, my strategy of playing CMG from the short side with put options with a small hedge of shares for the upside has worked out very well (the idea grew from my well-timed prediction of a short-lived post-earnings rebound). Last week was the first where I had to salvage pieces of both sides of the trade. With CMG looking ready for a fresh downside push, I was tempted to restart the trade as usual but decided to wait for Monday to see whether I can get a slightly better price on the put options. Note how volume surged on Friday’s retest of 2016 lows – a very dangerous spot for CMG.
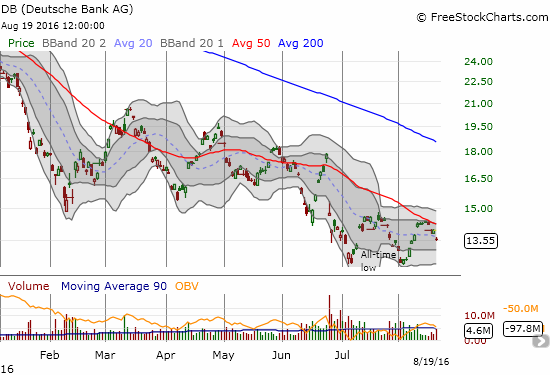
Deutsche Bank (DB)
Right on cue, DB failed a retest of 50DMA resistance. My latest put options were perfectly timed this cycle.
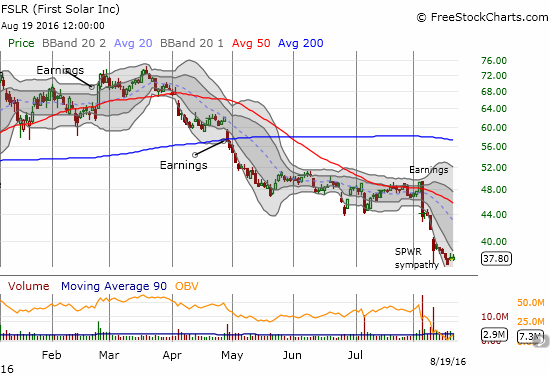
First Solar (FSLR)
FSLR has taken several hits from sellers since earnings disappointed. The stock is cheap on a valuation basis with both price/sales and price/book below 1.0, so the name is attracting bargain hunters. I understand the perspective of solar fans, but FSLR for now is one of those classic value traps: a cheap stock that manages to just get cheaper. Analysts have soured on the company and until those earnings estimates far into the future start to turn upward again, I do not see how FSLR can sustain rallies. For bottom-fishers, see my post “Anatomy of A Bottom: Do Not Argue With Sellers – Celebrate With Buyers” for rules on how to set up a good risk/reward trade. FSLR is shaping up to be a textbook case for my rules.
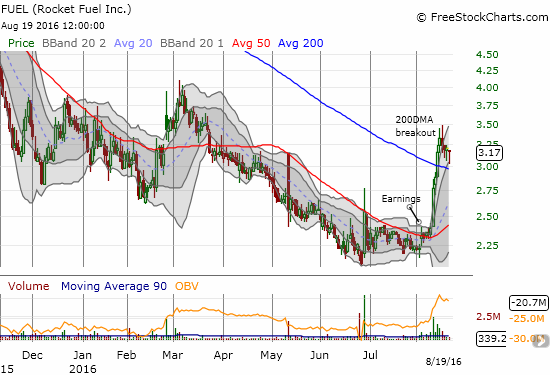
Rocket Fuel (FUEL)
After its IPO in 2013, FUEL went essentially nowhere. In 2014, the stock broke down and has barely looked up since….until the past two weeks. After posting earnings on August 2, FUEL gapped up and managed to both generate a 50DMA breakout and fill the gap. It was a subtle beginning to what has now become a full-fledged surge on the stock. THIS is a time to speculate on a bottom and celebrate with buyers on a stock that used to trade upward of $70 (I think the stock must have done at least one reverse split?). I have missed out already on two good entry points, but I will be a lot more vigilant going forward.
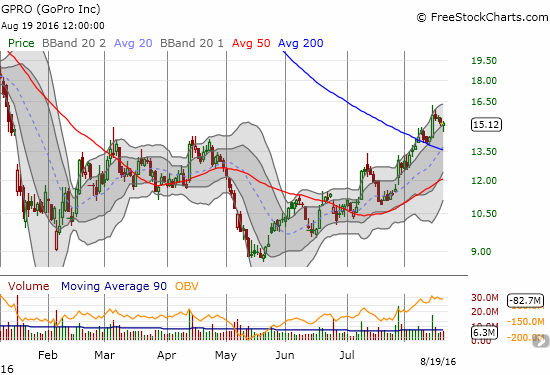
GoPro (GPRO)
I am almost embarrassed to admit I bought GPRO, but buy I did. The stock broke out above its 200DMA and then confirmed the breakout with an impressive surge on August 15th on no news that I could find. Often times I will just monitor such a play, but this is a stock that is now much maligned and has completely fallen from grace. In other words, the over-exuberance that greeted GPRO’s IPO has been taken to the woodshed and beaten with a stick. Speculation on a bottom comes with a well-defined stop below the low of the August 15th surge or the 200DMA support. I am looking at playing this one to 50DMA support if necessary. Again, time to celebrate with the buyers.
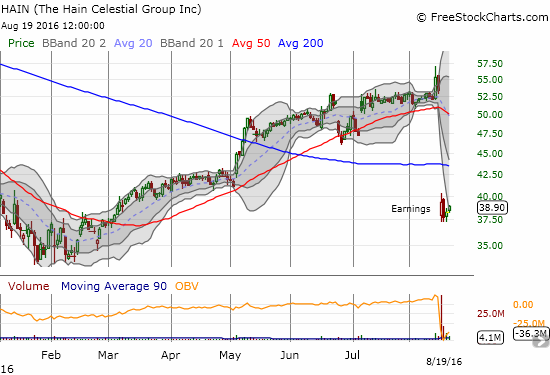
Hain Celestial (HAIN)
HAIN blew up after disappointing earnings last week. HAIN looks interesting as a bottom-fishing play because the stock has apparently stabilized very quickly. Valuation-minded investors may be picking at the stock with a price-to-sales ratio of 1.4, price-to-book at 2.2, and forward P/E of 18.2. However, HAIN had quite a post-recession run-up from single-digits to an all-time high last year of $70/share. If the current post-earnings low breaks, HAIN flips right to a short with a first target at the 2016 low around $33/share. From there, HAIN becomes a stock in secular, not just cyclical, decline.
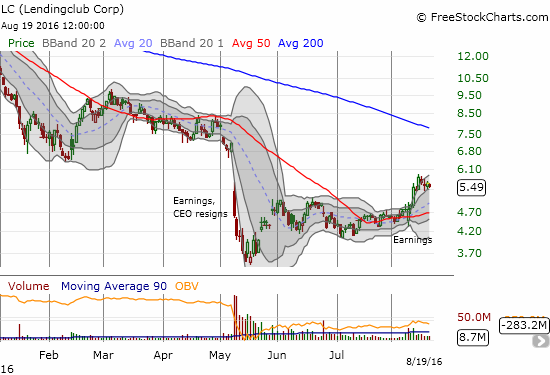
Lendingclub (LC)
LC is trying a recovery bid after a disastrous earnings in May which seemed to seal this recent IPO’s fate. The stock traded in the mid-20s after its debut in late 2014. It is now struggling in the low to mid-single digits. August earnings delivered one of those classic reversals where buyers quickly launched the stock off its post-earnings low. This move maintained support at the 20 and 50DMAs. Two more surges since then appear to solidify the buying interest in LC. The stock is finally making progress in filling May’s gap down. I am playing a potential bottom with call options.
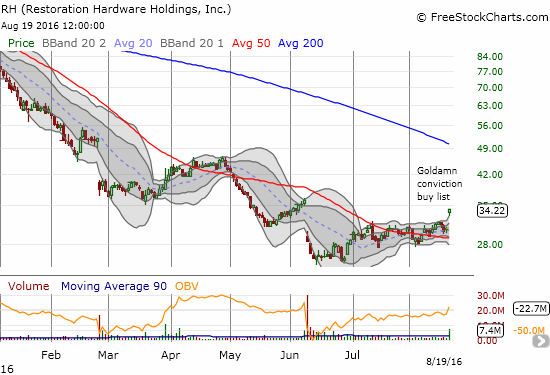
Restoration Hardware (RH)
RH is one of those stocks that investors return to market after doing a buyout of a struggling company. Catterton Partners bought the company for a mere $267M in 2007, pennies on the dollar given the single digit stock price at the time. Even after RH’s latest earnings disaster the company is worth a whopping $1.4B, around where it traded when it rolled back out to the market in late 2012. At one point RH was trading at almost three times its current value. I never cease to be amazed at the way these buyout firms can repackage damaged goods into something palatable for the market. So when Goldman Sachs (GS) upgraded RH from neutral to buy and put the company on its conviction buy list, I am assuming GS is signaling that the last earnings disaster has given investors a rare second shot to speculate on a fresh run-up. The gap up for an 11% gain on high volume appears to confirm a bottom and a 50DMA breakout.
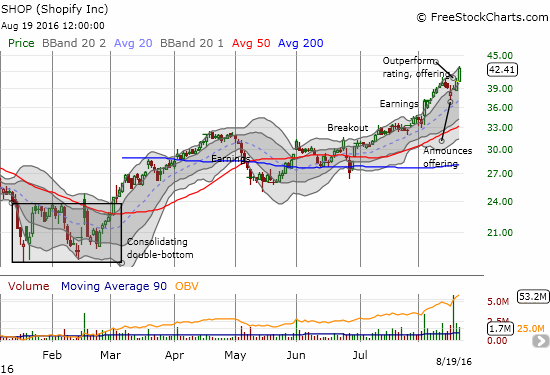
Shopify (SHOP)
SHOP will likely be my biggest miss of the year. I pointed out the nice 50DMA breakout in SHOP back in early March. I featured the stock again two weeks later in a move that seemed to confirm the 50DMA breakout even as the nascent 200DMA loomed as resistance. In between there I did a quick trade and never returned to the stock. May provided one last opportunity to get in at a “low” price. I failed to jump at the opportunity to right my wrong…even after SHOP broke out again above its 200 and then 50DMAs.
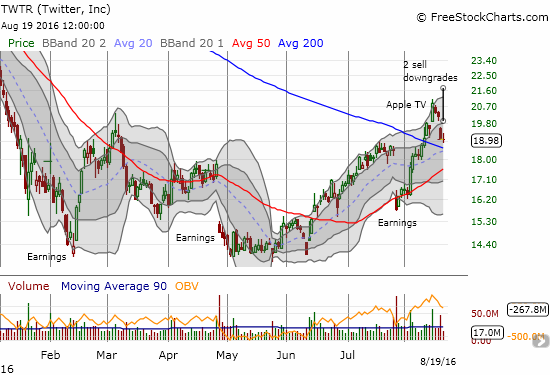
Twitter (TWTR)
I featured TWTR almost exactly a year ago in “How to Buy Twitter’s Stock for Less Than $20/Share.” My short of a January 2017 put at a $25 strike for $5.59 looked like pure genius by the time TWTR hit an October high at $32. In less than 4 months, TWTR fell to $14 and retested those all-time lows last May. A 200DMA breakout this month gives me new optimism that this long-term play will work out after all. (If TWTR gets back to $14, I will consider another purchase – TWTR is one of four internet-related plays I consider as part of a “take-out portfolio” made more enticing by the bizarre buyout of LinkedIn (LNKD) by Microsoft (MSFT). More on this idea in a later post).
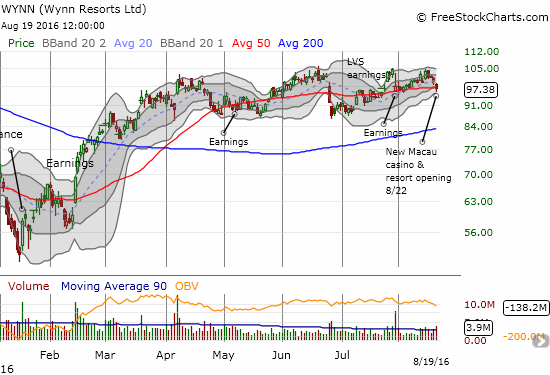
Wynn Resorts (WYNN)
WYNN is rolling out a new $4B casino in Macau as I type. This event seems like a perfect sell the news type of moment and perhaps sellers tried to get ahead of the deluge on Friday. Yet, CEO stock purchases and stock resiliency in the face of a lot of negative analyst talk has had me stick by this stock. My most recent trade is banking on the 50DMA holding firm as support – more or less. =gulp=
— – —
Reference Charts (click for view of last 6 months from Stockcharts.com):
S&2016-08-19;P 500 or SPY
U.S. Dollar Index (U.S. dollar)
EEM (iShares MSCI Emerging Markets)
VIX (volatility index)
VXX (iPath S&P 500 VIX Short-Term Futures ETN)
EWG (iShares MSCI Germany Index Fund)
CAT (Caterpillar).
IBB (iShares Nasdaq Biotechnology).
Daily T2108 vs the S&P 500
")
Black line: T2108 (measured on the right); Green line: S&P 500 (for comparative purposes)
Red line: T2108 Overbought (70%); Blue line: T2108 Oversold (20%)
Weekly T2108

*All charts created using freestockcharts.com unless otherwise stated
The charts above are the my LATEST updates independent of the date of this given T2108 post. For my latest T2108 post click here.
Related links:
The T2108 Resource Page
Be careful out there!
Full disclosure: long SDS, long UVXY shares and puts, long SVXY puts, long AAPL call options, long CLF call and put options, long DB put options, long GPRO, long LC call options, short TWTR put option, long WYNN call options