
AT40 = 68.1% of stocks are trading above their respective 40-day moving averages (DMAs)
AT200 = 65.4% of stocks are trading above their respective 200DMAs
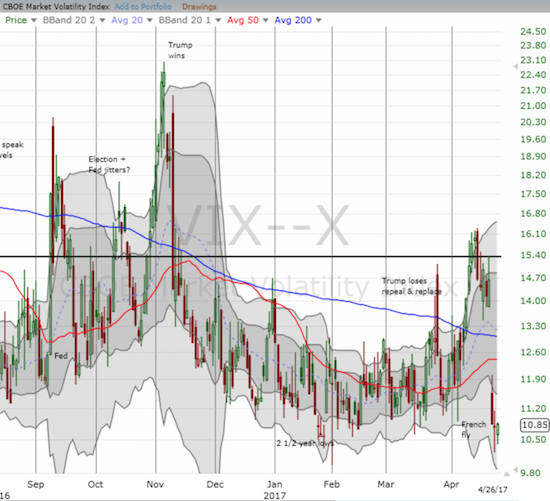
VIX = 10.9 (volatility index)
Short-term Trading Call: bullish
Commentary
AT40 (T2108), the percentage of stocks trading above their respective 40-day moving averages (DMAs), pushed into overbought territory today with an intraday high of 72.7%. AT40 pivoted around the 70% threshold over and over before closing the day in retreat. The close of 68.1% leaves my favorite technical indicator tantalizingly close to a status it last obtained 70 trading days ago on January 25, 2017 (for one precious day).
The S&P 500 (SPY) fell just short of 2,400 before fading to a flat close. If buyers do not step back in quickly, the index will risk a full retreat to 50DMA support (where I will happily reload on S&P 500 longs).
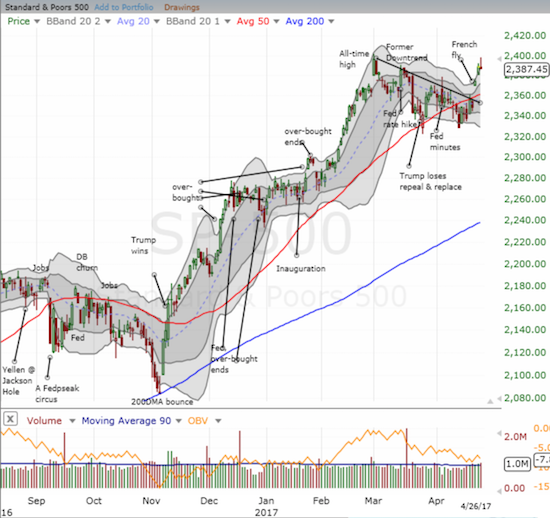
I strongly prefer some venting of steam here because hitting overbought status with the S&P 500 stretched above its upper-Bollinger Band (BB) would force me to temper my bullishness. A pullback to or close to 50DMA support would allow some room for AT40 to cross 70% without the S&P 500 in an over-stretched state.
The volatility index, the VIX, did not benefit much from the day’s reversal (which presumably was the market’s way of welcoming the announcement of President Trump’s tax plan – sell the news and/or acknowledgement of the rough road ahead).
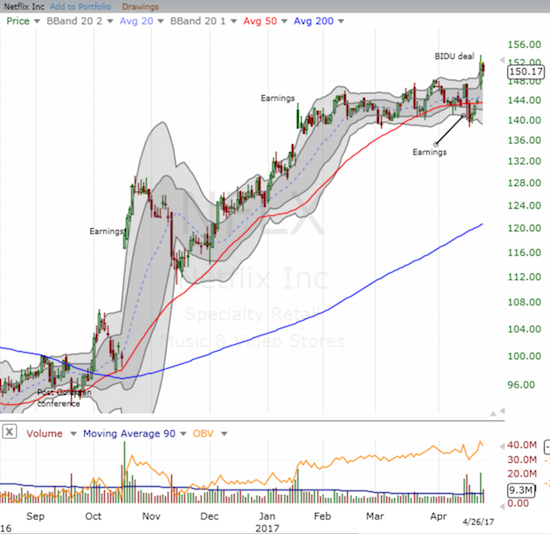
In my last Above the 40 post, I neglected to point out the big move to all-time highs by Netflix (NFLX). Last week, I shorted NFLX based on what looked like a confirmed 50DMA breakdown. The stock promptly turned around and closed above its 50DMA on Monday….where I was supposed to hit a stop loss. I forgot to set up that trade, and on Tuesday I paid dearly. The main saving grace is that I had a very small position. This was a good lesson and reminder on maintaining discipline around stop loss points. (I will now bail on a new all-time high).
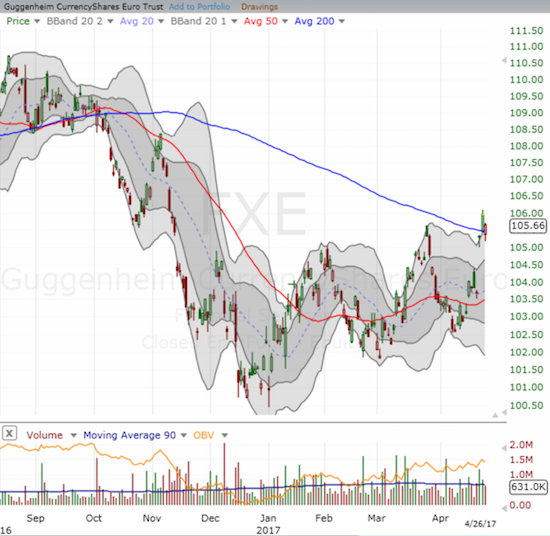
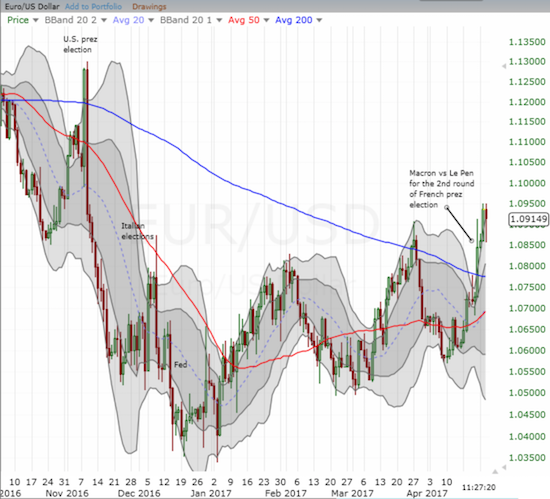
I also forgot to note that I sold and locked in profits on my call options on CurrencyShares Euro ETF (FXE). FXE printed a fantastic breakout above 200DMA resistance thanks to the French Fly. However, with FXE trading well above its upper-Bollinger Band (BB) I was compelled to sell (this is one of my regular sell rules to avoid getting caught up in an over-stretched move). Today, FXE gapped down below 200DMA support, gave back all of Tuesday’s gains, and then rallied back. I prefer this kind of volatility for the forex trading.
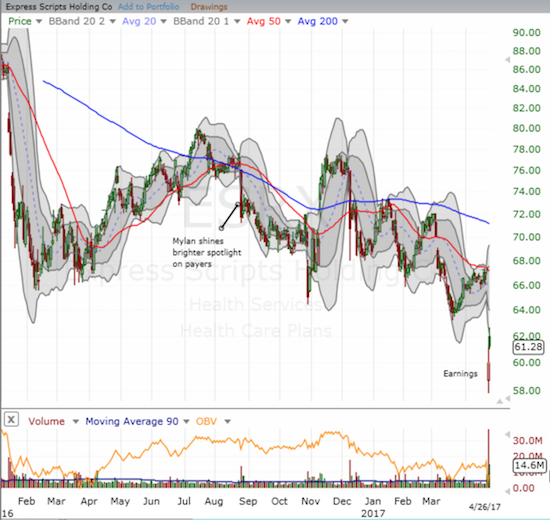
There have been some very dramatic post-earnings implosions this week that I am tracking. Express Scripts (ESRX) fell over 10% following an earnings report which included the bad news that Anthem (ANTM) will not renew its contract with ESRX. The stock made an impressive bounceback to its lower-BB, but I am looking for an entry to short. ESRX has struggled since a huge swoon in early 2016.
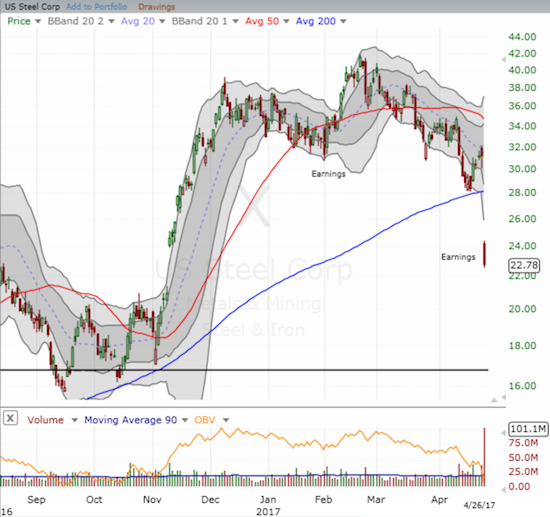
U.S. Steel (X) shocked investors with a major downward revision of forward guidance due to substantial investments the steel company needs to make. It seems X was a classic case of too much focus on the boost from government boosterism (through trade policies) and too little focus on the way X was boosting its results by avoiding re-investment in its business (see Seeking Alpha summary). I now wonder whether investors have become overly short-sighted in one fell-swoop. I am targeting a buy on a new post-earnings high. Perhaps I will do a hedged trade after volatility settles down a little more in a few more days.
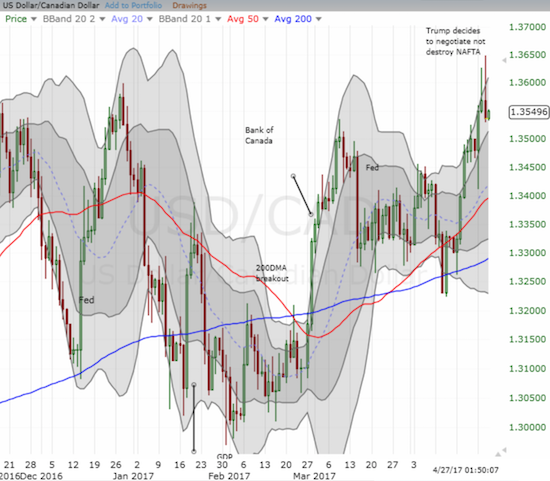
While I was editing this piece, the Trump Administration made a major announcement on NAFTA:
“President Donald Trump on Wednesday told the leaders of Mexico and Canada that he will not immediately pull out of the North American Free Trade Agreement, just hours after administration officials said he was considering a draft executive order to do just that…
‘President Trump agreed not to terminate NAFTA at this time and the leaders agreed to proceed swiftly, according to their required internal procedures, to enable the renegotiation of the NAFTA deal to the benefit of all three countries,” said the White House.'”
I found the news after wondering why the Canadian dollar was strengthening so rapidly. I decided to fade the move after seeing the news…
Buy back $USDCAD $GBPCAD Trump plan was to renegotiate in 1st place. "…Trump Won't Terminate Nafta at This Time https://t.co/rIifMzjw40
— Dr. Duru (@DrDuru) April 27, 2017
No play on $USDMXN on the Trump NAFTA news since Peso already recovered its post-election loss 2 weeks ago. #forex
— Dr. Duru (@DrDuru) April 27, 2017
So far, so good.
I am reminded that speculators recently flipped to net short the Canadian dollar (FXC). So I suspect that the rapid plunge on the NAFTA news was simply a quick trigger reaction by shorts rushing to cover.
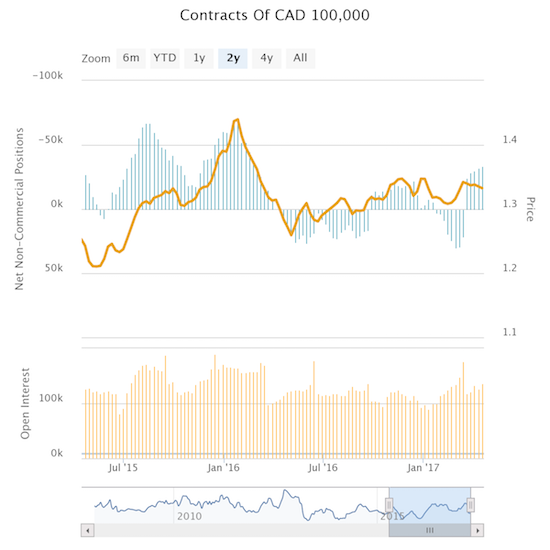
Source: Oanda’s CFTC’s Commitments of Traders
Ever since speculators flipped the script on their bullishness on the Canadian dollar, I have been looking for a spot to get aggressively short against the Canadian dollar. I think this might be the moment, but my new position is relatively small in preparation for potential accumulation closer to the bottom of the upward trend channels on both GBP/CAD and USD/CAD.
Be careful out there!
— – —
FOLLOW Dr. Duru’s commentary on financial markets via email, StockTwits, Twitter, and even Instagram!
“Above the 40” uses the percentage of stocks trading above their respective 40-day moving averages (DMAs) to assess the technical health of the stock market and to identify extremes in market sentiment that are likely to reverse. Abbreviated as AT40, Above the 40 is an alternative label for “T2108” which was created by Worden. Learn more about T2108 on my T2108 Resource Page. AT200, or T2107, measures the percentage of stocks trading above their respective 200DMAs.
Active AT40 (T2108) periods: Day #298 over 20%, Day #118 over 30%, Day #8 over 40%, Day #5 over 50%, Day #3 over 60% (overperiod), Day #70 under 70%
Daily AT40 (T2108)
")
Black line: AT40 (T2108) (% measured on the right)
Red line: Overbought threshold (70%); Blue line: Oversold threshold (20%)
Weekly AT40 (T2108)

*All charts created using freestockcharts.com unless otherwise stated
The charts above are my LATEST updates independent of the date of this given AT40 post. For my latest AT40 post click here.
Related links:
The T2108 Resource Page
You can follow real-time T2108 commentary on twitter using the #T2108 or #AT40 hashtags. T2108-related trades and other trades are occasionally posted on twitter using the #120trade hashtag.
Be careful out there!
Full disclosure: long call and put options on UVXY, short NFLX, short the Canadian dollar
*Note QQQ is used as a proxy for a NASDAQ-related ETF
Note that the trade shorting the Canadian dollar worked so well that I am already out of both positions of this comment. I am still bearish on the Canadian dollar and will look for other setups to go long USD/CAD and/or GBP/CAD.