
The last Housing Market Review covered data reported in March, 2017 for February, 2017. At that time, the iShares US Home Construction (ITB) was at the bottom of what turned out to be a very shallow pullback from a near 10-year high. The subsequent recovery has been grinding and slow, but ITB now trades above where it was at the last rate hike from the Federal Reserve. The bullish breakout for the S&P 500 (SPY) in the past week translated into minimal gains for ITB.
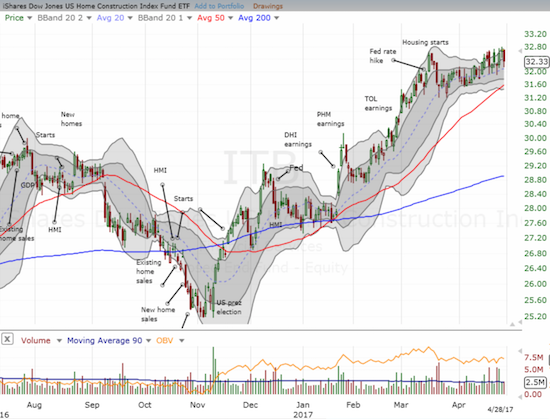
Source: FreeStockCharts.com
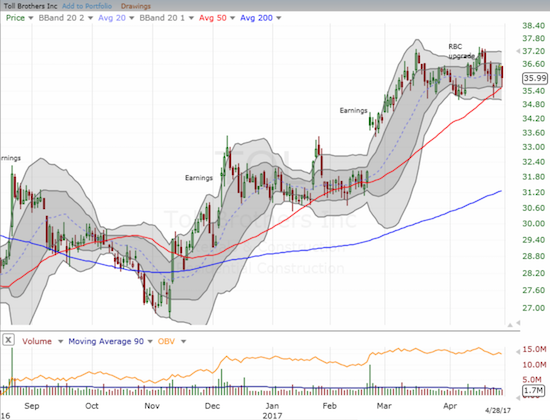
In general, the housing data once again looked strong. However with the Spring selling season in full gear, I am not surprised to see momentum in ITB slow to a crawl. The market tends to price in most of the positive lift from the Spring selling season months in advance. An upgrade of Toll Brothers on April 11th seemed to breath new life into ITB and extend the momentum of the seasonally strong period. However, ITB trades just fractionally higher than that point, and TOL trades a bit below that point now. Per my rule, I almost sold TOL once it closed the gap, but a successful test of support at its 50-day moving average (DMA) gave me fresh encouragement yet again.
New Residential Construction (Housing Starts) – March, 2017
Single-family housing starts for February were revised upward from 872,000 to 895,000. March starts dropped month-over-month by 6.2% to 821,000. This change did not break the on-going uptrend. On an annual basis, single-family housing starts gained 9.3% which was below the year-over-year increases of 11.1% in January and 13.5% in February.
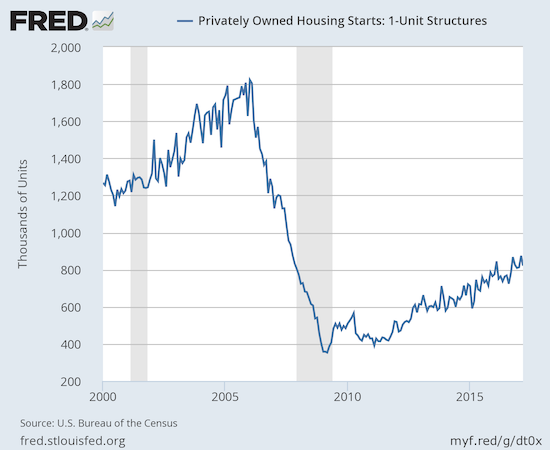
Source: US. Bureau of the Census, Privately Owned Housing Starts: 1-Unit Structures [HOUST1F], retrieved from FRED, Federal Reserve Bank of St. Louis, April 23, 2017.
Across the regions, starts varied widely. The Northeast took the #1 spot with a 19.0% gain. The South jumped a healthy 14.5%. The West continued its gains with a 6.2% increase. The Midwest was a notable laggard with a drop of 8.6%.
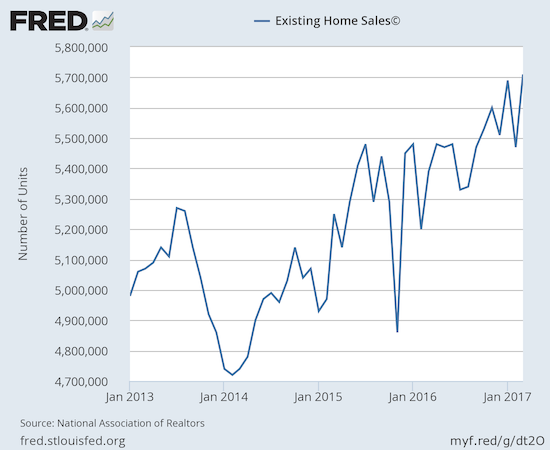
Existing Home Sales – March, 2017
For January, existing home sales returned to gains and hit levels not seen since February, 2007. For February, existing home sales dropped sharply from the previous month’s post-recession high and served up a reminder of the month-to-month volatility in this series. For March, existing home sales made a sharp rebound and set a new post-recession high (the highest in over 10 years). Right on cue, the National Association of Realtors (NAR) sounded a bit more upbeat than it did after reporting on the sharp month-over-month drop in sales in February…
“The early returns so far this spring buying season look very promising as a rising number of households dipped their toes into the market and were successfully able to close on a home last month…Although finding available properties to buy continues to be a strenuous task for many buyers, there was enough of a monthly increase in listings in March for sales to muster a strong gain. Sales will go up as long as inventory does…
Bolstered by strong consumer confidence and underlying demand, home sales are up convincingly from a year ago nationally and in all four major regions despite the fact that buying a home has gotten more expensive over the past year.”
The seasonally adjusted annualized sales of 5.71M were up 4.4% month-over-month from a downwardly revised 5.47M (from 5.48M) in sales for February. Year-over-year sales increased a healthy 5.9% (compare to November’s 15.4% year-over-year pop, December’s 0.7% increase, January’s 3.8% rise, and February’s 5.4% increase). February sales dropped to levels last seen September, 2016 while March sales jumped to levels last seen February, 2007. A continued trend higher from here would be very significant for confirming the underlying strength of existing home sales.
(recall that the NAR no longer makes data available before 2013. For more historical data to 1999 click here)
Source: National Association of Realtors, Existing Home Sales© [EXHOSLUSM495S], retrieved from FRED, Federal Reserve Bank of St. Louis, April 23, 2017.
Putting aside the NAR’s swings with the monthly volatility in the data, the main headline for existing sales remains that they have consistently trended upward despite all the reported and now well-known headwinds. The jump in sales in January demonstrated the strength in the housing market despite scarce inventory and the resulting increase in prices. The monthly decline in February did not erase that strength, especially considering year-over-year sales were up. The resurgent sales in March confirms the strength. First-time buyers are also still hanging in there. In March, first-timers were 32% of sales, same as in February, down just one percentage point from December and January, and up two percentage points from a year ago. The average for 2016 was 35%.
The absolute level of inventory of existing homes has fallen year-over-year for 22 straight months. The 1.83M homes for sale represented a 6.6% decrease from the previous March. The recent year-over-year declines have been remarkable: August -10.1%, September -6.8%, October -4.3%, November -9.3%, December -6.3%, January -7.1%, February -6.4%. In December, inventory hit a new absolute low measured from 1999 when the NAR began tracking. Now, inventory has managed to increase month-over-month for the third month in a row with a 5.8% increase in March. (So it is odd to see the NAR correlate higher inventory with higher sales when that relationship failed for February). At 3.5 months of sales, inventory stayed flat with February. In December, inventory was at 3.6 months of sales.
Investors purchased 15% of existing homes in March, down from 17% of existing homes in February, and the same as January and December, 2016. A year ago, investors bought 14% of existing homes for sale. Clearly, investor appetite is far from satiated even as the month-to-month share of sales has demonstrated significant volatility.
The West was the only region to experience a monthly decline in existing home sales. All regions logged year-over-year sales gains: Northeast 4.1%, Midwest 3.1%, South 8.5%, West 5.2%. All regions logged year-over-year price jumps: Northeast 2.8%, Midwest 6.2%, South 8.6%, West 8.0%. The price surges in the South and West make the strong annual sales increases in those regions even more impressive again given the NAR has a habit of blaming high prices for lower sales in the national numbers.
March’s 6.8% year-over-year increase in the overall median price of an existing home represents the 61st consecutive month of year-over-year increases. The median price of $236,400 is a healthy jump from February’s $228,900. Yet, the all-time record continues to fade into the distance ($247,700 set in June, 2016). Thus, it is quite possible that a year-over-year DECLINE in price may finally occur this year even with inventory at such extreme lows (watch how the housing bears growl over THAT headline!).
Single-family sales increased on a monthly basis (4.3%) and increased on a yearly basis by 6.1%. November’s 16.2% year-over-year surge was definitely an anomaly. The median price of $237,800 ended a string of monthly declines and left February’s $229,900 in the rear view mirror. The median price was also up 6.6% year-over-year.
“Single-family home sales climbed 4.3 percent to a seasonally adjusted annual rate of 5.08 million in March from 4.87 million in February, and are now 6.1 percent above the 4.79 million pace a year ago. The median existing single-family home price was $237,800 in March, up 6.6 percent from March 2016.”
New Residential Sales – March, 2017
New home sales were the big headline last August as July sales soared to 622,000 and a fresh post-recession high. I predicted that post-recession peak would not get challenged until the 2017 Spring selling season. That prediction came through right on time as March’s new home sales hit 621,000 for a 5.8% month-over-month gain and a whopping 15.6% year-over-year surge.
New single-family home sales for February were revised slightly downward to 587,000 from 592,000. Recall that December brought an end to an impressive streak of year-over-year gains. The streak may have resumed with February +12.8% and now March’s +15.6%.
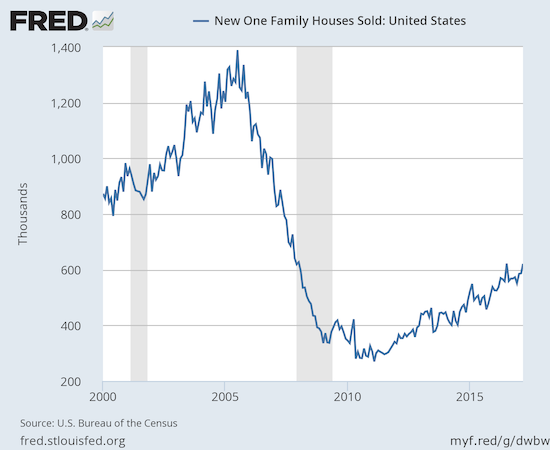
Source: US. Bureau of the Census, New One Family Houses Sold: United States [HSN1F], retrieved from FRED, Federal Reserve Bank of St. Louis, April 27, 2017.
New home inventory stayed level at 5.2 months of supply. This level continues to sit in (surprisingly) sharp contrast with the much more scarce inventory of existing homes. As a result, I do not think the relatively slow pace of home building can explain much of the strain on the inventory of existing home sales. Recall that a market for homes is in balance at 6 months of supply.
New home sales again exhibited a large range of year-over-year changes across regions, all positive. The Northeast gained 21.9%. The Midwest cooled down from February’s 50.8% gain with a 23.3% increase. The West led the pack with a 32.6% surge. The South was a major laggard at 5.9%.
Home Builder Confidence: The Housing Market Index– April, 2017
The Housing Market Index (HMI) was the most impressive data point of my Housing Market Review to end 2016. I thought the story for early 2017 would be a cooling of this red hot confidence. Instead, in March, builder confidence soared to a new 12-year high. In April, the HMI pulled back a bit by 3 points to 68.
The Housing Market Index (HMI) registered at 71 for March. That was a 6 point surge from February and a 2 point hurdle over 2016’s historically strong close. I stated in December that I did not expect confidence to get much higher than that 69 reading because sentiment was last that high at the top of the last housing bubble. Despite April’s small pullback, I now think builder confidence could set another 12-year+ high in the coming months. President Trump’s 20% tariff on softwood lumber imported from Canada represents a strong headwind to that prediction (more on this action in the parting thoughts section).
The National Association of Home Builders (NAHB) implied in November that the HMI might drop in the wake of the election. In December, the NAHB gave credit to the election for a surge in the HMI. The NAHB took the two month pullback (January and February) in stride by implying that sentiment had overheated. With sentiment heating up again, the NAHB took a familiar cautionary tone:
“Builders are buoyed by President Trump’s actions on regulatory reform, particularly his recent executive order to rescind or revise the waters of the U.S. rule that impacts permitting…
While builders are clearly confident, we expect some moderation in the index moving forward…Builders continue to face a number of challenges, including rising material prices, higher mortgage rates, and shortages of lots and labor.”
So understandably in April the NAHB called March’s reading “unusually high.” Yet, the NAHB also noted that “even with this month’s modest drop, builder confidence is on very firm ground, and builders are reporting strong interest among potential home buyers.” Indeed, all three components of the HMI are still in strong uptrends/rebounds.
Click for a larger view…
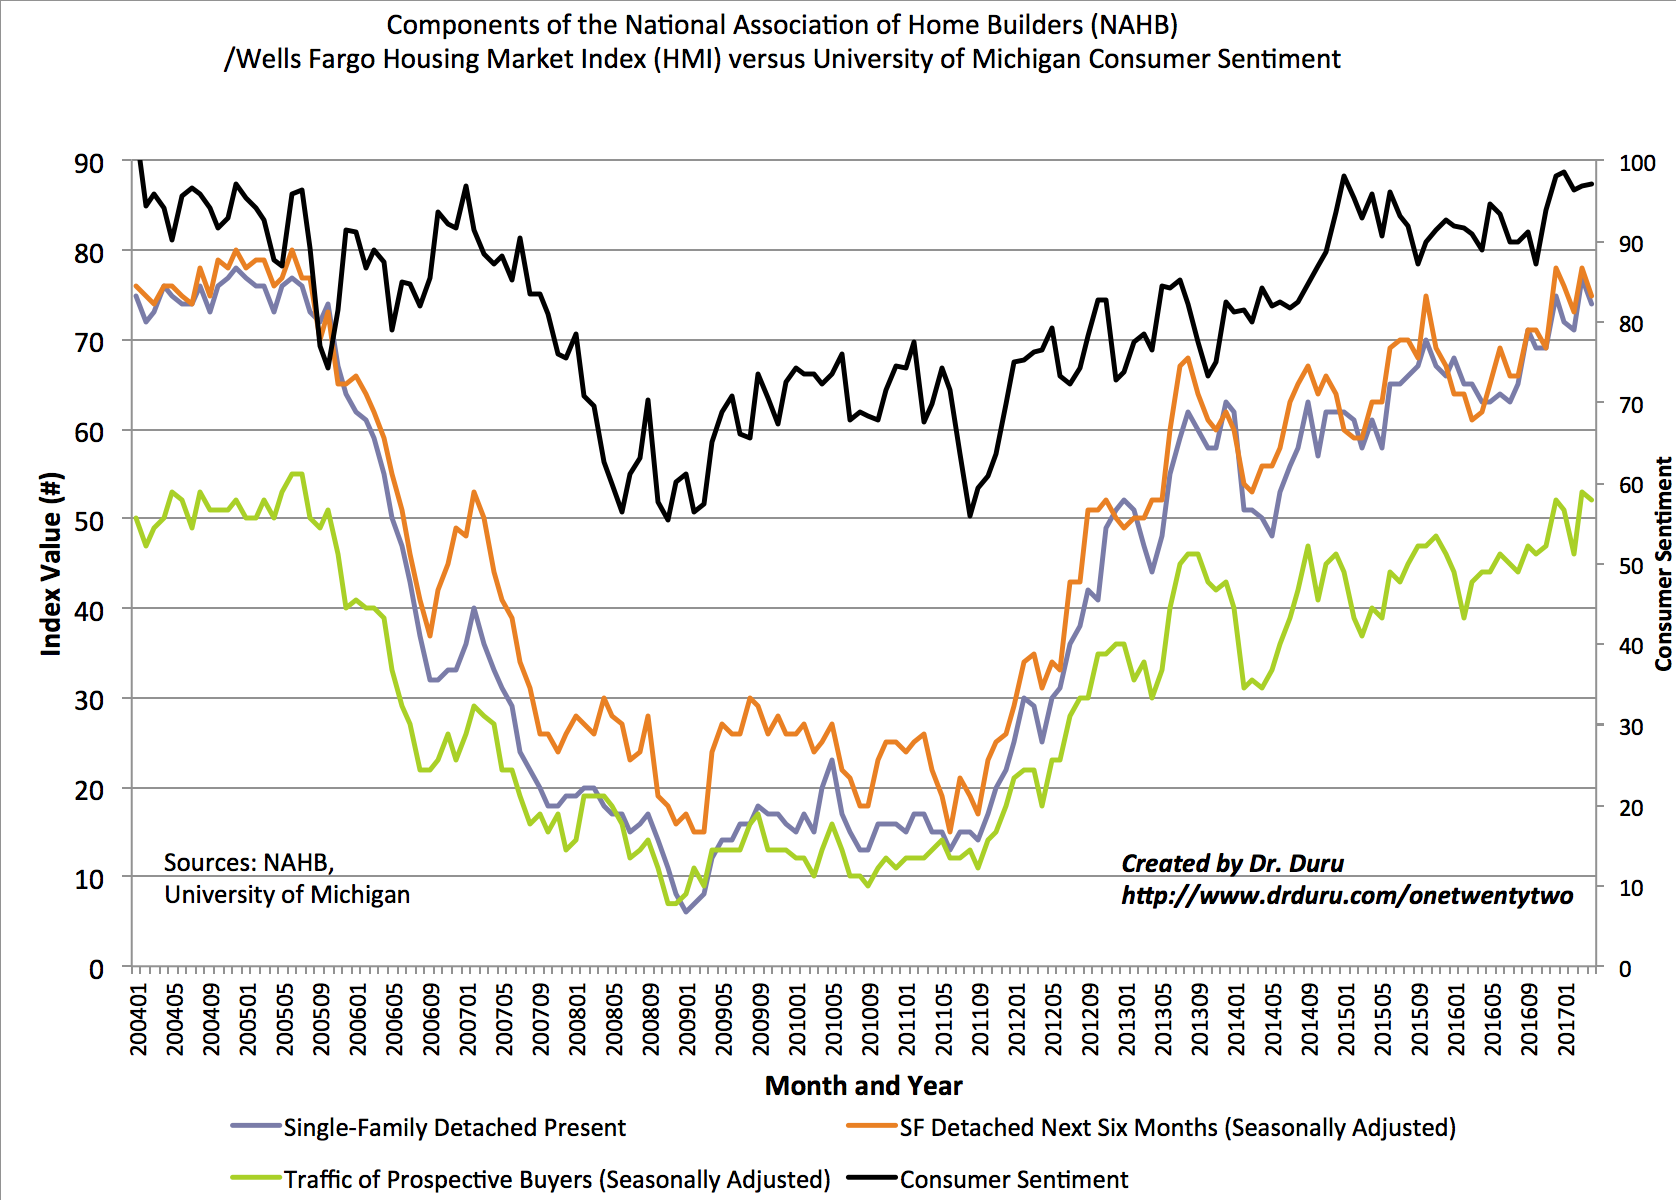
Source: NAHB
There was a wide disparity in the regional changes in HMI. Surprisingly, the West stayed relatively flat for the fourth month in a row. The sequence of 75, 76, 77, and 77 (from January to April) confirm that the 86 from December was a huge anomaly. The South dropped only one point from 71 to 70. The Midwest dropped 5 points from 72 to 67. The Northeast was the big drag with a plunge from 53 to 45. The Northeast has been particularly volatile with a sequence of 47, 57, 51, 39, 53, and 45 from November to April.
Parting thoughts
Earnings season did not deliver any dramatic headlines. The biggest mover was a gap down for Pulte Homes (PHM). Stock broke down below 50DMA support for a 3.8% loss. The stock quickly rallied back to its 50DMA.
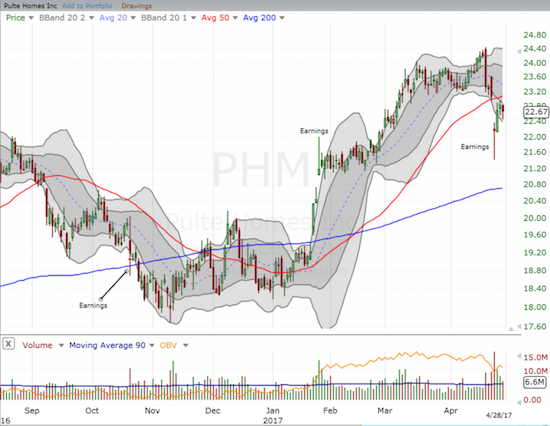
Source: FreeStockCharts.com
I saw little in the headline numbers to explain the pullback. Perhaps sellers panicked on a slightly lower than expected Q1 gross margin: “Our gross margins reflect the ongoing impact of anticipated land, labor, and materials cost increases. Margins in the quarter were also impacted by the mix of homes closed as we deliver fewer active adult homes which typically carry our highest gross margins” (from the Seeking Alpha transcript of the earnings call). However, PHM reaffirmed 2017 guidance for gross margin. PHM also delivered a very bullish outlook on housing demand for 2017:
“As we closed out 2016, there was concern in and around the housing industry about the potential impact the rising interest rates would have on buyer demand heading into the 2017 spring selling season. With the first quarter complete, it is clear that higher rates have not dampened buyer interest. In fact, it looks like the housing recovery may be picking up steam.”
Material costs have been rising for quite some time for home builders. Lumber prices in particular have moved upward strongly. The rally came to a head when on April 24th the Commerce Department announced a tariff on softwood lumber imported from Canada:
“Today, U.S. Secretary of Commerce Wilbur Ross announced the preliminary determination in the countervailing duty (CVD) investigation of softwood lumber from Canada.
Commerce preliminarily determined that exporters of softwood lumber from Canada received countervailable subsidies of 3.02 percent to 24.12 percent.
In 2016, imports of softwood lumber from Canada were valued at an estimated $5.66 billion.
As a result of today’s determination, Commerce will instruct U.S. Customs and Border Protection to collect cash deposits based on these preliminary rates. Also, since Commerce determined that critical circumstances exist, certain companies will be subject to the retroactive collection of cash deposits.”
The dispute between the U.S. and Canada over lumber stretches back decades. The current regulatory action followed on the heels of Canadian action against U.S. dairy products. President Trump was strident in his commentary when he claimed that “Canada has outsmarted our politicians for many years.” The riffs prompted the Commerce Department to issue the following statement on U.S.-Canada trade relations immediately following the lumber announcement:
“It has been a bad week for U.S.-Canada trade relations. Last Monday, it became apparent that Canada intends to effectively cut off the last dairy products being exported from the United States. Today, in a different matter, the Department of Commerce determined a need to impose countervailing duties of roughly one billion dollars on Canadian softwood lumber exports to us. This is not our idea of a properly functioning Free Trade Agreement.”
Perhaps anticipating trouble, the NAHB released a statement in mid-April pleading with the U.S. government to step carefully on the lumber issue. Apparently, Canada is now looking to China as a potential export market which might help drive up lumber prices further as the U.S. competes with Chinese buyers.
“The fact that Canada is seeking alternative sources to the U.S. for its lumber exports should serve as a wake-up call to Washington policymakers. More than one-third of the lumber used in the U.S. last year came from exports because the U.S. does not produce enough lumber to meet the nation’s needs. Home builders need a consistent, reasonably priced supply of lumber to keep housing affordable for hard-working American families.
…it would be in the best interests of the U.S. and Canada to achieve a long-term solution to the ongoing trade dispute that ensures U.S. lumber consumers have access to a stable supply of lumber at competitive prices.”
PHM addressed the lumber issue in its earnings report. Management believes that the market anticipated the impact of a lumber tariff with the price rally over the last 10-12 weeks. This explanation could help explain why home builder stocks did not react much to the announcement and also explains how Commerce Secretary Wilbur Ross can claim that this tariff will have little impact on prices going forward. Coincidentally, PHM reported earnings the next morning so some market observers mistakenly thought the drop in PHM was a result of the lumber dispute. If they had noted ITB closed near flat on the day, they would have avoid such a casual and careless mistake. Again from the Seeking Alpha transcript of PHM’s earnings call:
“I guess on the lumber tariffs, you’ve seen lumber prices move over the last 10 or 12 weeks. I think most people would suggest that’s really been in anticipation of this. And I don’t think that the announcement last night was any more significant; it might even be a little less significant than people were expecting. So volatility drives change and I’m not sure what will happen. But at this point it looks like the market has been expecting this so we don’t expect anything dramatic from that. Obviously, how it plays out over time can have an influence on our cost structure”
Nightly Business Report and the PBS Newshour produced good segments on the lumber dispute that provide background and estimated costs to the building industry…
Ironically, a few days after the dairy and lumber issues raised fresh alarms about the fate of the North American Free Trade Agreement (NAFTA), the Trump administration materially softened its stance on NAFTA by stating it wants to renegotiate rather than destroy the agreement.
The bottom-line: higher lumber prices are already baked into home builders…for now. Still, the higher prices for lumber are an unwelcome headwind and exacerbation of the lumber dispute could slow down the housing market at the margins. The tariff prevents U.S. home buyers from enjoying the subsidies from Canada’s government and in turn transfers money from home buyers to the U.S. lumber industry.
Be careful out there!
Full disclosure: long TOL