
AT40 = 42.1% of stocks are trading above their respective 40-day moving averages (DMAs)
AT200 = 59.1% of stocks are trading above their respective 200DMAs
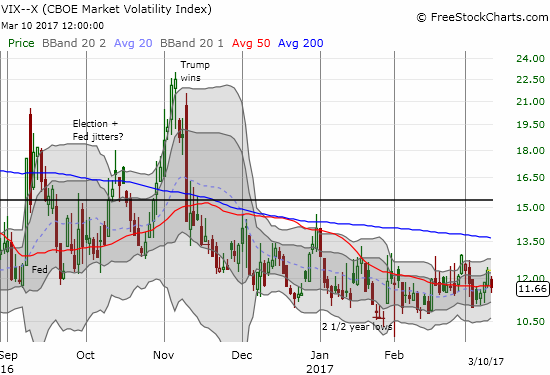
VIX = 11.7 (volatility index)
Short-term Trading Call: neutral
Commentary

The February U.S. jobs report catalyzed the next swing in the stock market’s bear-bull knife fight. I noted in my last “Above 40” post a “remarkable” bearish divergence. The S&P 500 (SPY) completed a very benign reversal of its last bullish breakout, including a gentle bounce from support at its 20-day moving average (DMA) that skirted my threshold for going bearish on the index (a close below index’s breakout point). Yet, AT40 (T2108), the percentage of stocks trading above their 40DMAs, made another big step toward oversold conditions. If not for that warning, I would flip my trading call from neutral to BULLISH just based on the market’s response to the jobs report.
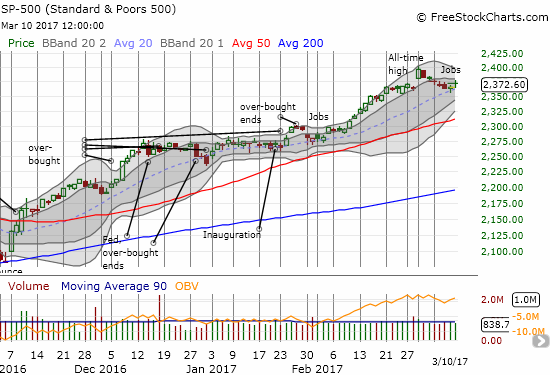
As I have noted in the past, a positive reaction to a strong jobs report is a good change of affairs. In the era of an easy and accommodating Fed, we watched the stock market celebrate bad jobs news in anticipation of a dovish Fed response and bemoan strong jobs reports in fear of the Fed. Just as we saw to start trading in March, the S&P 500 returned to marching with confidence toward a Fed rate hike in the coming week. AT40 even cooperated with a gain of two percentage points of 42%. This move does not eliminate the undertow of the market or the new bearish divergence, but it is a step in the right direction. Most importantly, this move increases the importance of the line separating the S&P 500 (SPY) from bearish territory. My bearish threshold remains below 2355. If the index manages to stay above that level after the Fed finishes its business, the market should be in good shape to crawl, walk, and skip higher. In the latter case, I will keep the trading call at neutral in deference to the deteriorating technicals under the market.
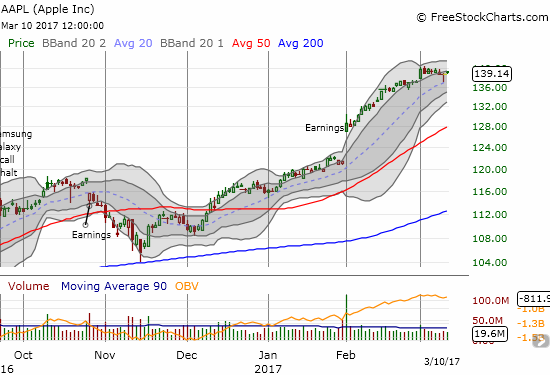
The week that I chose to get back to the short-term trade on Apple (AAPL) of course turned out to be Apple’s worst week since the end of 2016. Each day of the week except Thursday AAPL went absolutely nowhere. It closed the week with a minor loss…amazingly, the stock’s FIRST weekly loss of 2017. I must be a sucker for punishment because I reloaded on the trade on Friday…
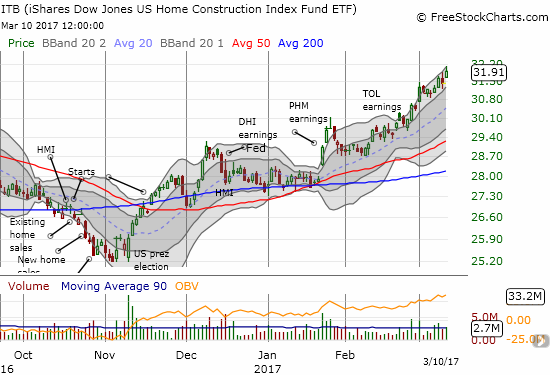
While AAPL’s 20.1% year-to-date gain is amazing after barely two months of trading, I consider the performance of home builders to stand a notch above given what many might assume would be bearish headwinds from tightening monetary policy. The iShares US Home Construction (ITB) is up 16.1% year-to-date in a move that has not provided me the buy-the-dip opportunity(ies) I anticipated. I described my latest home builder purchase in “Century Communities: Good Growth for A Cheap Price.” You can bet that home builders will be at the top of my buy list whenever we manage to get a significant pullback in the market. With construction work booming, the housing market looks as healthy as ever. From the jobs report:
“In February, construction employment increased by 58,000, with gains in specialty trade contractors (+36,000) and in heavy and civil engineering construction (+15,000). Construction has added 177,000 jobs over the past 6 months.”
Cognizant Technology (CTSH) obliged and delivered a buyable dip. As promised, I stepped up to the challenge and bought the dip. Friday rewarded me with a 1.9% gap up that confirmed support at the 50DMA. This trade should be off to the races if it can manage to hurdle the last high at $60.30.
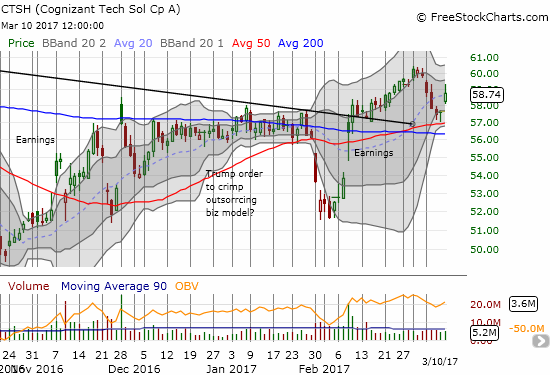
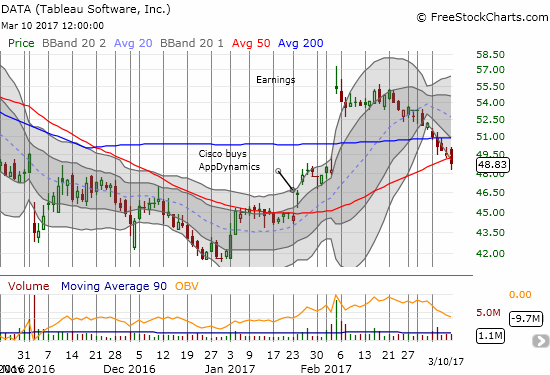
Tableau Software (DATA) must be one of the more bizarre stocks I have tried to trade in a while. Earlier I noted how the market has sold-off the stock after earnings only to buy it right back. DATA was locked into a strange wash-rinse-repeat cycle that managed to keep the stock in an upward trajectory since its major collapse February, 2016. After the stock finally reacted positively to news – the appointment of a new President and CEO in August – the stock began an extended decline. That slide ended with a 50DMA breakout in January. I thought the gap up for February earnings confirmed the new momentum, and I noted a bullish setup form against the first upper-Bollinger Band (BB). Instead of resuming the upward push, the stock just finished reversing its post-earnings gains with a marginal close below 50DMA support. I am also barely clinging to my trade on DATA here. It is almost as if traders and investors in DATA are contrarians to a fault and prefer bad news.
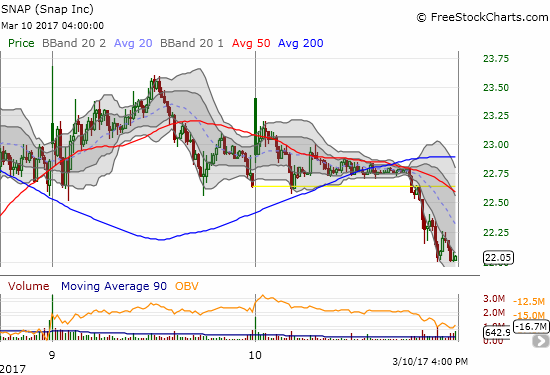
Snap, Inc. (SNAP) continues to deliver classic technical setups on an intraday basis. This time around, SNAP flatlined into a Bollinger Band (BB) squeeze. Once that move resolved to the downside, sellers swarmed in for the kill. I have added another element to my trading in SNAP now. I started with a short position and closed that out into the swoon on March 7th. I then went all long. I have decided to tuck away that long position to hold over a longer time frame, and I am managing a smaller short position for (my current) short-term trading. I hope to flip that position as early as Monday.
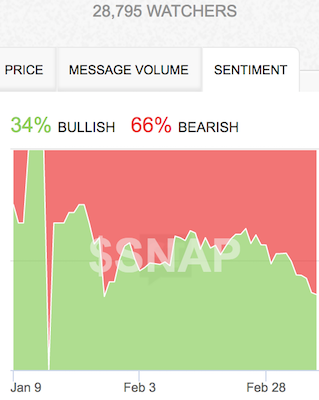
Source: StockTwits
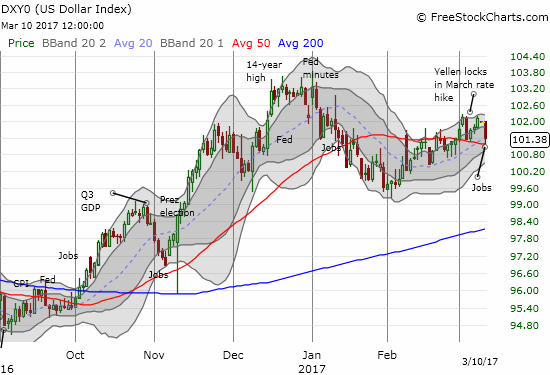
In currency action, the U.S. dollar (DXY0) once again sold on the news by swooning back to its 50-day moving average (DMA). Granted, much of this downward pressure came from a euro (FXE) boosted by rumors of a less accommodative European Central Bank (ECB), but, still, my expectation for a rallying dollar into the Fed meeting looks all but dead. However, I cannot imagine much more of a sell-the-news reaction from here, so I added more long dollar positions on the pullback.
Funny, not funny…
Borrowing a headline from CBS News: “From Fake to Fantastic”
— – —
FOLLOW Dr. Duru’s commentary on financial markets via email, StockTwits, Twitter, and even Instagram!
“Above the 40” uses the percentage of stocks trading above their respective 40-day moving averages (DMAs) to assess the technical health of the stock market and to identify extremes in market sentiment that are likely to reverse. Abbreviated as AT40, Above the 40 is an alternative label for “T2108” which was created by Worden. Learn more about T2108 on my T2108 Resource Page. AT200, or T2107, measures the percentage of stocks trading above their respective 200DMAs.
Active AT40 (T2108) periods: Day #266 over 20%, Day #86 over 30%, Day #1 over 40% (overperiod ending 1 day under 40%), Day #4 under 50% (underperiod), Day #7 under 60%, Day #38 under 70%
Daily AT40 (T2108)
")
Black line: AT40 (T2108) (% measured on the right)
Red line: Overbought threshold (70%); Blue line: Oversold threshold (20%)
Weekly AT40 (T2108)

*All charts created using freestockcharts.com unless otherwise stated
The charts above are my LATEST updates independent of the date of this given AT40 post. For my latest AT40 post click here.
Related links:
The T2108 Resource Page
You can follow real-time T2108 commentary on twitter using the #T2108 or #AT40 hashtags. T2108-related trades and other trades are occasionally posted on twitter using the #120trade hashtag.
Be careful out there!
Full disclosure: net long SNAP, long CTSH, long AAPL call options, long DATA, long CCS, net long the U.S. dollar